

[New] SPS: Introduction to Product Quality Score
Quick Navigation: Where should you start?
- Product Quality Score calculation steps → How is product quality score calculated?
- Whether appeals are supported → How to Appeal
- How to check Product Quality Score? → Feature Guide
What Is the Product Quality Score?
The Product Quality Score is a rating system that measures product experience. It refines quality assessment from the shop level down to the single-product level to pinpoint potential experience problems.
- Measures product performance: Uses a 0–5 score for the product's quality; a higher score means a better user experience.
❗️Key change: product score calculation moves from the "shop dimension" to the "product dimension"
- Old version (Product Satisfaction): Aggregates all shop orders to calculate NRR and NBFR, calculating one shop-level score.
- New version (Product Quality Score): Scores each product first, then aggregates by "product score × the product's order share" into the shop-level Product Satisfaction
- Special note: Sellers whose shop calculation category is Pre-owned will continue to be calculated using the old version’s shop-level overall calculation method. For details, see FAQ: Why does Product Satisfaction for the Pre-owned category still use shop-level evaluation?
The following section explains the calculation steps for the quality score of an individual product.

How to Calculate Product Quality Score?
Calculation Formula
Product Quality Score = NRR score × weight + NBFR score × weight
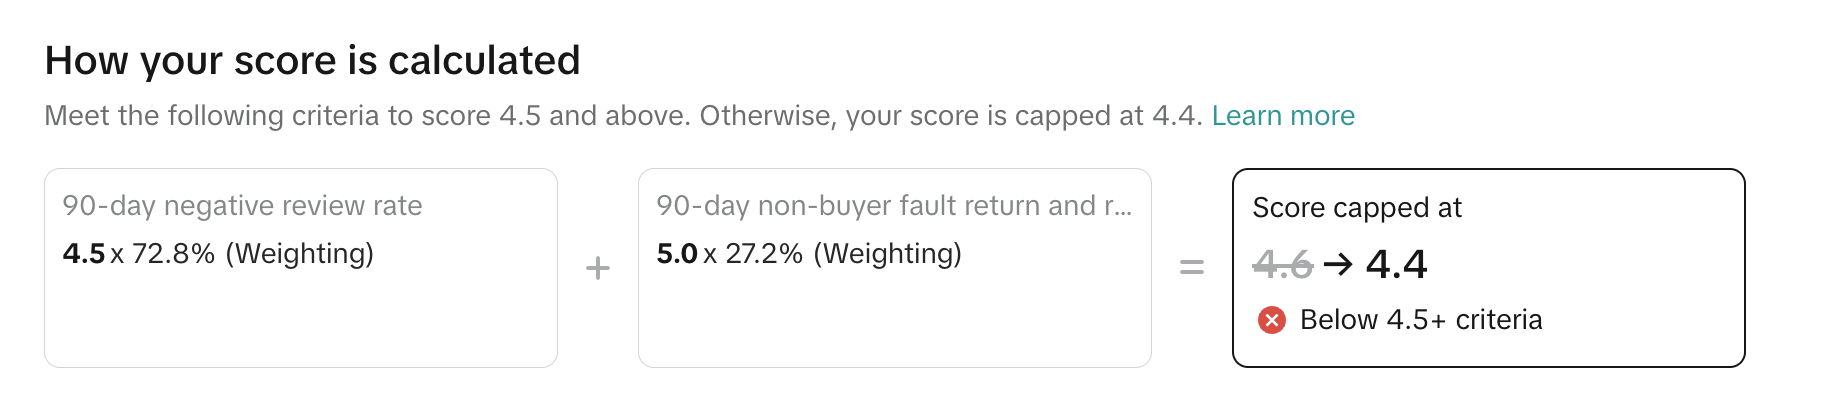
Shop-level Product Satisfaction = each product's quality score in the shop × each product's order-share weightPositive Feedback Rate doesn't enter the score calculation and only serves as a high-score threshold: to reach 4.5 or above, a product must meet the Positive Feedback Rate standard; if it fails, the product score is capped at 4.4.
Metric | Time window | Definition | Metric type |
Negative Review Rate (NRR) | 90D | Of a product's delivered orders in the past 90 days, the share that initially received a 1-star or 2-star product review.
| Scoring metric |
Non-Buyer Fault Return & Refund Rate (NBFR) | 90D | Of a product's delivered, non-cancelled orders in the past 90 days, the share where a seller- or logistics-partner-caused problem (e.g., package damage) led the customer to request a refund or return.
| Scoring metric |
Positive Feedback Rate | 90D | Share of a product's 4-star or 5-star reviews among all its reviews in the past 90 days. | High-score threshold |
#Step 1: Meet the Scoring Threshold
A product needs ≥ 5 cumulative valid orders in the past 90 days (excluding fake, sample, or gift orders).
Even without a SPS, a product with ≥ 5 cumulative valid orders in the past 90 days will receive a product quality score.
Cumulative valid orders in the past 90 days | Handling | Notes |
< 5 orders | No score calculated | Too few valid orders; no score for now. |
≥ 5 orders | Calculate product score normally | Meets the calculation threshold; enters scoring. |
Special Note:For the Pre-owned category, each product (PID) typically has only one order. Since the sample size at the individual product level is limited, the result may be unstable or less reliable. To evaluate sellers in this category more fairly:
- Sellers whose shop calculation category is Pre-owned will be evaluated at the shop level overall.
- [Updated on 10/16] For Pre-owned products under shops whose calculation category is not Pre-owned:
- One product, one order: If NRR/NBFR = 0%, the default score is 4.4; if NRR/NBFR = 100%, the default score is 2.5.
- Non-one-product-one-order cases: Scored as usual.
#Step 2: Calculate Metrics
- Negative Review Rate (NRR) = number of product orders with 1–2 star reviews / number of the product's delivered orders in the past 90 days
- Non-Buyer Fault Return & Refund Rate (NBFR) = number of product orders returned and refunded due to seller or logistics reasons / number of the product's delivered orders in the past 90 days
Metric calculation example: taking Negative Review Rate (NRR) as an example.A product had 200 delivered orders in the past 90 days and received 10 negative reviews.NRR = 10 / 200 = 5%
Small order-volume protection
- Once formal calculation starts, NRR and NBFR are each checked for small order-volume protection by delivered orders (denomintor) and problem orders (numerator). This gives low-volume products a score floor, so a small sample doesn't drag the score down:
- 5 ≤ Denominator ≤ 10 orders: default score = 3.5
- 10 < denominator ≤ 30 orders, and numerator ≤ 1 order: the metric is calculated normally but applies to a 3.5-point floor. If the actual score is below 3.5, count it as 3.5; Otherwise, use the actual score.
#Step 3: Convert Metrics to Scores
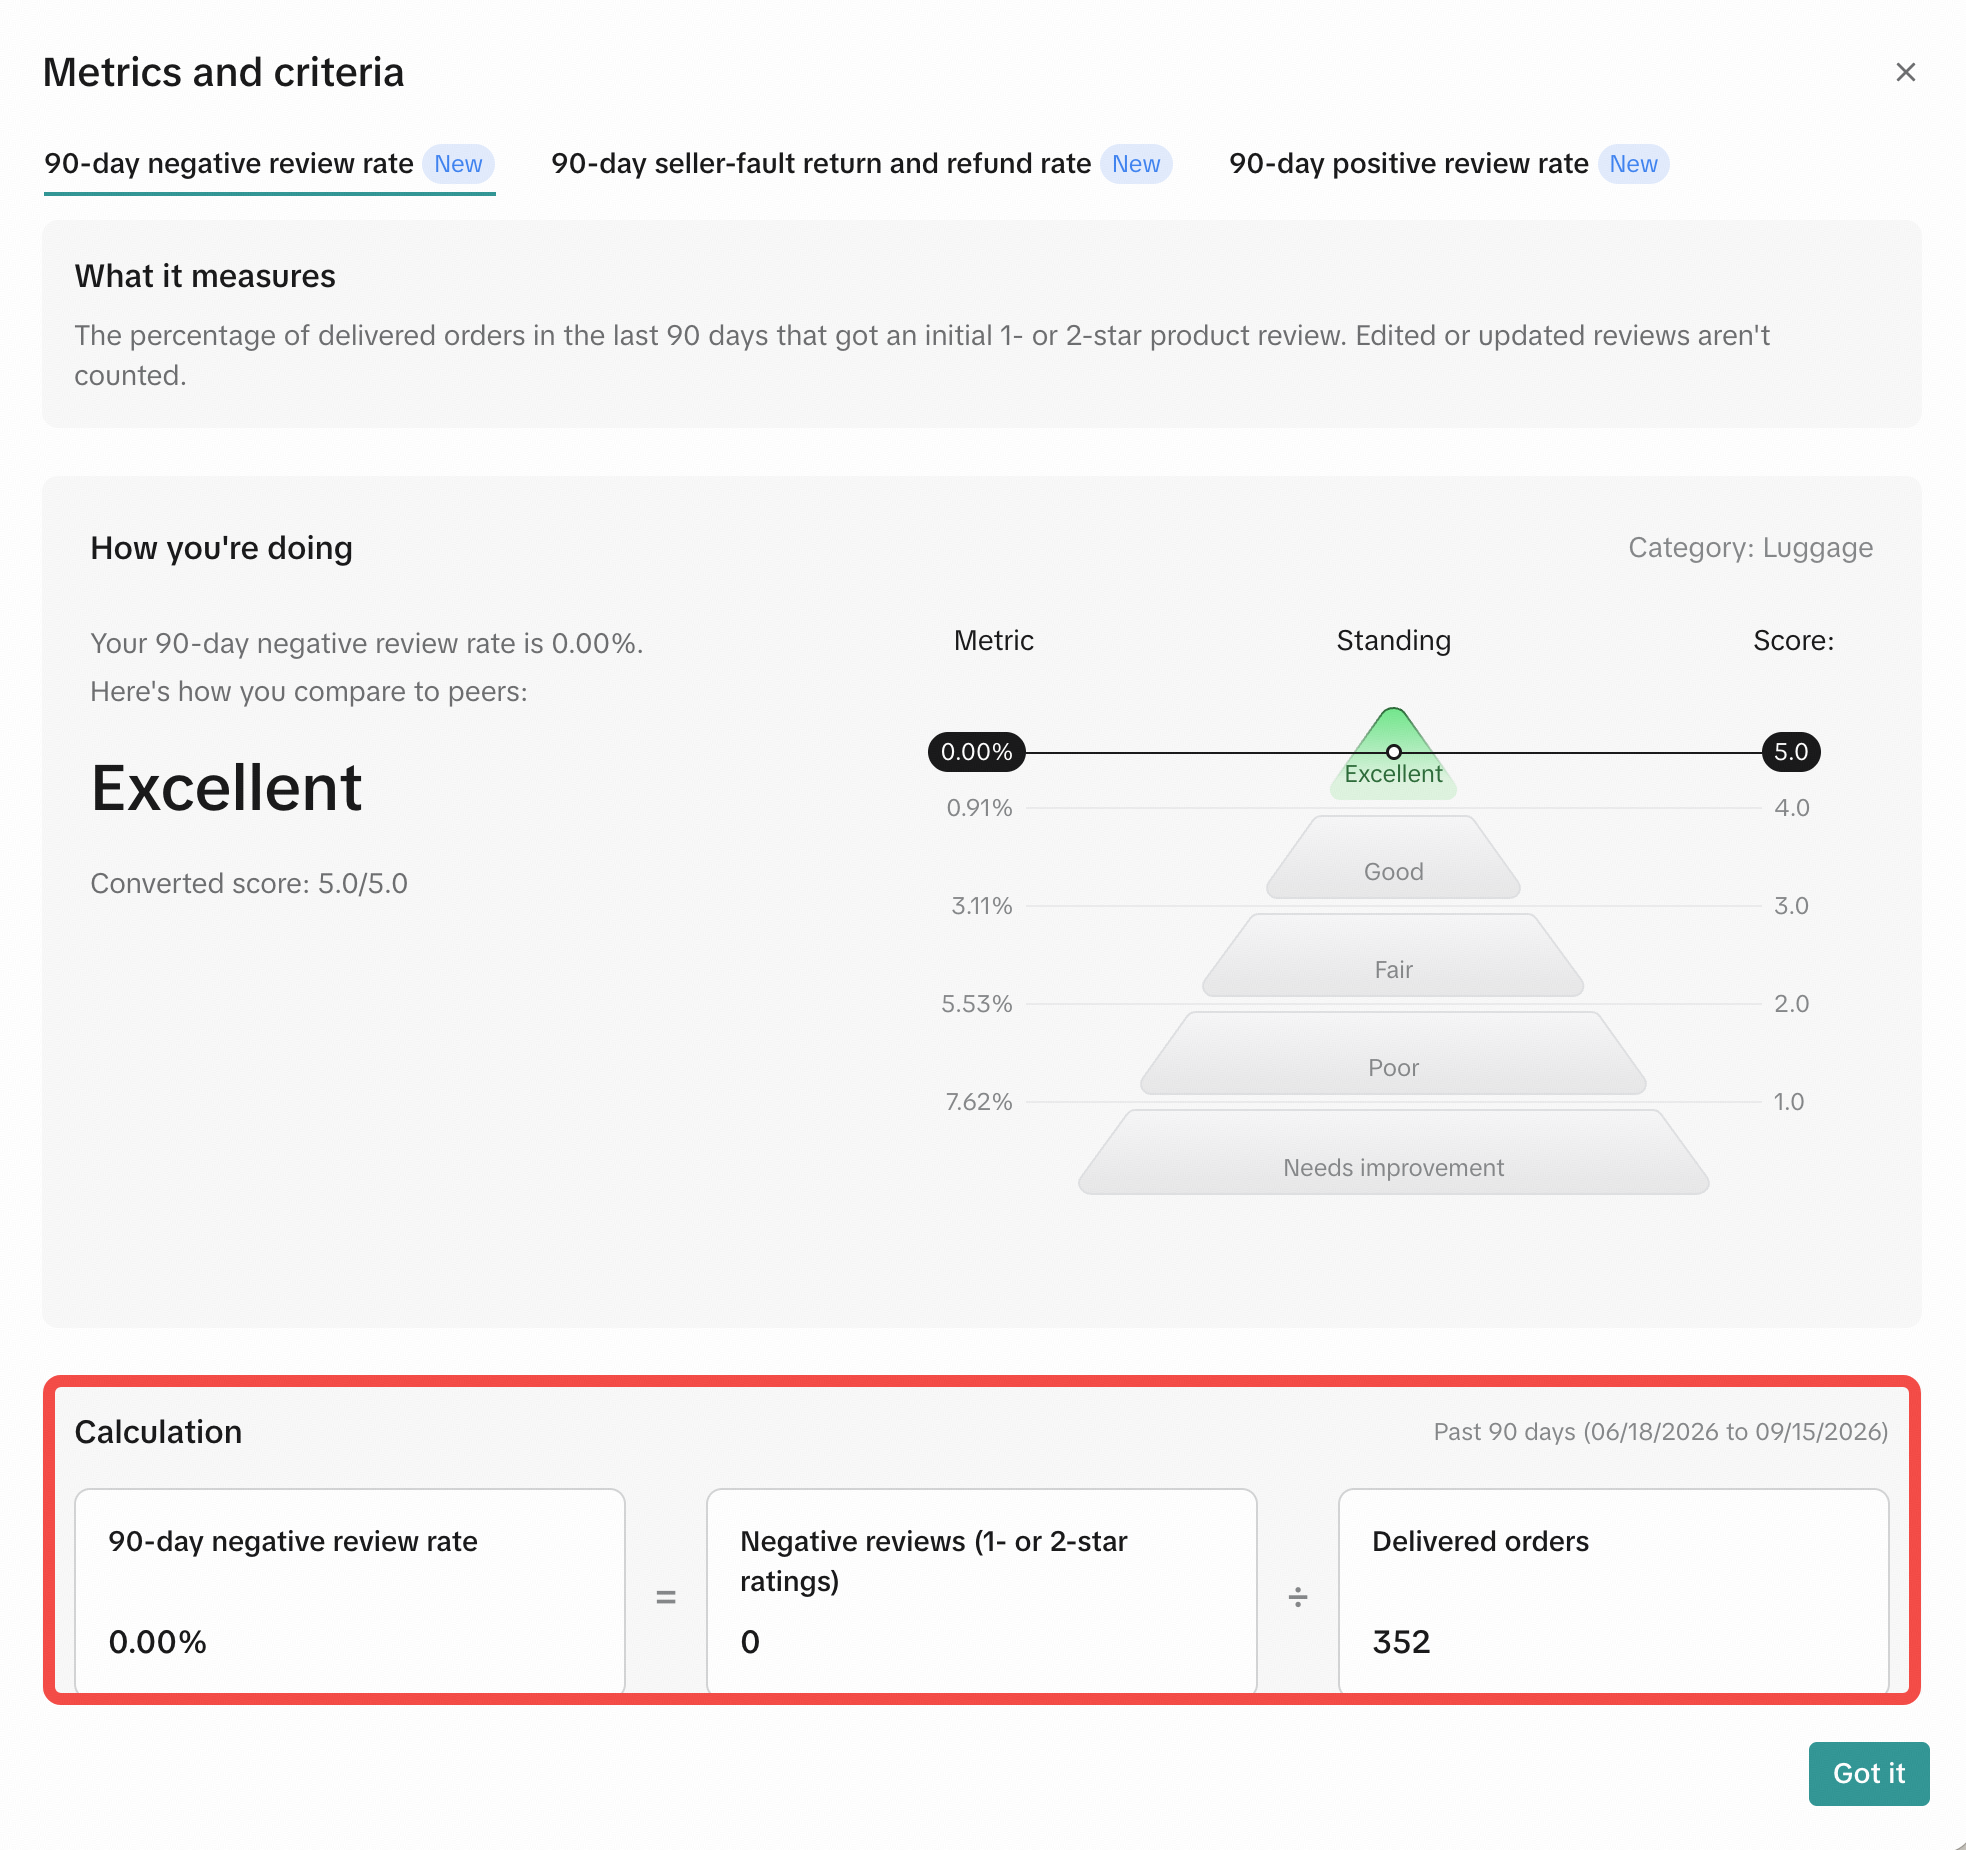
Metrics use a 0–5 point rating system, with score standards set from 1 to 4 points.
- Metric scores are converted based on the product category.
- Once a metric meets a score-tier standard, it earns at least that score; better performance leads to a higher score.
💡 Product Scoring Track Note:
- This is not based on the shop’s calculation category. It is determined by the product’s actual category and price band.
- The third-level category is used by default. If there are too few products in that category, the second- or first-level category is referenced.
Score conversion example: taking Negative Review Rate (NRR) as an example.Product A and Product B belong to Socks, and price band is high. In this track, NRR corresponding to the 3-point tier is 2%, and NRR corresponding to the 4-point tier is 1.5%. NRRs of Product A and Product B over the past 90 days are 1.5% and 1.6%, respectively.
- Thus, Product A’s NRR metric score is 4 points, while Product B’s NRR metric score falls within the 3–4 point range.
- Based on Product B’s NRR ranking within the Socks-high, Product B’s NRR metric score is calculated as 3.2 points.
#Step 4: Derive the Product Quality Score
- Initial score = NRR score × metric weight + NBFR score × metric weight
Metric weight allocation varies by scoring track.
- If the initial score ≥ 4.5, check the high-score threshold
High-score threshold
- Positive Feedback Rate: ≥ 90%

Initial score | High-score threshold check | Final score |
< 4.5 | No high-score threshold check | Take the initial score |
≥ 4.5 | Positive Feedback Rate meets the standard | Take the initial score |
≥ 4.5 | Positive Feedback Rate does not meet the standard | Capped at a maximum of 4.4 |
Full example:A product belongs to Womenswear, and price band is high. In the past 90 days, it had 200 delivered orders, including 2 return & refund orders and 5 negative reviews. Assume that, in this track, the 4-point standard is 2.5% for NRR and 1% for NBFR, with each metric weighted at 50%.
- Metric calculation:
- NRR = 5 / 200 = 2.5%
- NBFR = 2 / 200 = 1%
- Metric scores: Both NRR and NBFR meet the 4-point standard for the product track, so both metric scores are 4.0.
- Initial product score: Based on the 50% weight for each metric, product quality score = 4.0 × 50% + 4.0 × 50% = 4.0
- Threshold check: The initial product score is < 4.5, so the high-score threshold check is not triggered → final product quality score: 4.0
How to appeal?
- SPS plays an important role in shop exposure, buyer trust, and overall business success, so maintaining a high SPS is critical. However, we understand that SPS drops are sometimes caused by factors beyond the seller's control, such as buyer mistakes, logistics issues, or system errors. The SPS Appeal feature allows sellers to directly initiate appeals and take action on SPS metrics they believe have been incorrectly evaluated.
- The appealable scenarios and reasons for each SPS metric are as follows:
Metrics | Scenario (Appeal Reason) | ||||
NBFR Non-Buyer Fault Return & Refund Rate (NBFR) | Inaccurate Buyer Selected Reason | Perception Issues | Malicious Return and Refund | Logistics Issues | TikTok System Issue |
Negative Review Rate (NRR) | Malicious Reviews | Creator False Promotion | Logistics Issue | ||
IM Dissatisfaction Rate | TikTok System Issue | Uncontrollable Event/Unforeseen incident | Malicious Buyers | ||
After-Sales Handling Time (AHT) | Malicious Buyers | TikTok System Issue | Uncontrollable Event/Unforeseen incident | ||
Seller Fault Cancellation Rate (SFCR) | Malicious Buyers | TikTok System Issue | Uncontrollable Event/Unforeseen incident | ||
| Dispatch Time | Weather or Natural Disasters | Technical Issues with TikTok Shop Seller Center | Missing scans by TikTok Shipping - Standard Delivery | ||
| Transit Time | Weather or Natural Disasters | Technical Issues with TikTok Shop Seller Center | Order IDs are Lost or being Returned to Shipper | ||
- For specific appeal methods, please go to: How to Appeal Your Shop Performance Score (SPS) Metrics
Feature Guide: How to Check the Product Quality Score?
Step | Module & Features | Product UI & Details |
Step 1: Understand overall performance | [Shop Product Satisfaction Overview]
| New version adds traffic benefits at the product level: traffic incentives are set for each product based on its product quality score.  |
Step 2: Identify low-score products | [Product List] Lists each product in the shop from highest to lowest sales. | A prioritize product with high sales but Poor performance or Needs Improvement, as it may be the key factor lowering your shop-level Product Satisfaction.
|
Step 3: View product score details | [Individual Product Quality Score Overview]
| Click <View Details> to the detail page of Individual Product ↓  |
[Score Calculation Formula] Helps sellers understand how an individual product's score is calculated. | Due to the high-score threshold check, an individual product’s score calculation may fall into one of the following three cases:
| |
Still have questions about the score calculation? Click <learn more> to view: [Detailed Calculation Rules]
|  Click <learn more> to go to the detailed calculation rules. ↓ 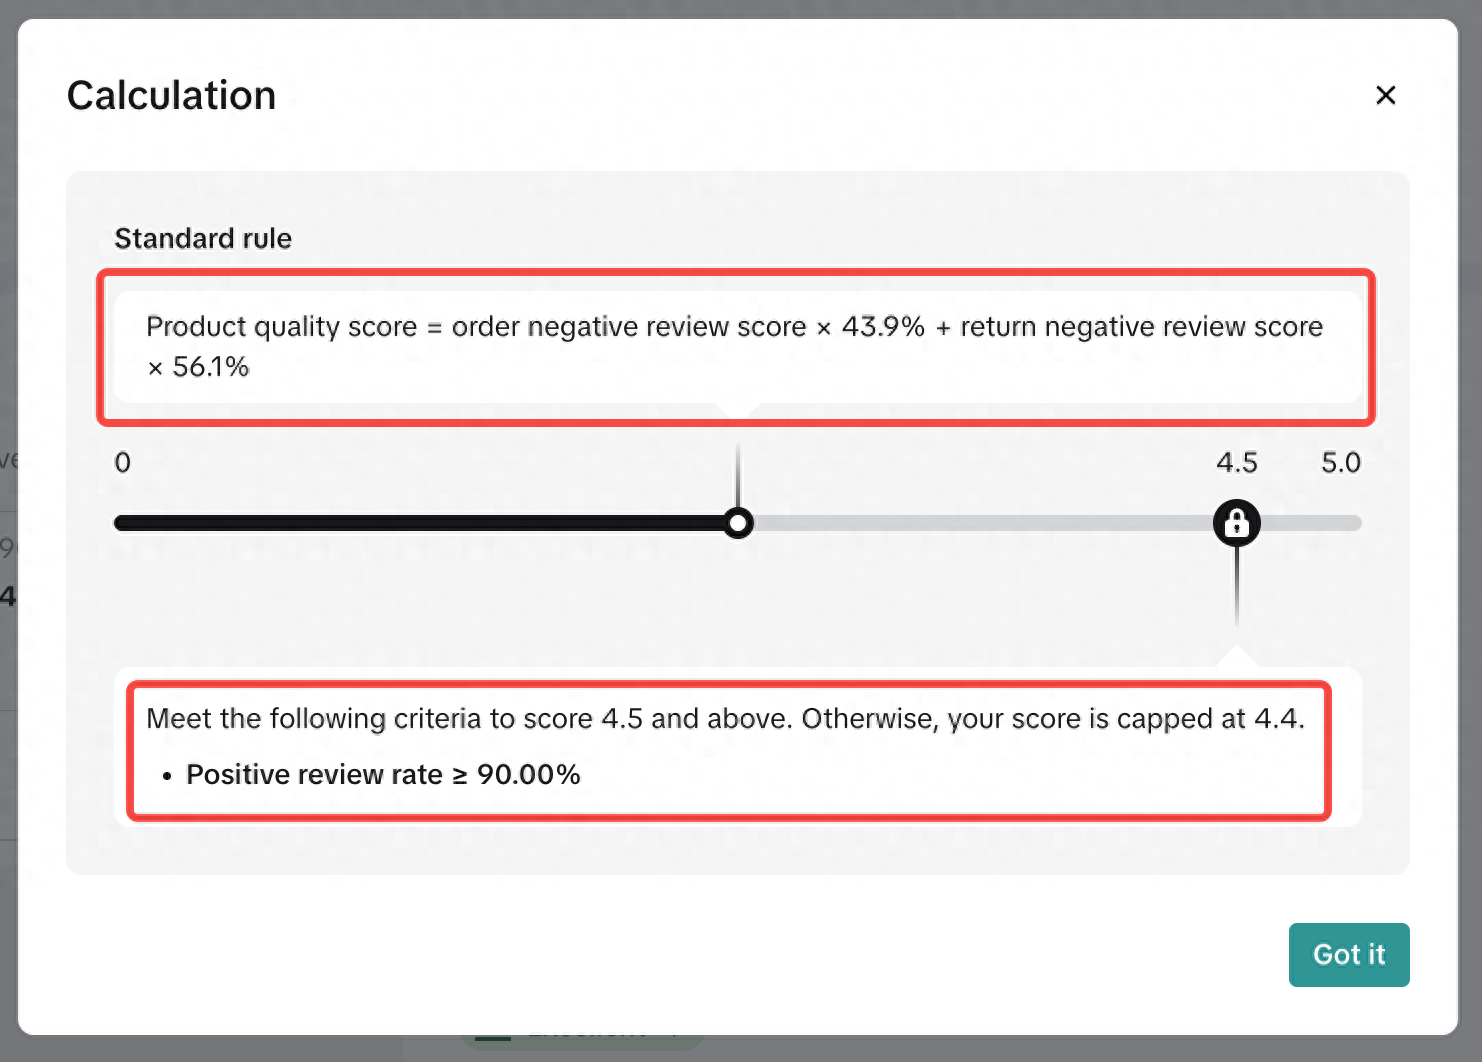 | |
Step 4: Identify problem metrics | [Metric Card]
Track metric trends and respond promptly to any changes. Quickly compare the category benchmark against top sellers. |  |
If you have any questions about metric definitions or calculations, focus on this module❗️[Metric Details]Click the button in a metric card to view:
|  Click the button in the metric card to view metric details. ↓ 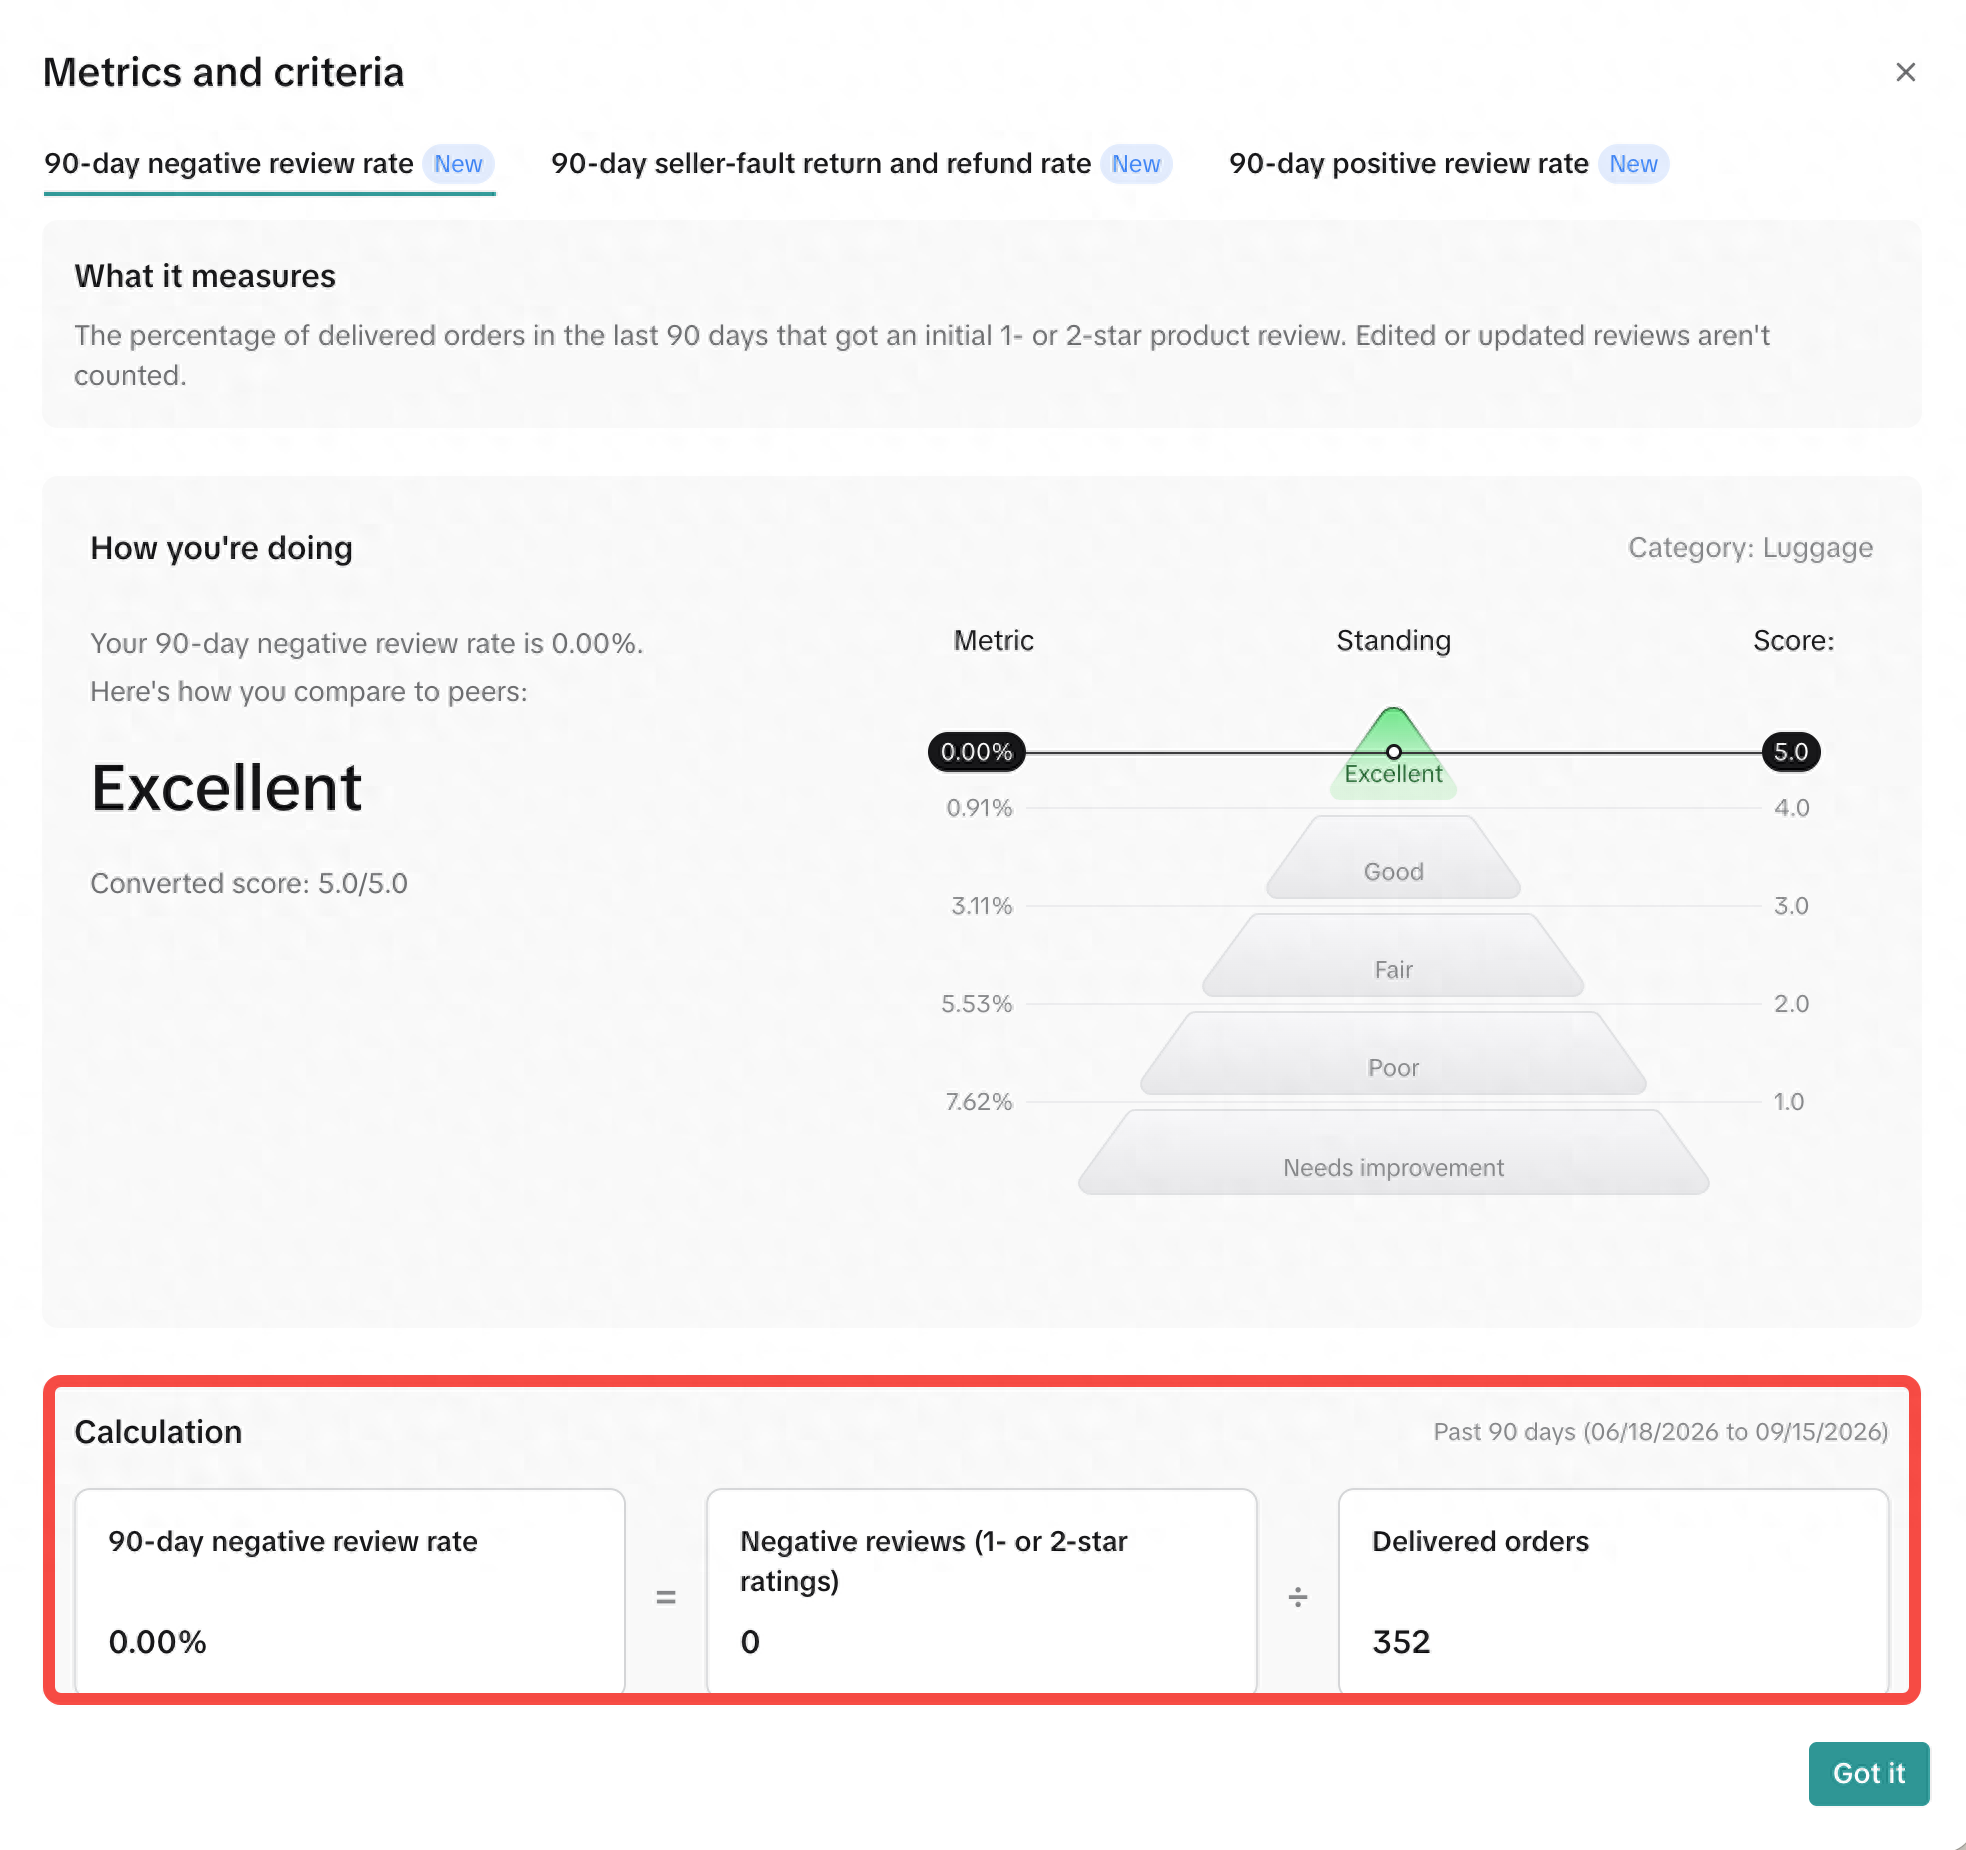 | |
[High-Score Threshold] Check whether the positive metric meets the high-score threshold. [Metric Details]Click the button to learn more about the positive metric. | 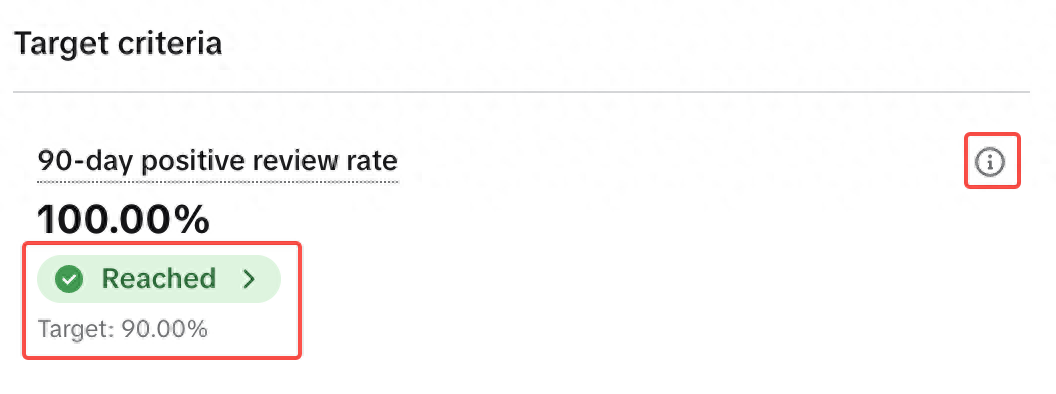 Click the button in the metric card to view metric details. ↓ 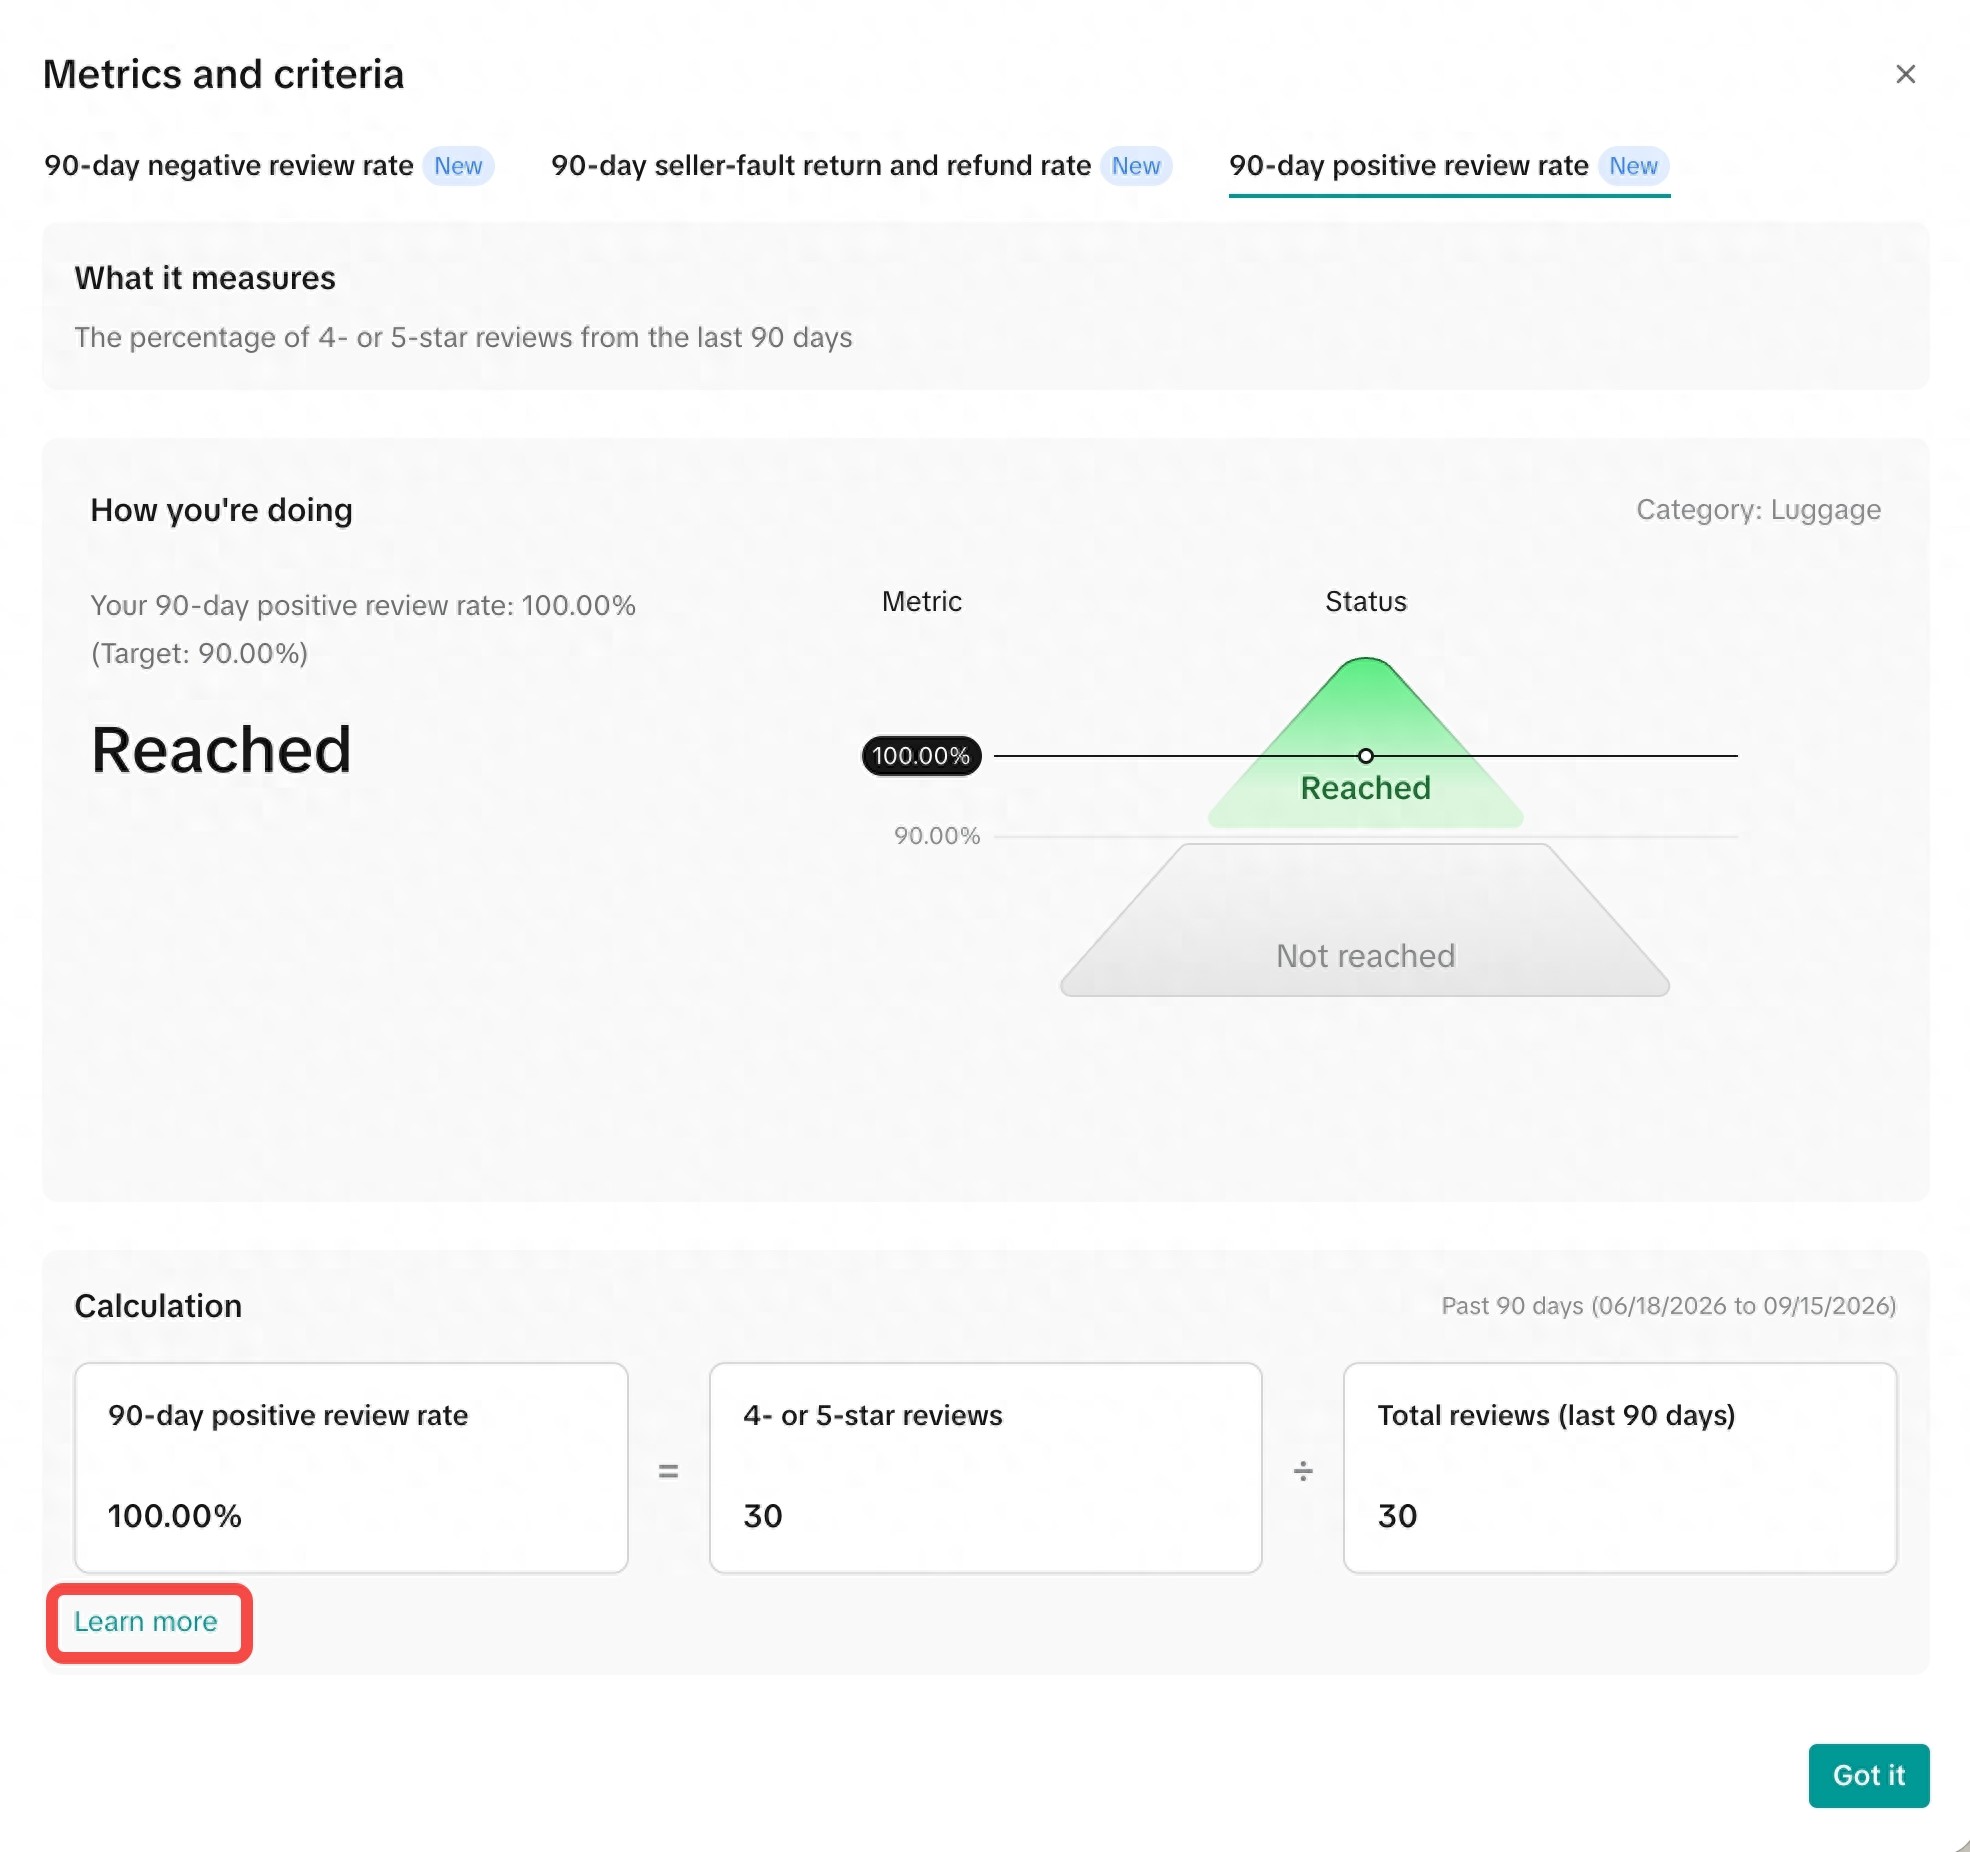 | |
Step 5: Locate affected orders | [Affected orders Details] View order details within the shop. Taking NRR as an example, this module shows all orders with 1- and 2-star reviews, along with the related issue type and severity level. |   |


FAQ
Why do my products have scores, but my shop doesn’t?
Product-level and shop-level scoring thresholds are different.- Product level: A product can receive a score once it has 5+ delivered orders in the past 90 days.
- Shop level: A shop receives an SPS only after it has 30+ delivered orders in the past 90 days.
Excludes fake orders, sample orders, and gift orders.
Can a product be excluded from scoring after it is delisted or deleted from the shop?
No. All products and their valid orders within the statistical period are counted, regardless of product status.
Why do two products in the same category have different metric weights and scoring standards?
When setting metric weights and scoring standards for product-related dimensions, both category and price band are taken into account. Each product is assigned to a scoring track based on its category and corresponding price band, then compared and ranked against products in the same track to determine its metric score.[Updated on 10/16] A 90-day average price logic has been added when determining price bands to reduce the impact of short-term price fluctuations on price band assignment.
Why do Pre-owned shops and products use a special scoring logic?
In the new version, Product Satisfaction is calculated at the product level first, then weighted into the shop score by each product’s order share. A product needs at least 5 valid orders in the past 90 days to be scored.For Pre-owned, one product ID usually corresponds to only one order, so product-level samples are too small and may lead to unstable results. To ensure fairer evaluation:
- Sellers whose shop calculation category is Pre-owned — meaning they mainly sell Pre-owned products — will be evaluated at the overall shop level, with a 90-day window for NRR and NBFR.
- [Updated on 10/16] For Pre-owned products sold by shops whose calculation category is not Pre-owned:
- One-product-one-order: default score is 4.4 when NRR/NBFR = 0%, and 2.5 when NRR/NBFR = 100%.
- Other cases: normal scoring applies.
Previous[NEW] Guide to VoC (Voice of Customer)Next [New] SPS: Introduction to Logistics and Fulfillment Score
You may also be interested in

AI Homepage: Reinventing the TikTok Shop Seller Experience
What is the AI Homepage? The AI Homepage isn’t just a new dashboard, it’s a game-changing, AI-powere…

[New] Introduction to Shop Performance Score New Version (US…
Quick Navigation: Where should you start? Protection Strategy for BFCM → How will SPS metric scores…

[New] SPS: Introduction to Logistics and Fulfillment Score
Quick Navigation: Where should you start? How is each metric calculated? → Dispatch Time / Transit T…

[NEW] Guide to VoC (Voice of Customer)
What is VoC? Voice of Customer (VoC) is a seller-facing analytical tool that helps you find, underst…