

How to Use Product Analytics
09/11/2025
Summary
What key analytics features does TikTok Shop provide to help sellers monitor and improve product performance?
- TikTok Shop’s Analytics > Product tab offers product lists with status, GMV, orders, and sales metrics, plus filters by category, status, and time range for detailed insights.
- Detailed pages provide visual charts on sales trends, traffic funnels, top-performing content/creators, and promotion effectiveness to identify issues and optimize strategies.
How can sellers use traffic data and metrics to identify sales issues and optimize product performance?
- Traffic breakdown includes listing impressions, page views, click-through rate, and conversion rate, helping sellers pinpoint if sales issues stem from content or product appeal.
- Traffic source analysis across Content, Ads, and Shop tabs reveals which channels drive most traffic and GMV, enabling sellers to adjust marketing focus accordingly.
What insights are available regarding SKUs, ratings, inventory, and pricing to support sellers’ decision-making?
- Sellers can view SKU-level GMV, units sold, and orders to identify best sellers; monitor product ratings, reviews, and returns to assess customer satisfaction and product quality.
- Inventory data shows current stock and estimated sell-out days; pricing trends over 90 days help track pricing impact on sales and refine pricing strategies.
What tools or suggestions does TikTok Shop provide to help sellers boost product traffic and sales?
- The platform offers “Suggestions for you” with actionable links and programs tailored to current performance for content creation, marketing, and product growth.
- Key metrics charts and exportable data enable sellers to analyze trends and make data-driven decisions to enhance traffic and conversions.
Getting Started
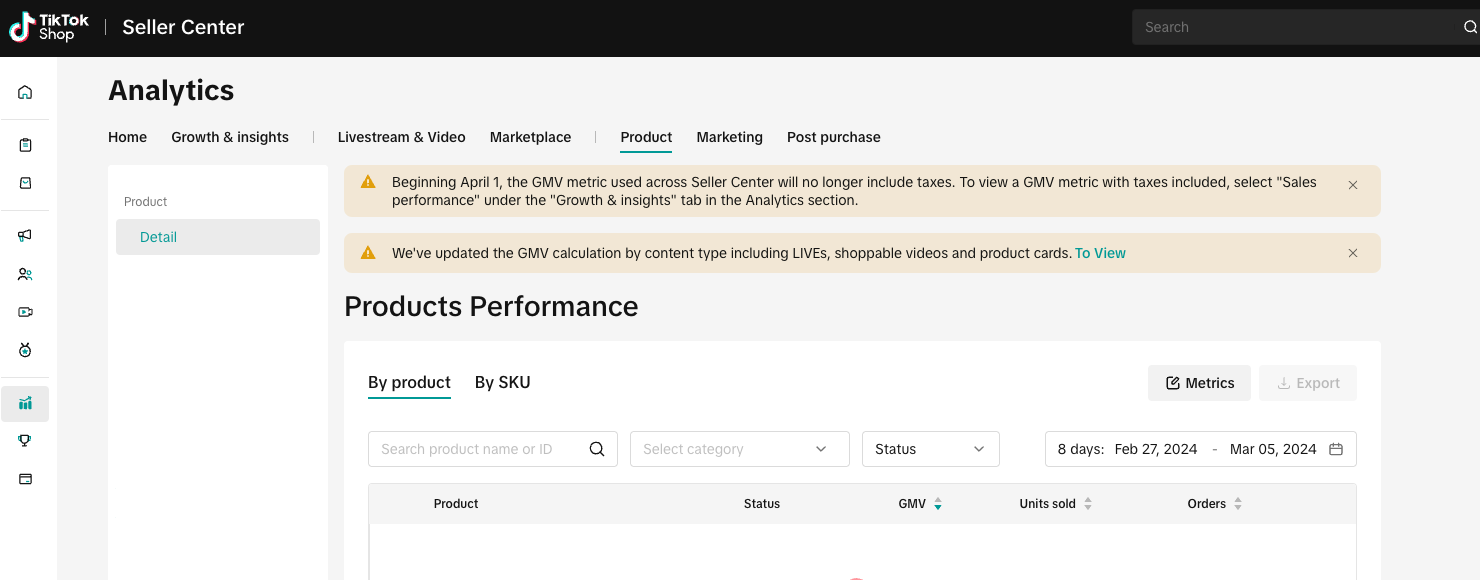
Go to Analytics > Product tab to view your product analytics data.Product performance data and insights within Analytics can help you monitor, analyze and improve the performance of each product in your shop. Gain valuable insights to build more content, improve marketing efficiency, adjust pricing strategy, and grow your shop to succeed in TikTok Shop.
Landing page
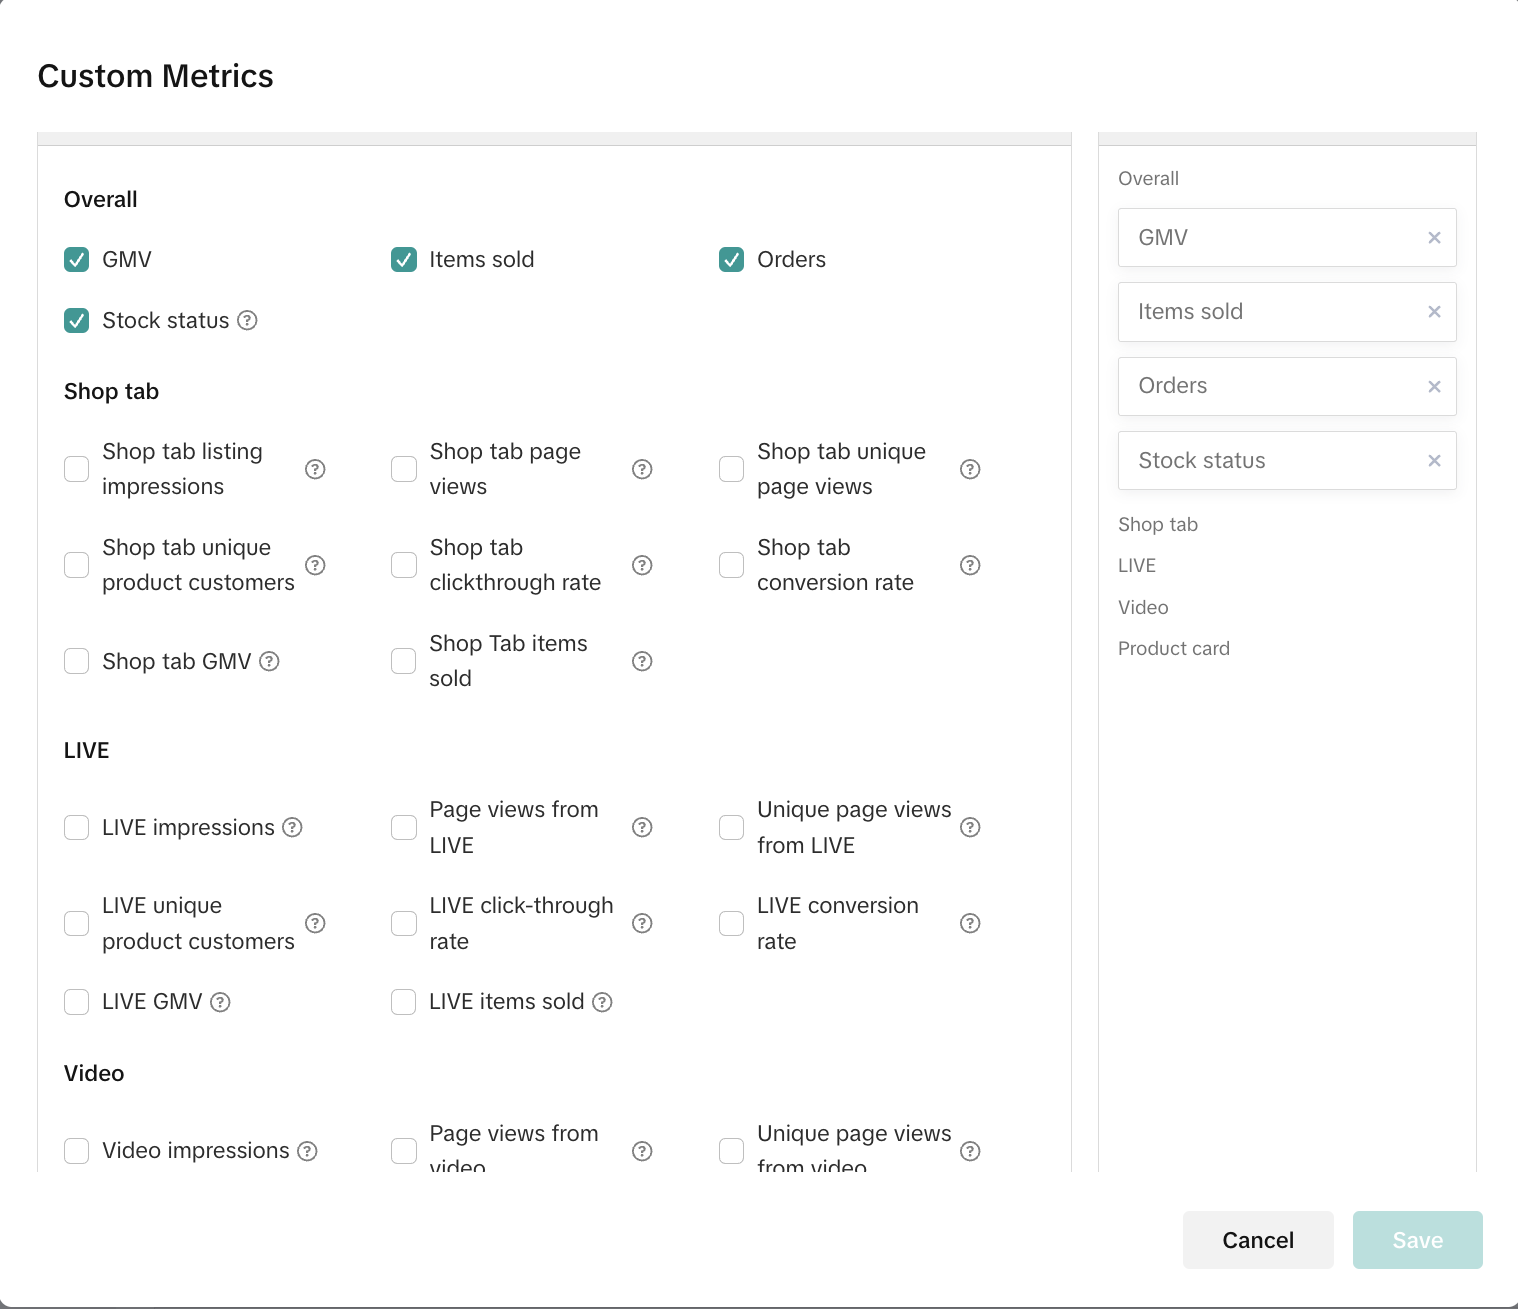
This page shows you the list of all products in your shop, its status, and its performance on key metrics such as GMV, orders, etc. Use the filters and time range to look for a specific product's performance. You can also use the 'Metrics' button to view additional metrics.Module | Function | Screenshot |
Tool bar |
|  |
Product/ SKU List |
| 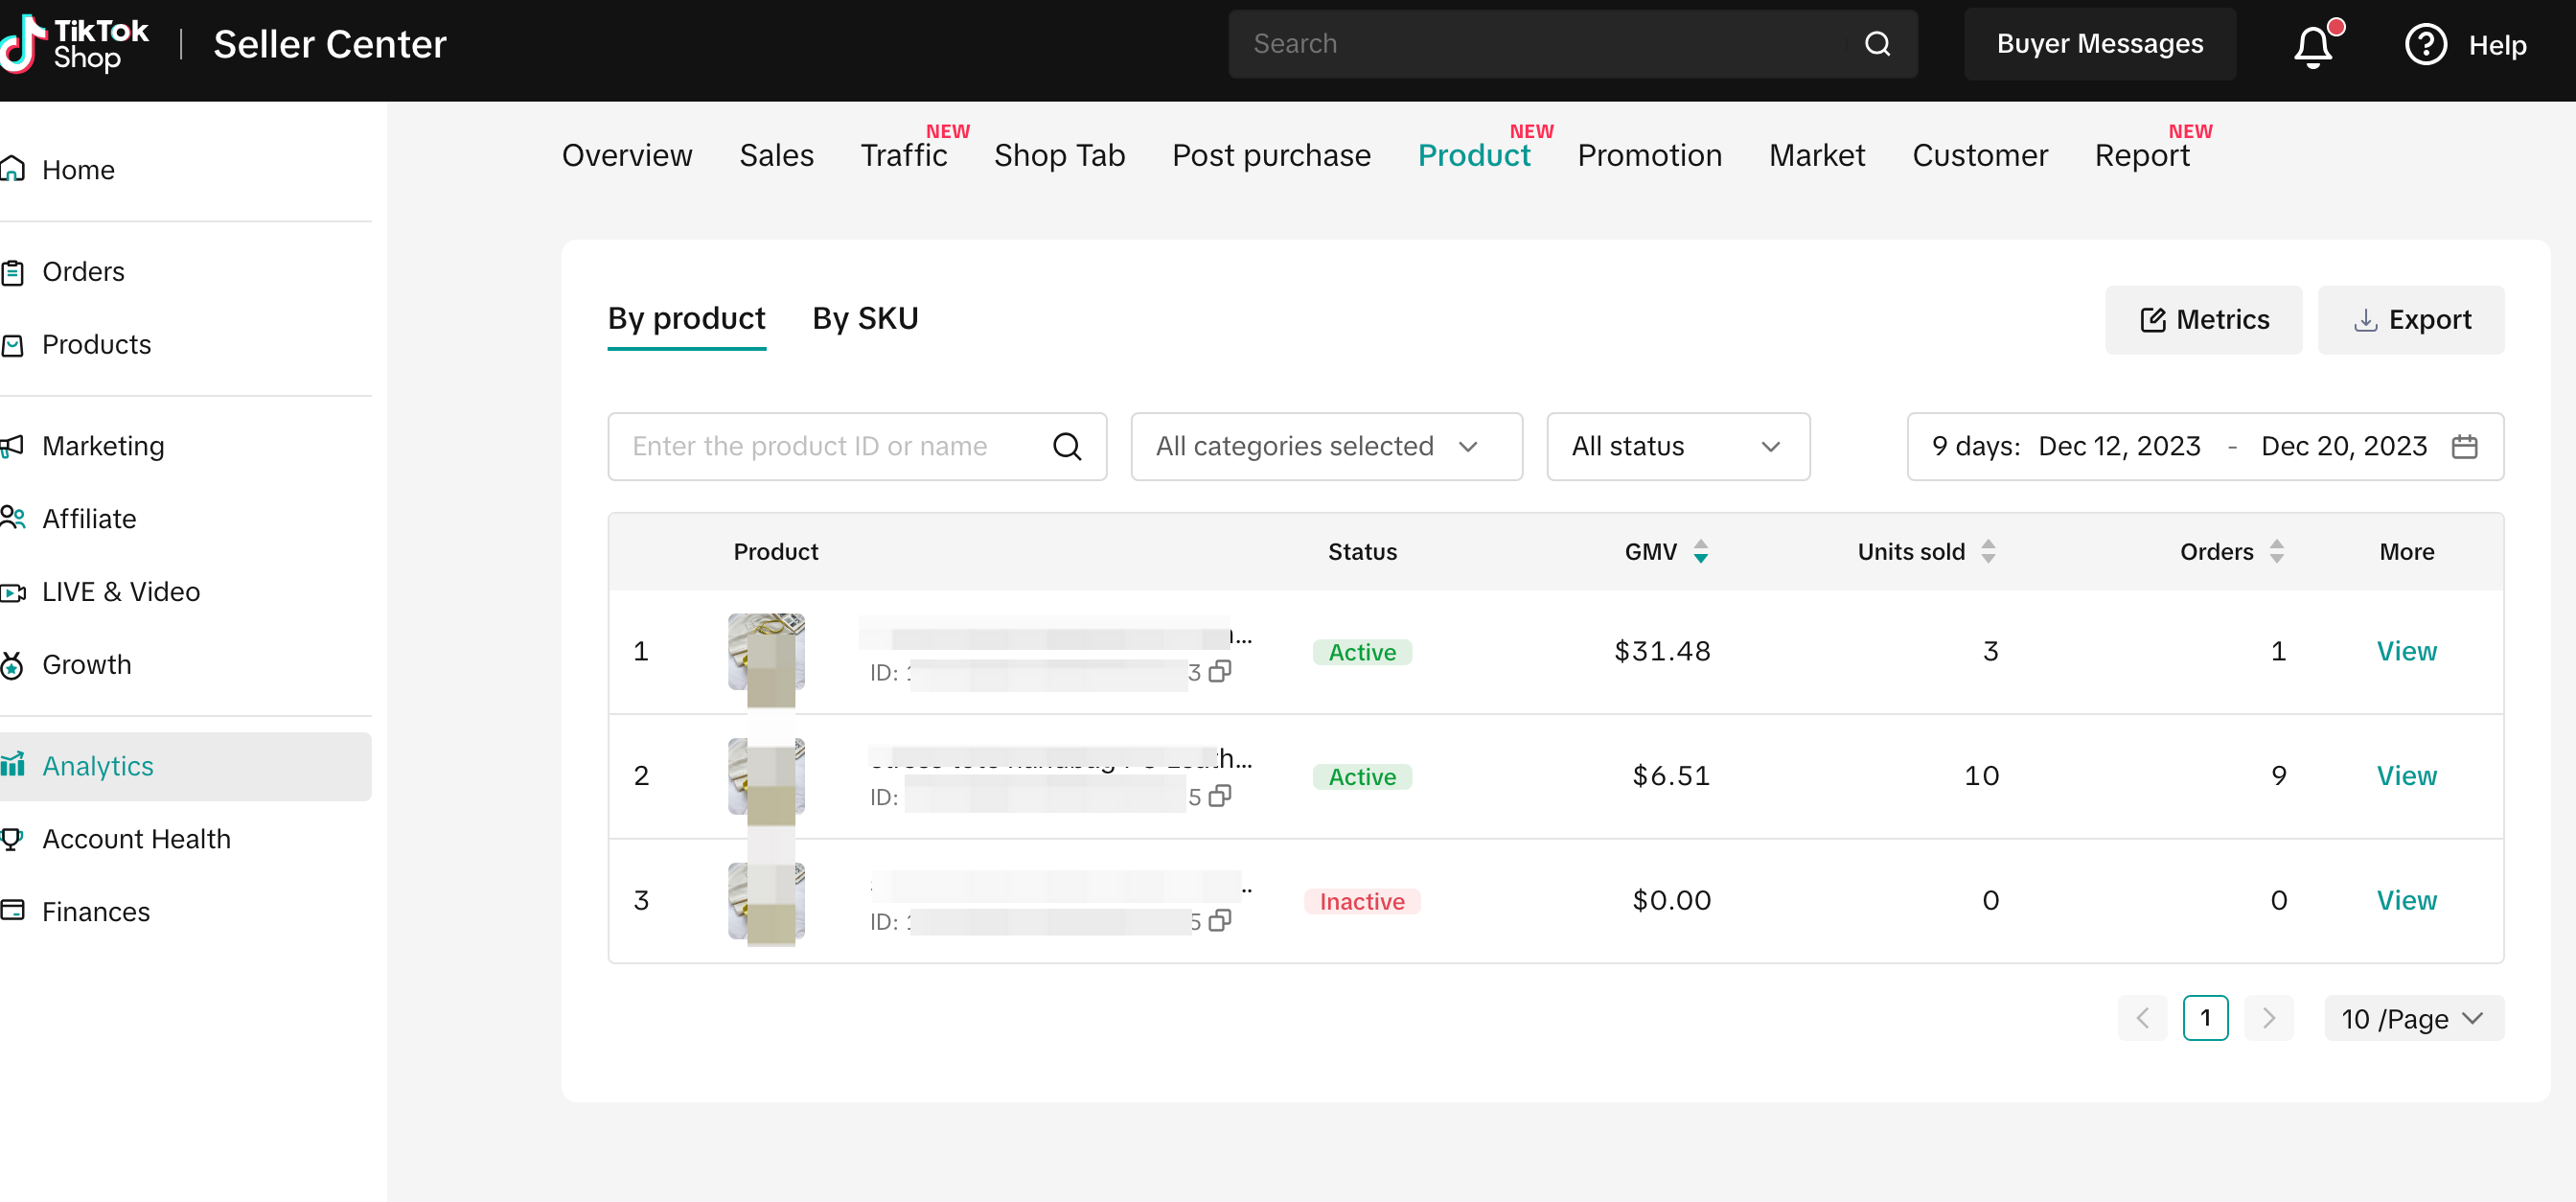 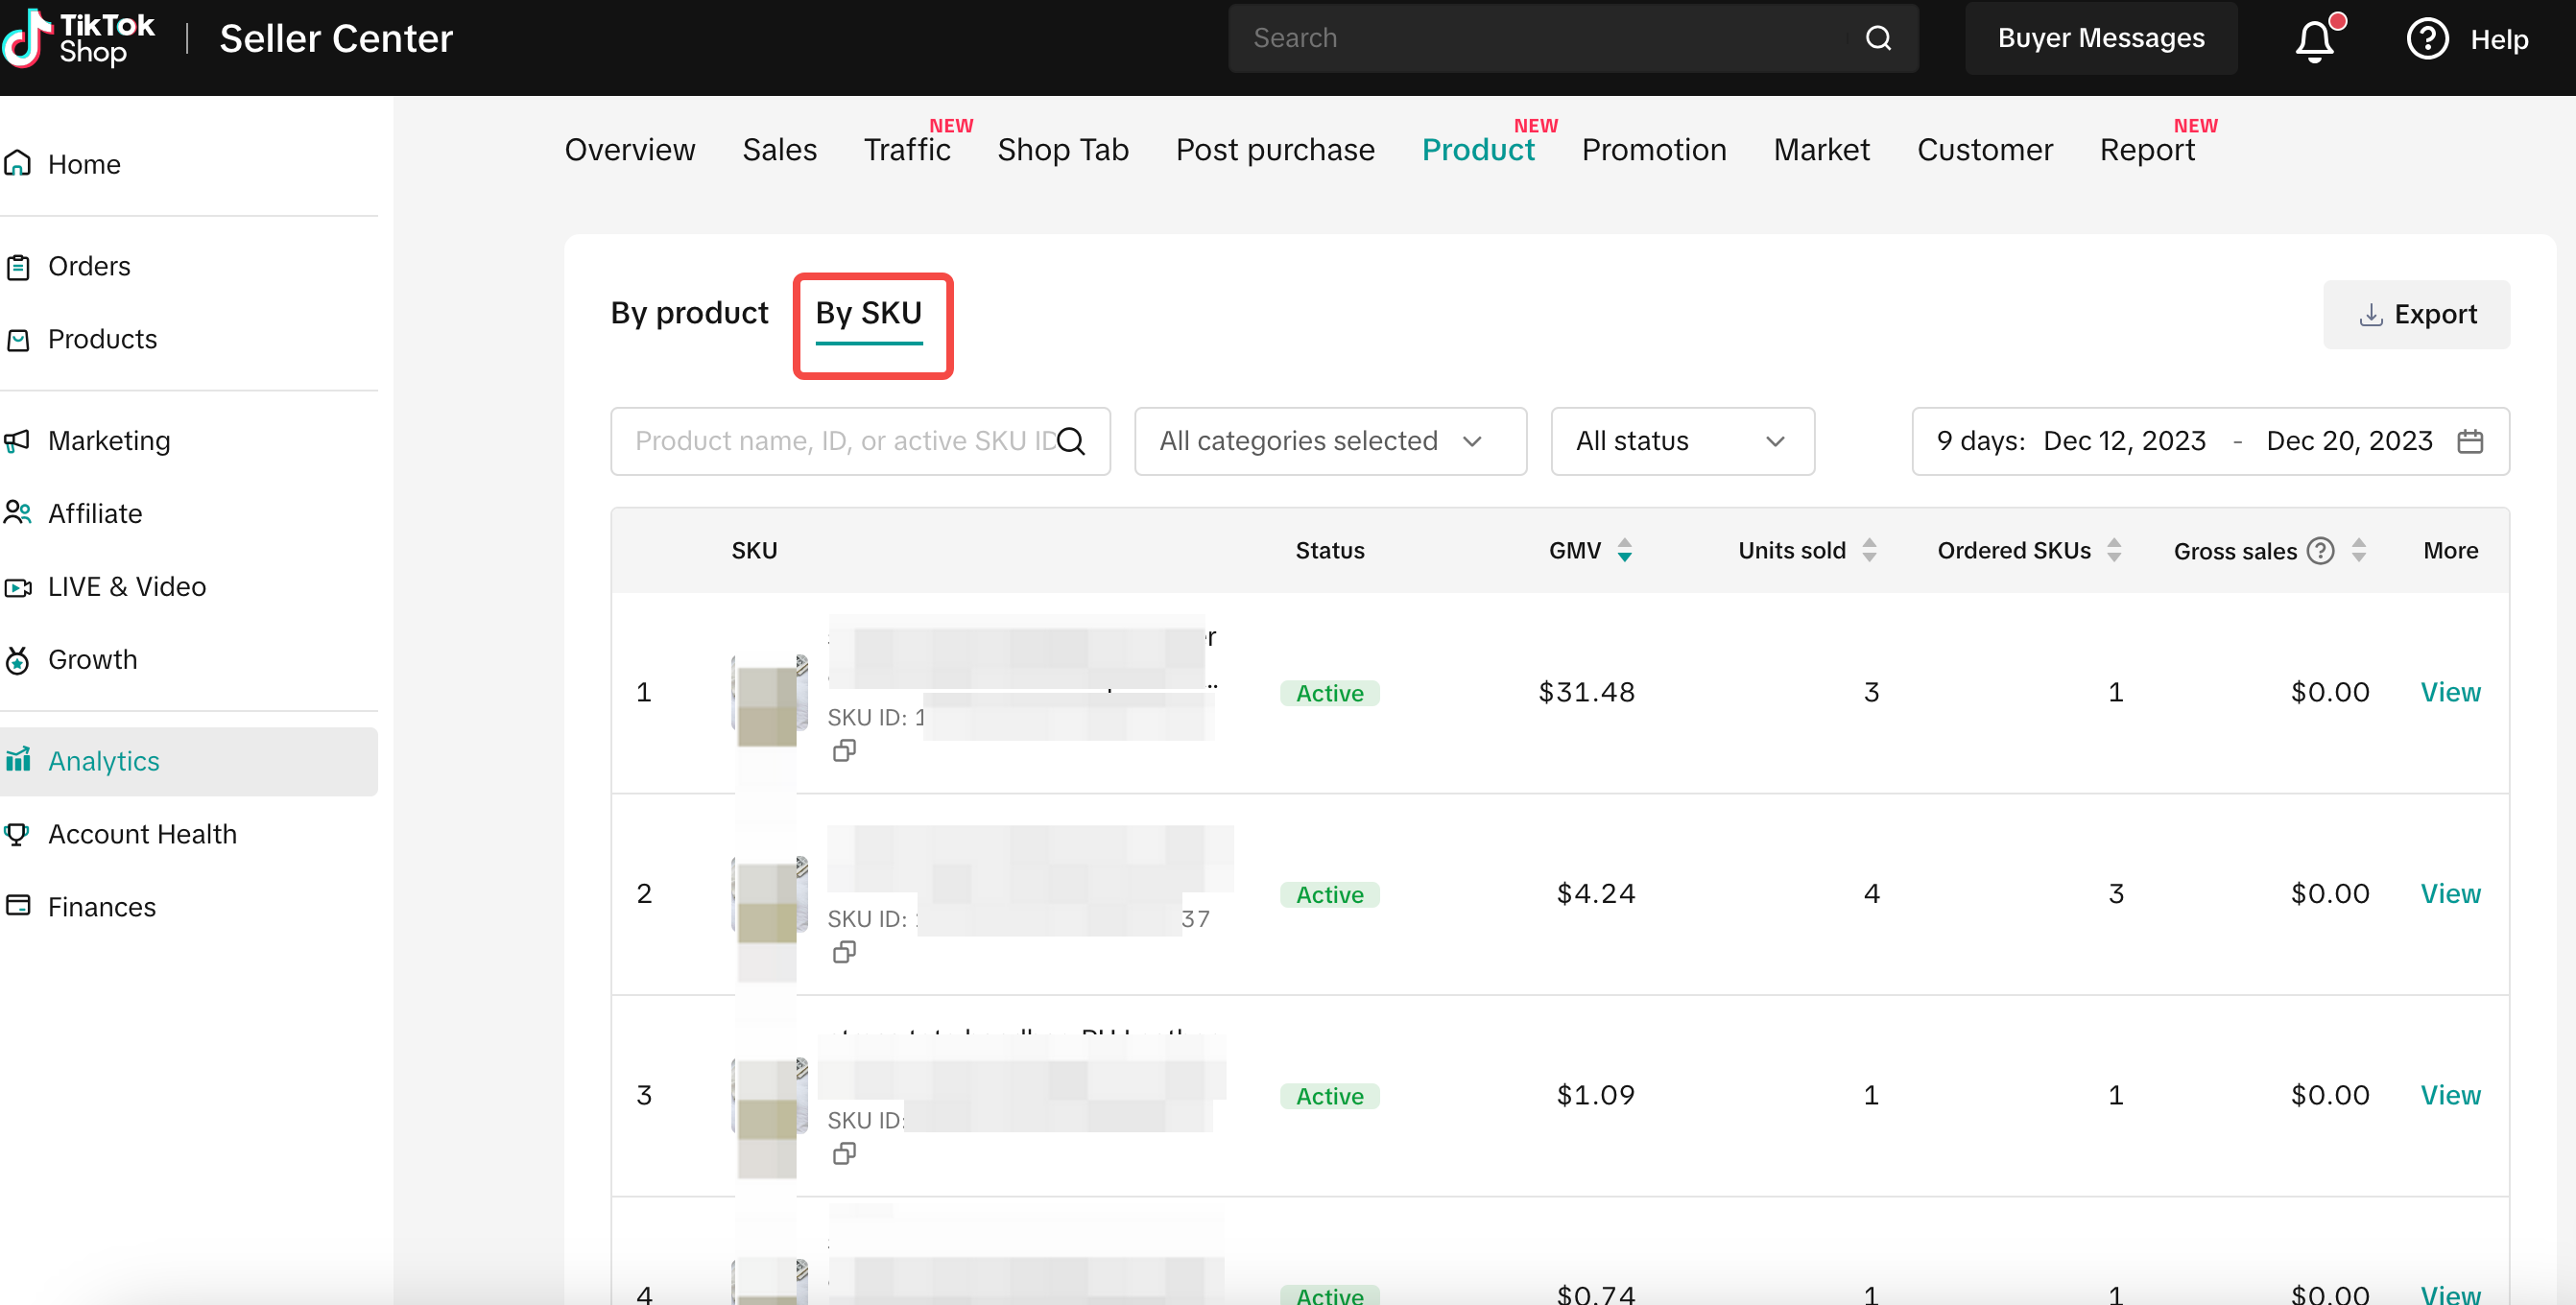  |
Details page
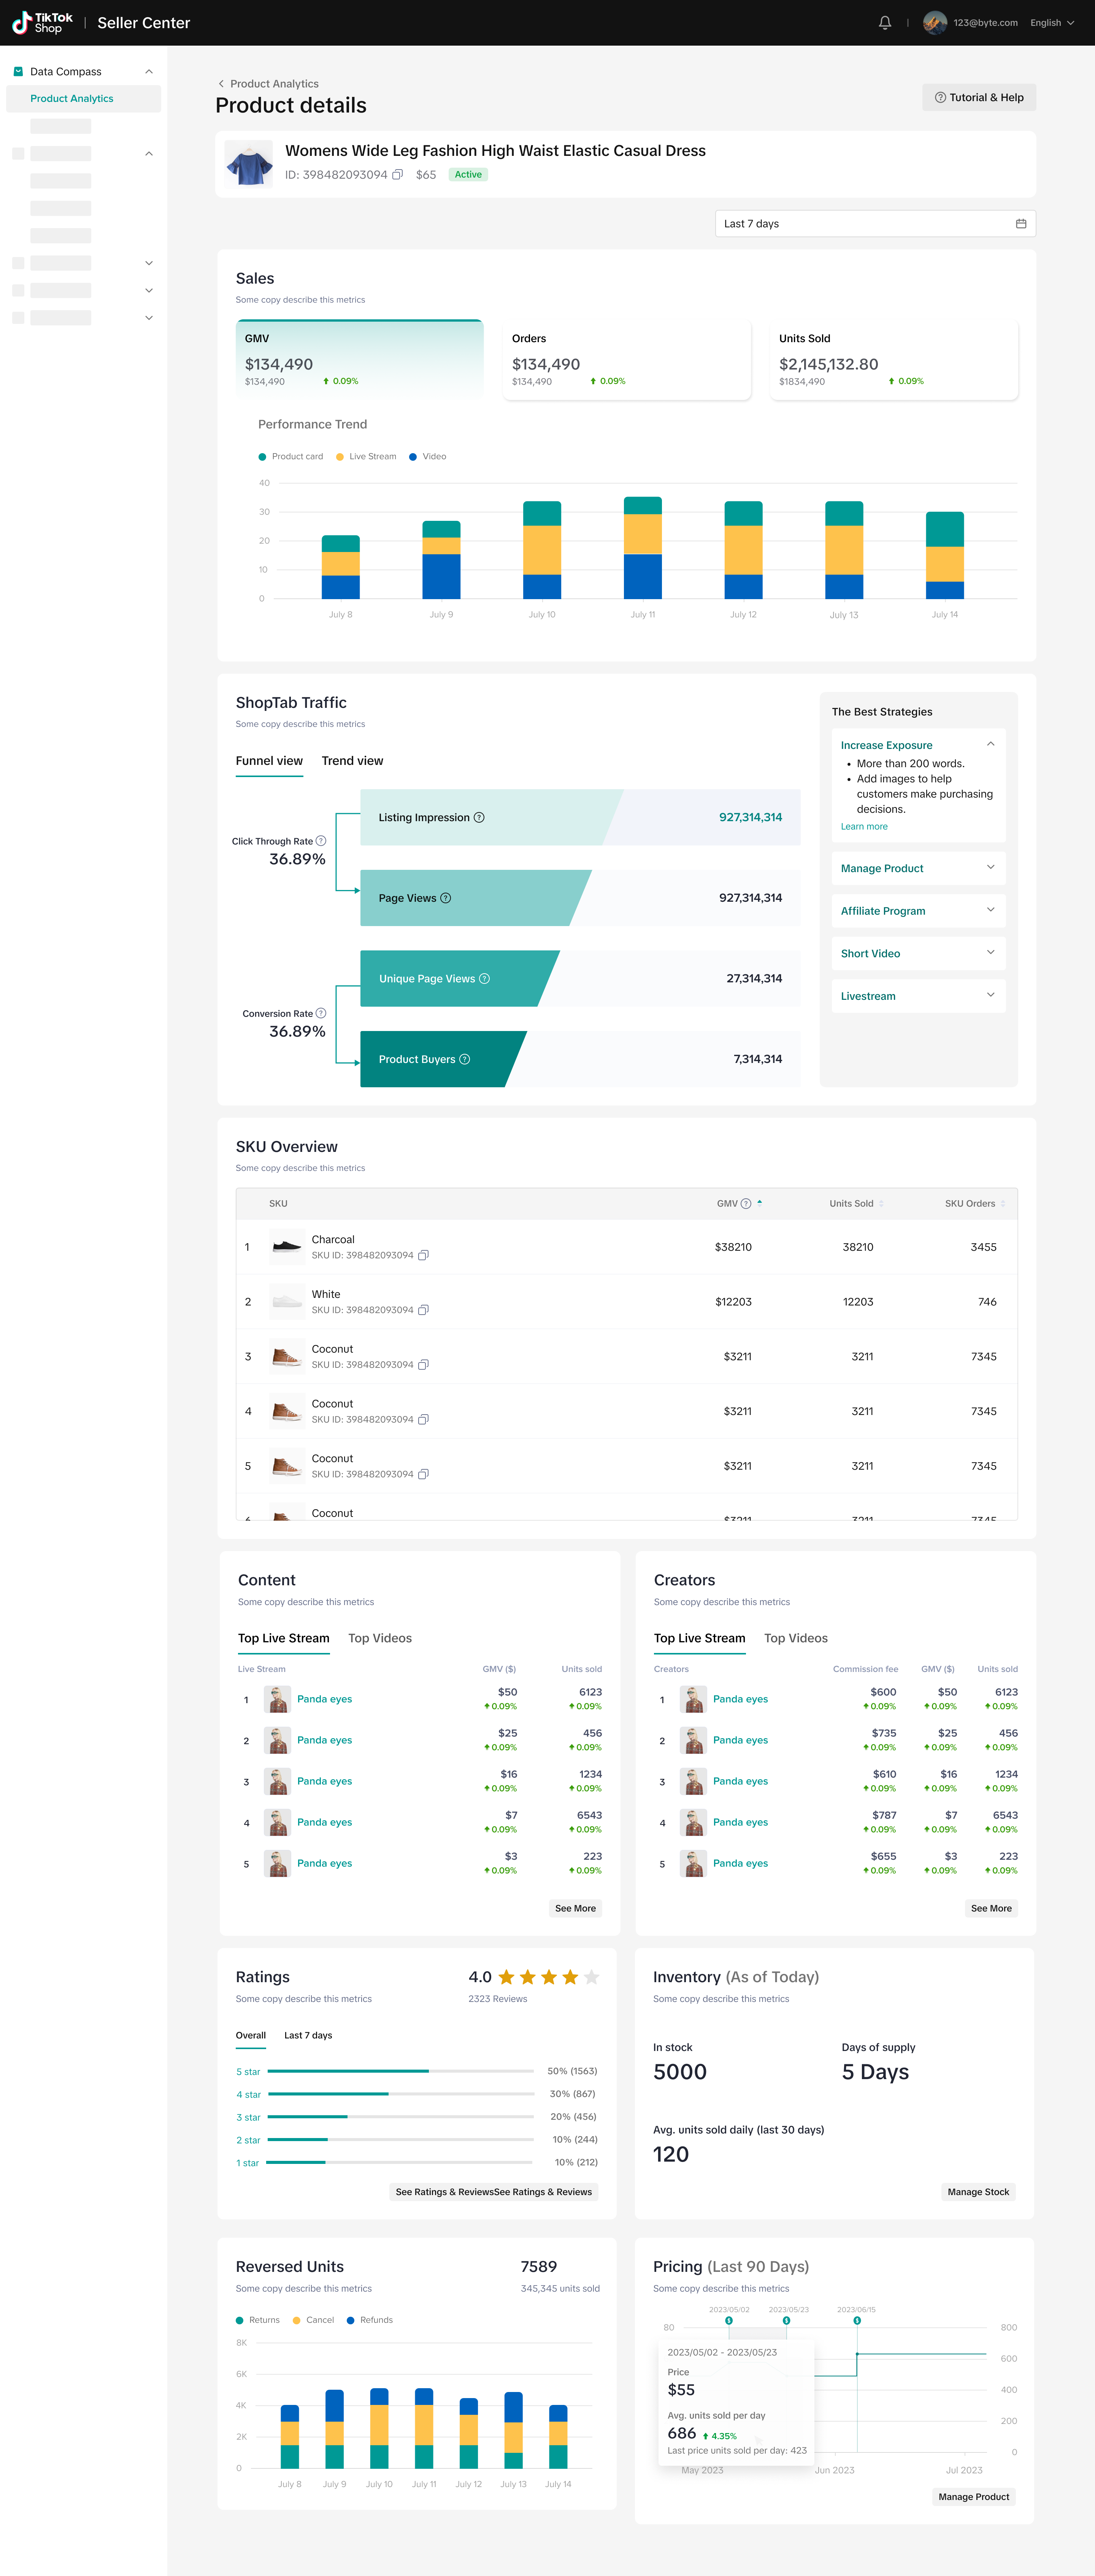
On this page, you can find deeper insights on your key metrics, with more visuals. Explore the charts and data to understand the reasons for a sudden increase or decrease in product transactions, identify issues and improvement strategies in the traffic funnel, learn which livestream/video/creator achieves the most product transactions, choose the most suitable promotion method for a product, deeply analyze your traffic sources (LIVE, Video, Product Card) and improve your shop transactions.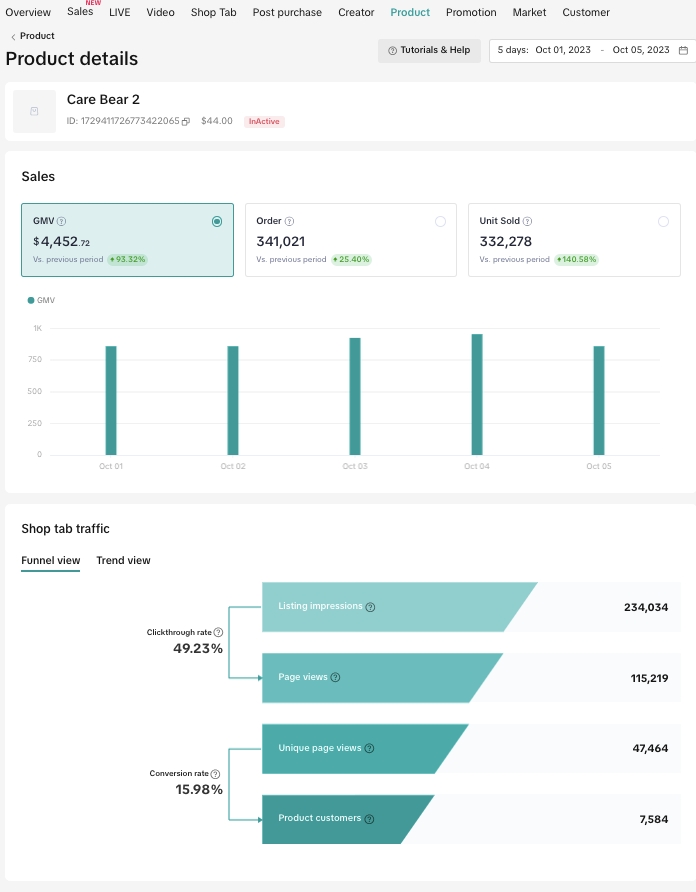
Module | Function | Screenshot |
Filter | Select any day or any time range within the past 90 days. | 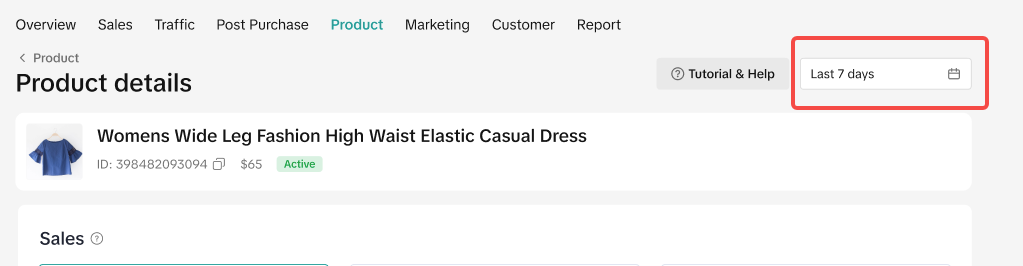 |
Product Info | Displays product name, ID, price and product status. | 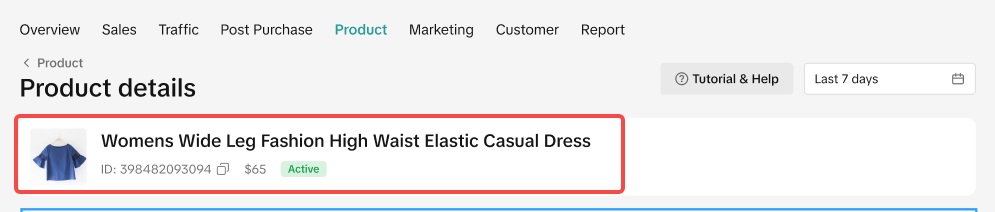 |
Sales | There are 3 core metrics: GMV, Orders and Units Sold.Click on each metric card to show the trendlines based on a comparison with performance from the previous period of time. | 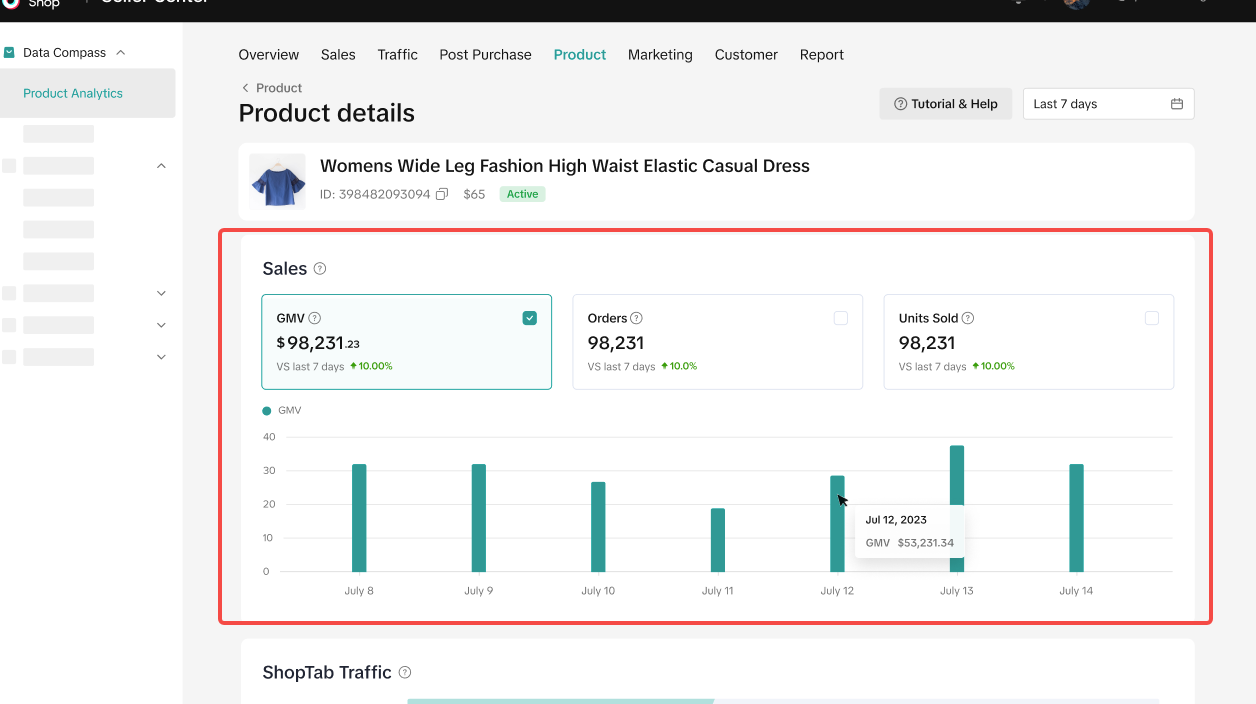 |
Product traffic |
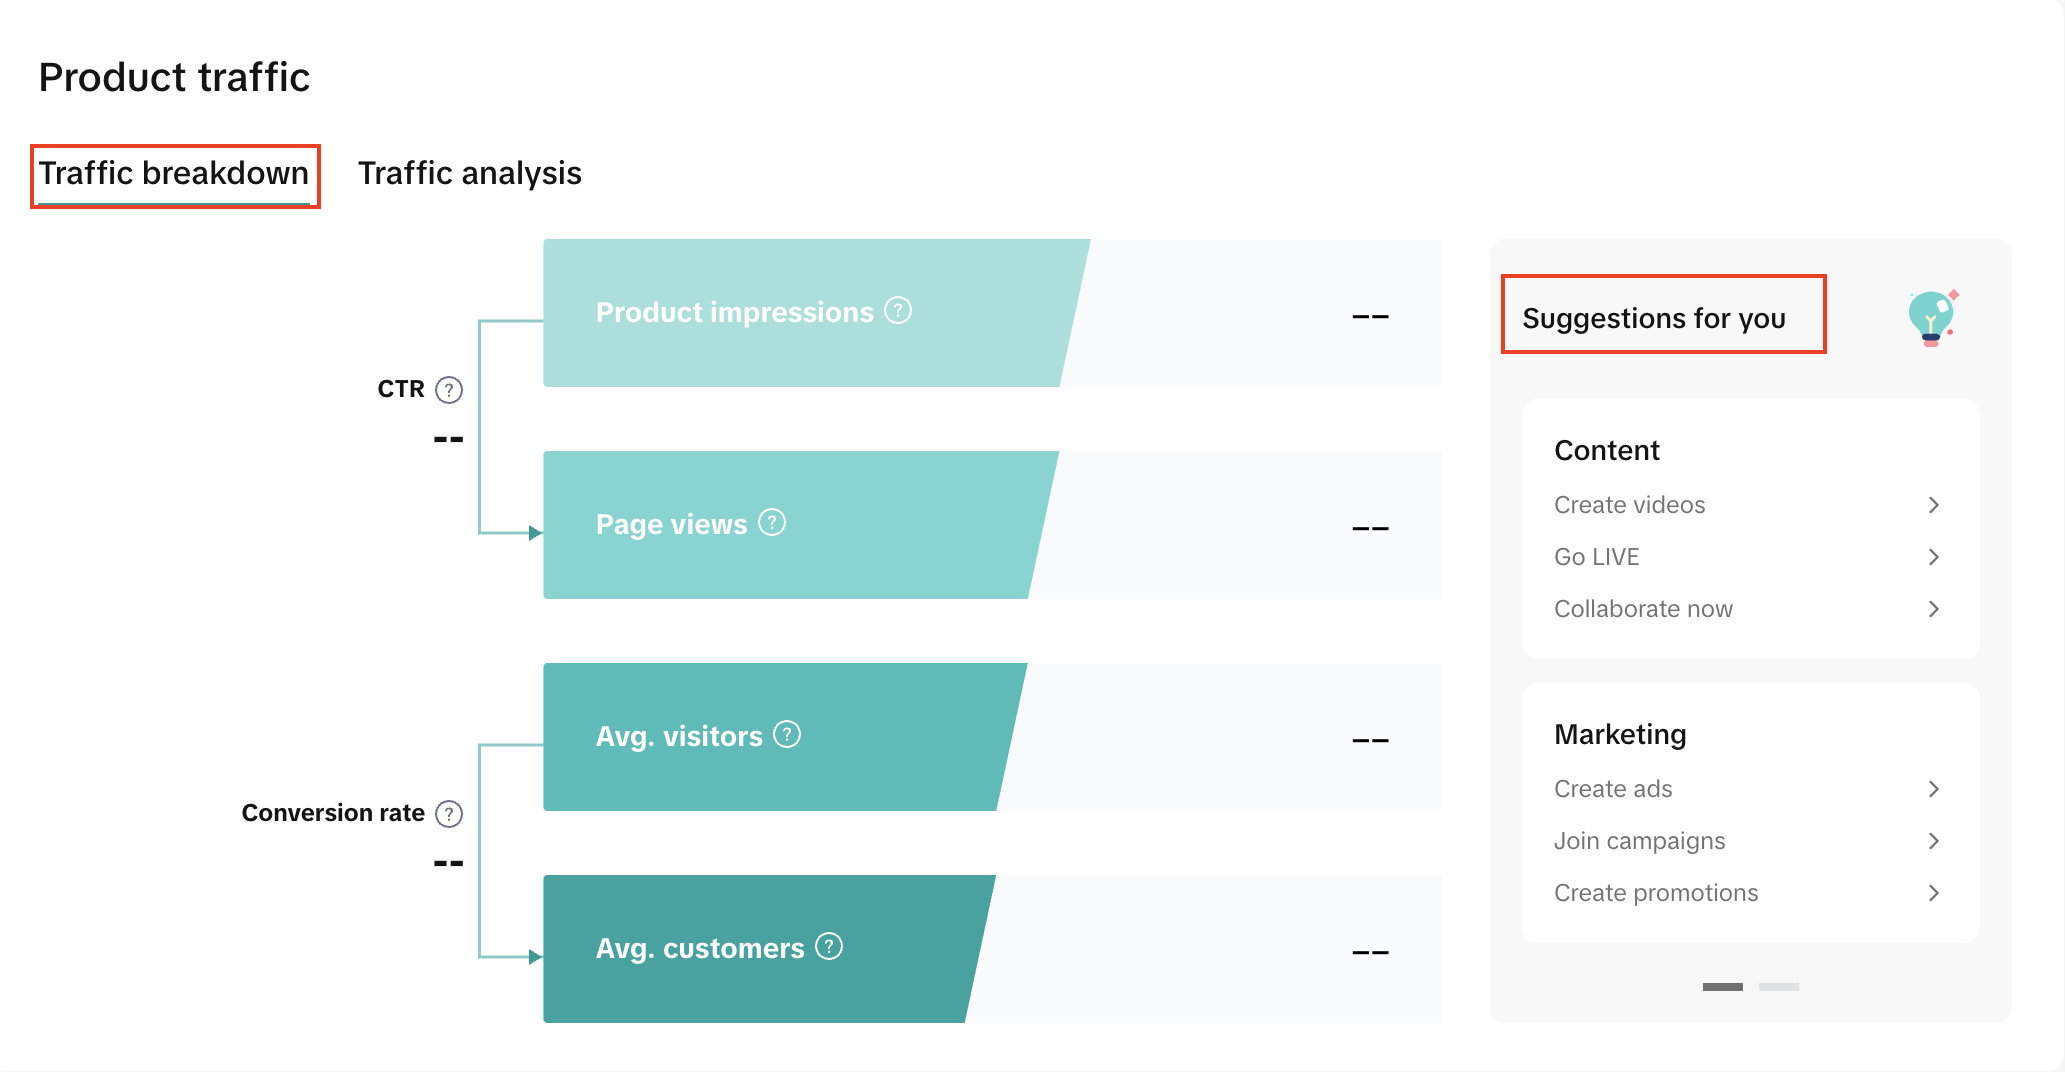
The Suggestions for you module includes helpful links and suggestions to boost your traffic and improve sales.
|   |
SKU overview | A list of SKUs available for the product. For each SKU, you can view the GMV, units sold, SKU orders data. Sort the list by any of the 3 metrics to discover your best selling SKUs. |  |
Content ranking | Toggle between the two ranking list tabs in the Content block to see the top 5 transaction livestreams and videos.Click See All to open a pop-up window to see the full ranking list, including GMV and Units Sold metrics. | 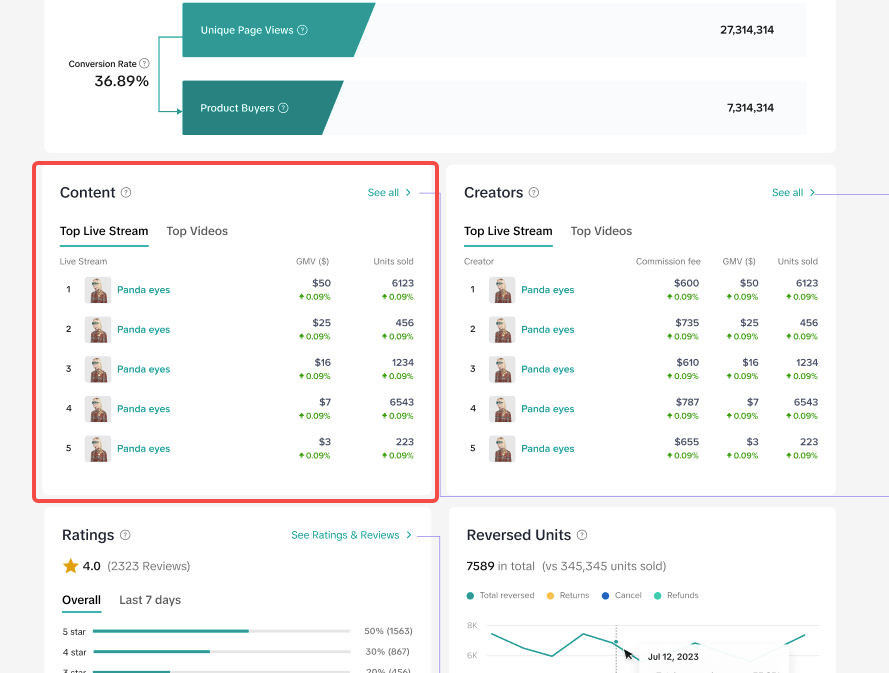 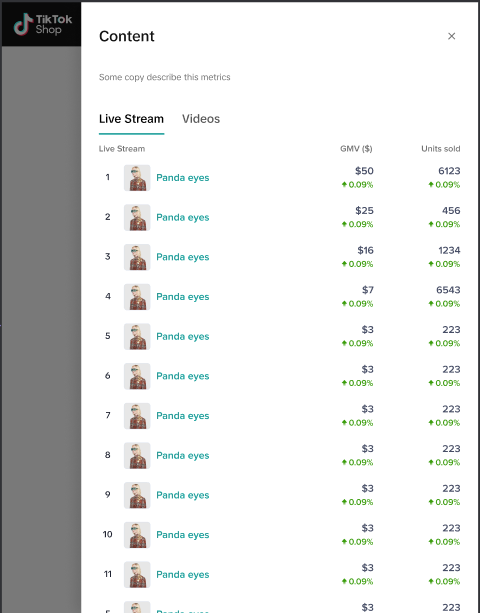 |
Creator ranking | Toggle between the two ranking list tabs in the Creator block to see the top 5 transaction creators in the livestream and video sources separately.Click See All to open a pop-up window to see the full ranking list, with Commission Fee, GMV and Units Sold metrics. | 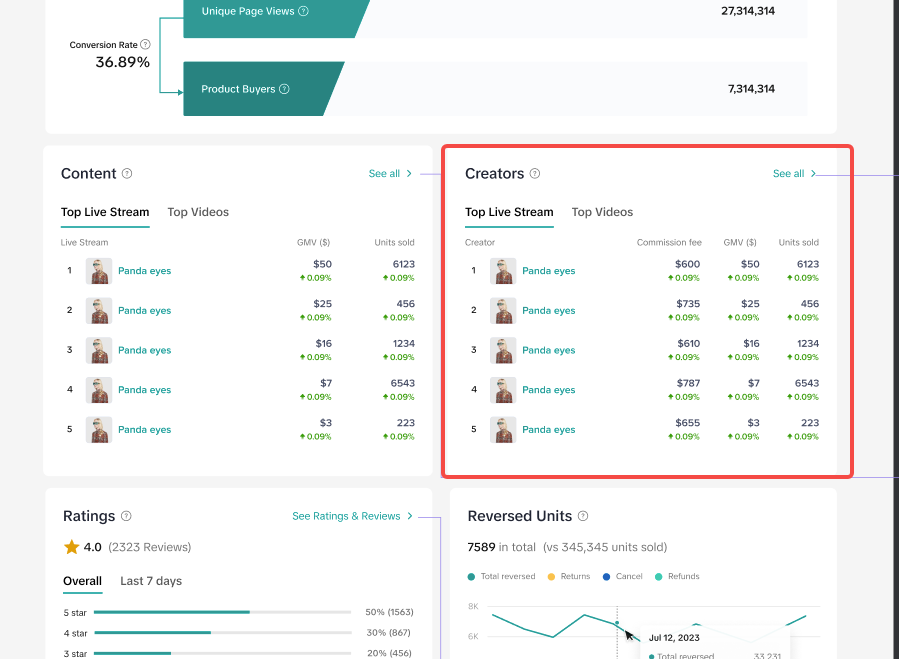 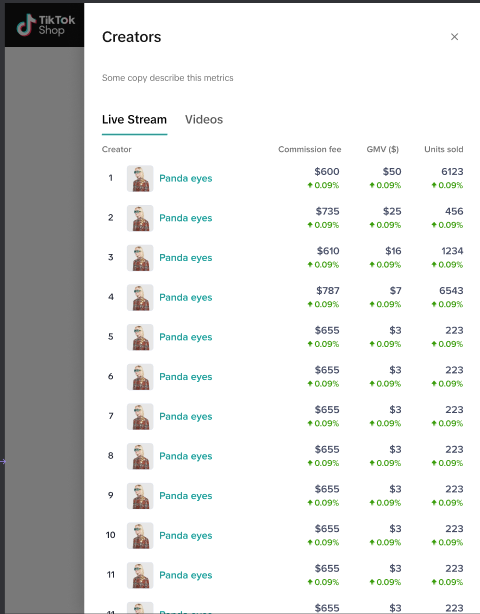 |
Rating & Reviews | In the Ratings block, you can see the overall rating of the product on the day you are viewing it, the total number of reviews and contributions.Use the time selection tool to see the number of new reviews and ratings received during a dynamic time period of choice.Click on See Ratings & Reviews to open the Product Ratings page. | 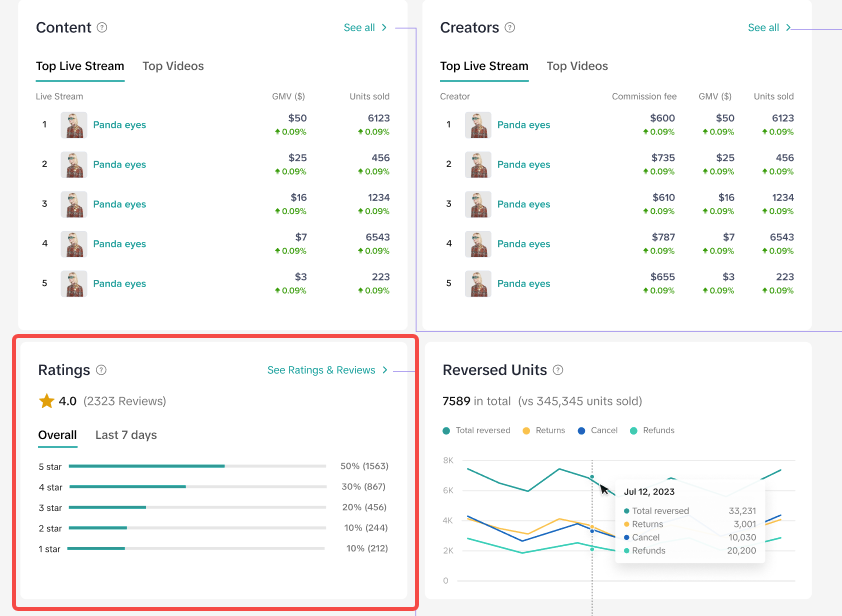 |
Reversed Units | In the Reversed Units block, trend lines show the units canceled, returned or refunded. You can also view the combined number of units canceled, returned and refunded during the selected time period. | 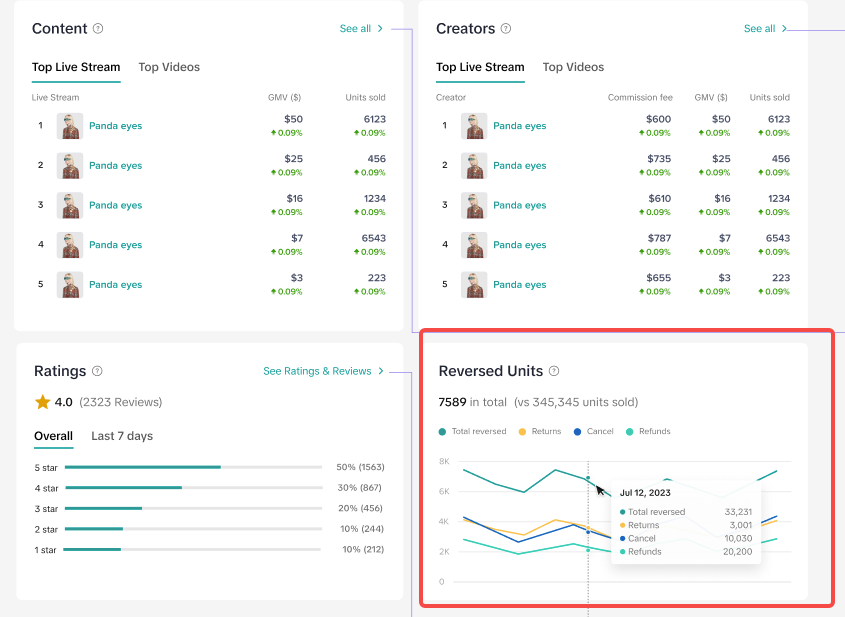 |
Inventory | In the inventory block, you can see the current units available for sale and the estimated number of days before all inventory is sold based on the average units sold per day for the past 30 days.Click on Manage Stock to go directly to the stock management page. | 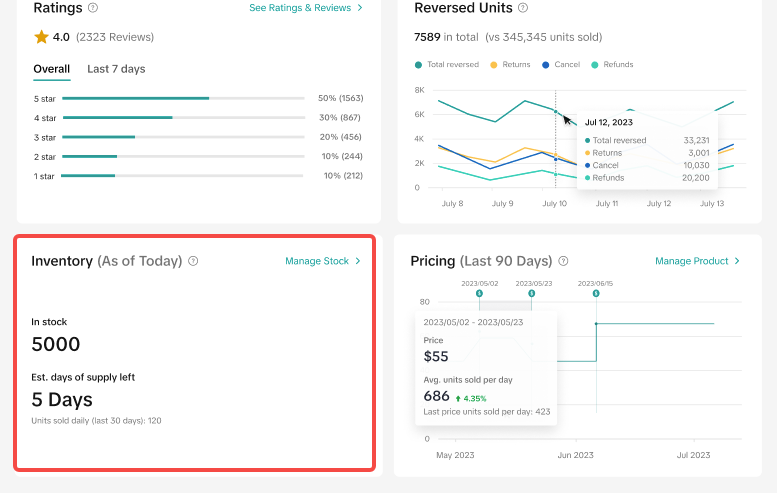 |
Pricing | In the Pricing block, you can view the price trend over the last 90 days. Hover over the chart to see the exact product price versus the average units sold per day during each period of time in which the product price has remained the same. This can help you track your pricing strategy and its corresponding impact on sales. | 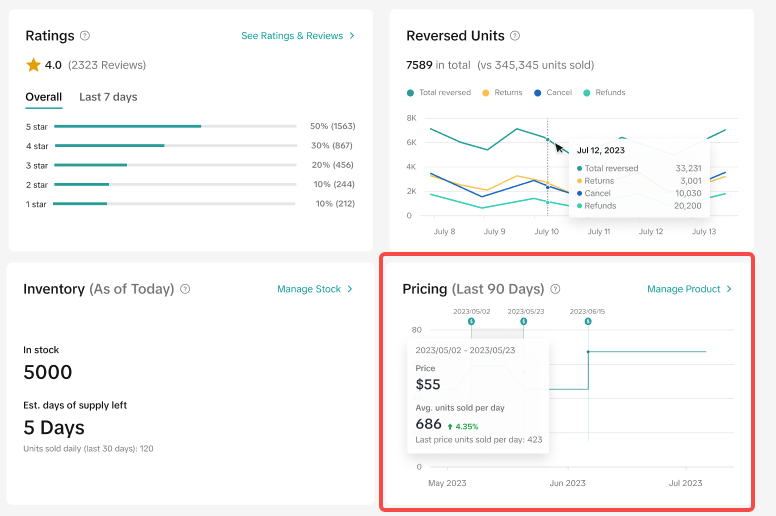 |
Product traffic page
This page provides you with comprehensive analysis of your product's traffic data with useful metrics and actionable suggestions enabling you to take action and optimize your product's traffic & drive more sales.Module | Function | Screenshot |
How to boost your traffic | Learn and explore how to boost your product traffic via content, marketing and product growth opportunities. Click on the 'Get Started' links to access tasks and programs available to you based on current performance. | 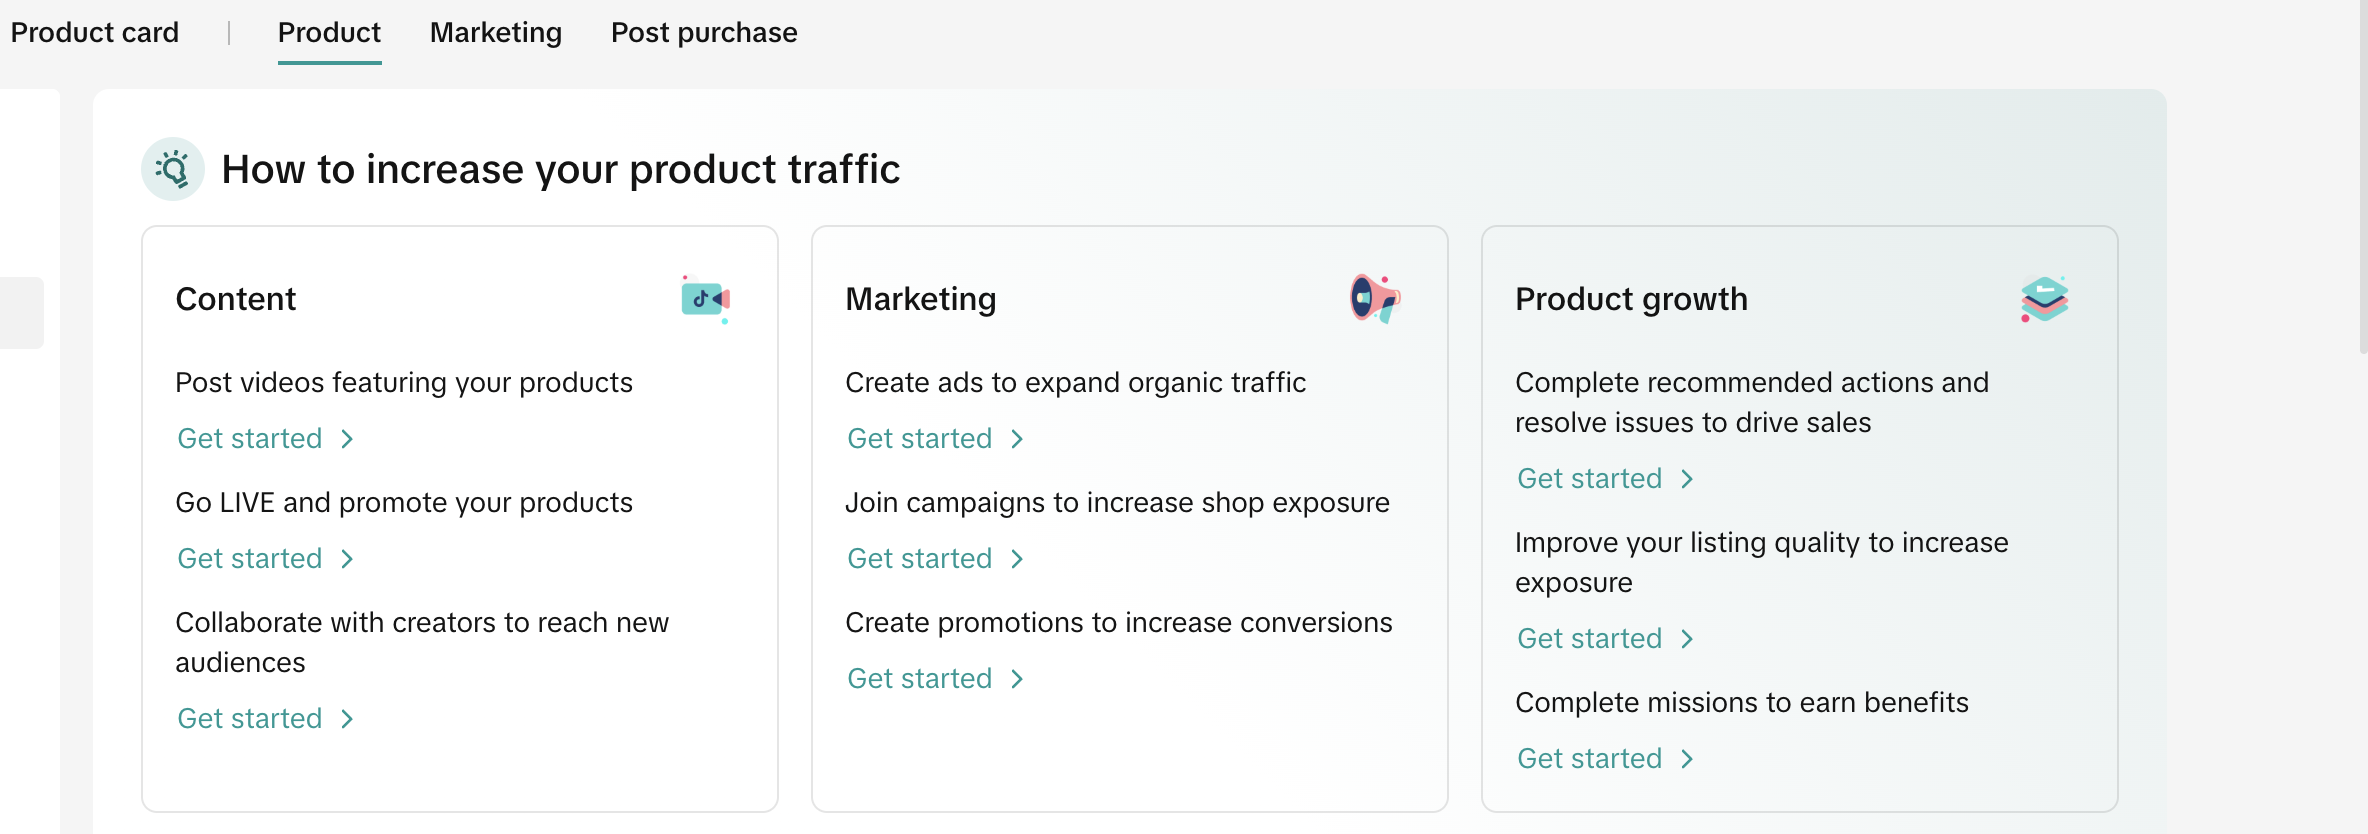 |
Key metrics | This chart shows you the key metrics performance - page views, product impressions, avg. visitors and GMV in a certain time period. Click on one or two metrics at a time to view the trends as per your needs. Page views: The total number of views for your product detail page when viewers clicked product links. Product impressions: The total number of times a product appeared in LIVE videos, videos, and product cards. Avg. Visitors: Average number of visitors per day. GMV: The total amount paid for orders, including returns and refunds. You can add custom metrics to the chart.You can also export this chart and its data to analyze outside of this page by clicking on the last icons highlighted in red.Use the date picker tool on the top right corner of the page to select a time range to view your traffic data. | 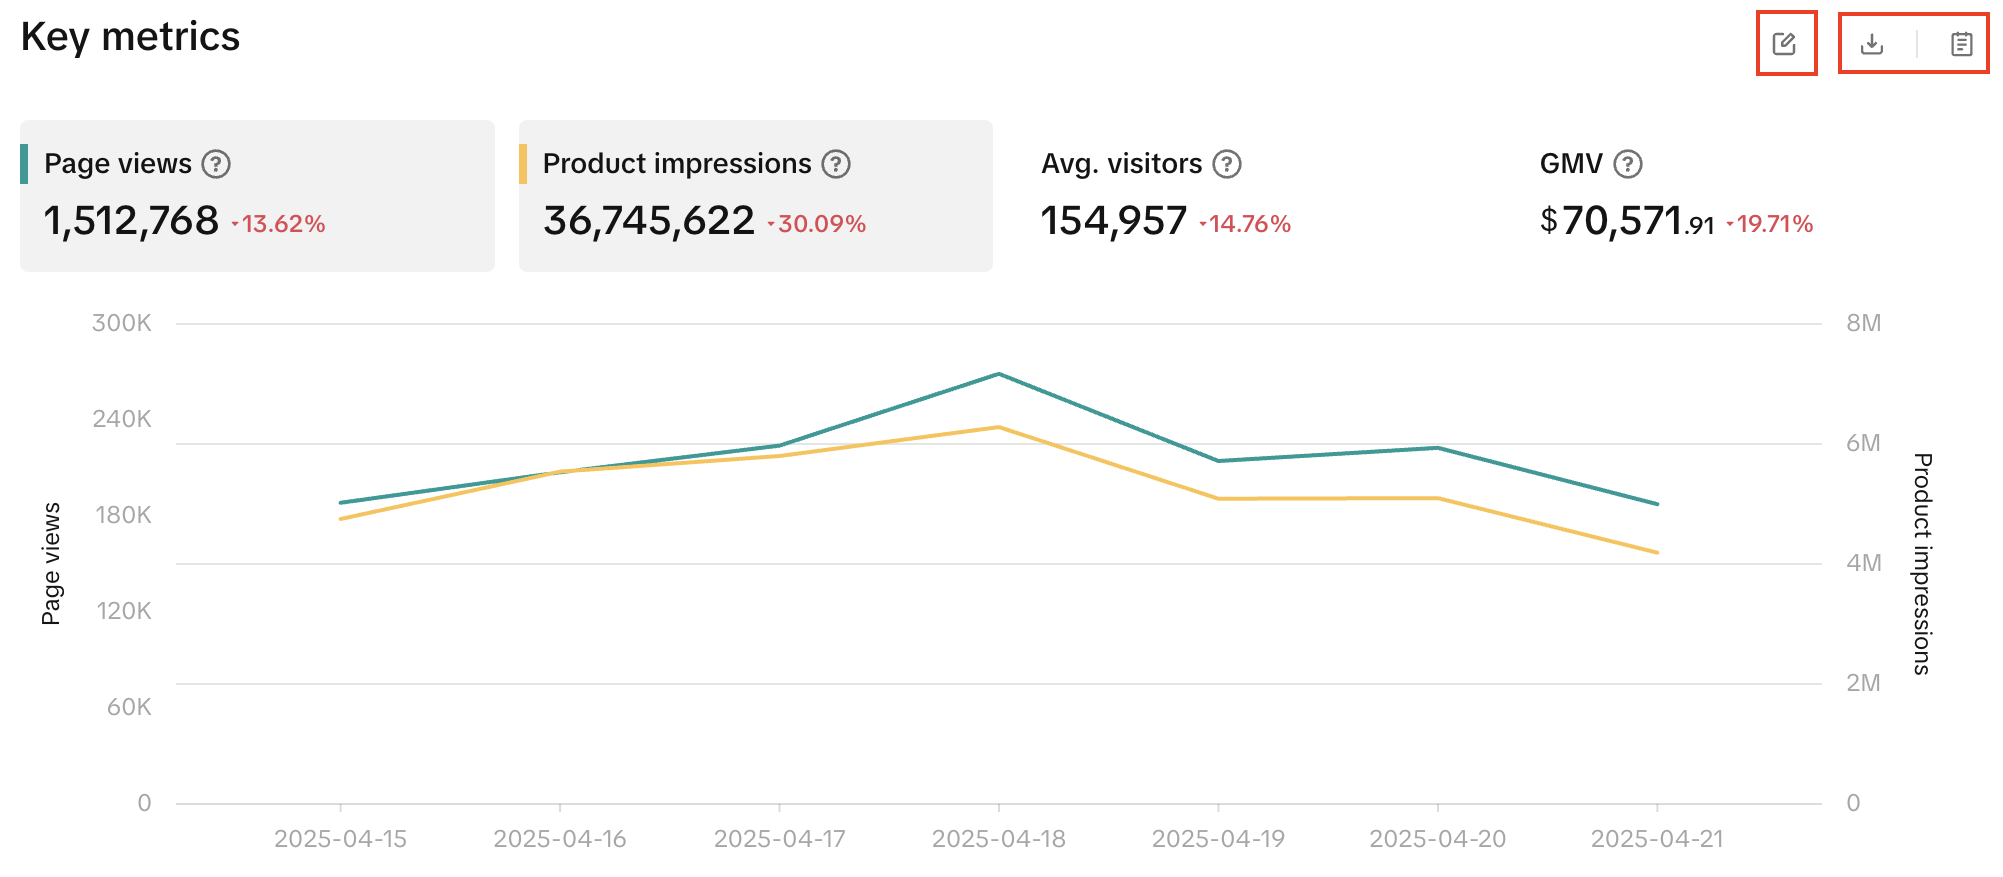  |
Traffic breakdown | Same as mentioned in the details page: a funnel view including attributes such as listing impressions, page views, unique page views and customers to calculate two metrics: click-through rate and conversion rate, which helps you determine potential sales issues, if it is related to content or products. Click-through rate: The percentage of viewers who clicked on product links after seeing them. Number of clicks divided by the number of views, multiplied by 100.Conversion rate: The percentage of individual viewers who placed an order after seeing the product. The number of orders placed after seeing the product divided by the number of unique viewers, multiplied by 100.The Suggestions for you module includes helpful links and suggestions to boost your traffic and improve sales. | 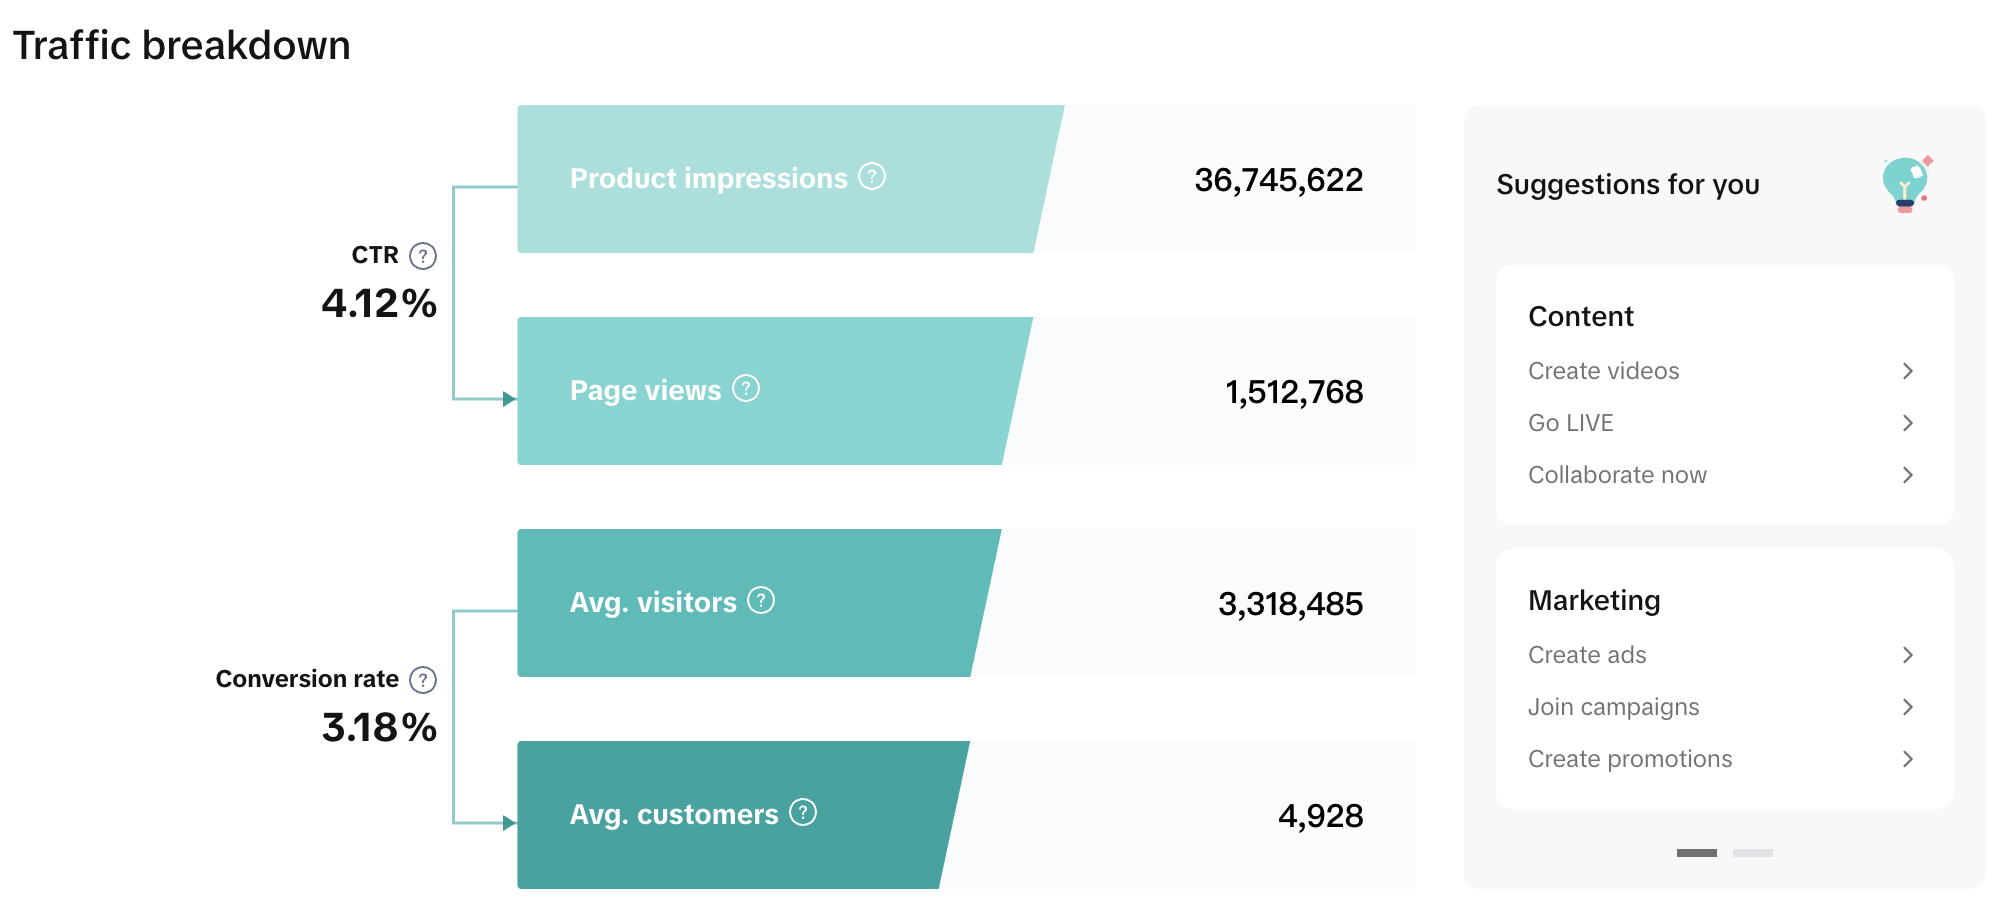 |
Traffic analysis | Same as mentioned in the details page: Further analyze your traffic sources across the Content & Shop tab to understand which source contributes the most to your product traffic and adjust your sales strategy accordingly. This data is available for all key metrics - product impressions, page views avg. Customers, and GMV.Use the chart icon to view a detailed chart on performance within a time range. | 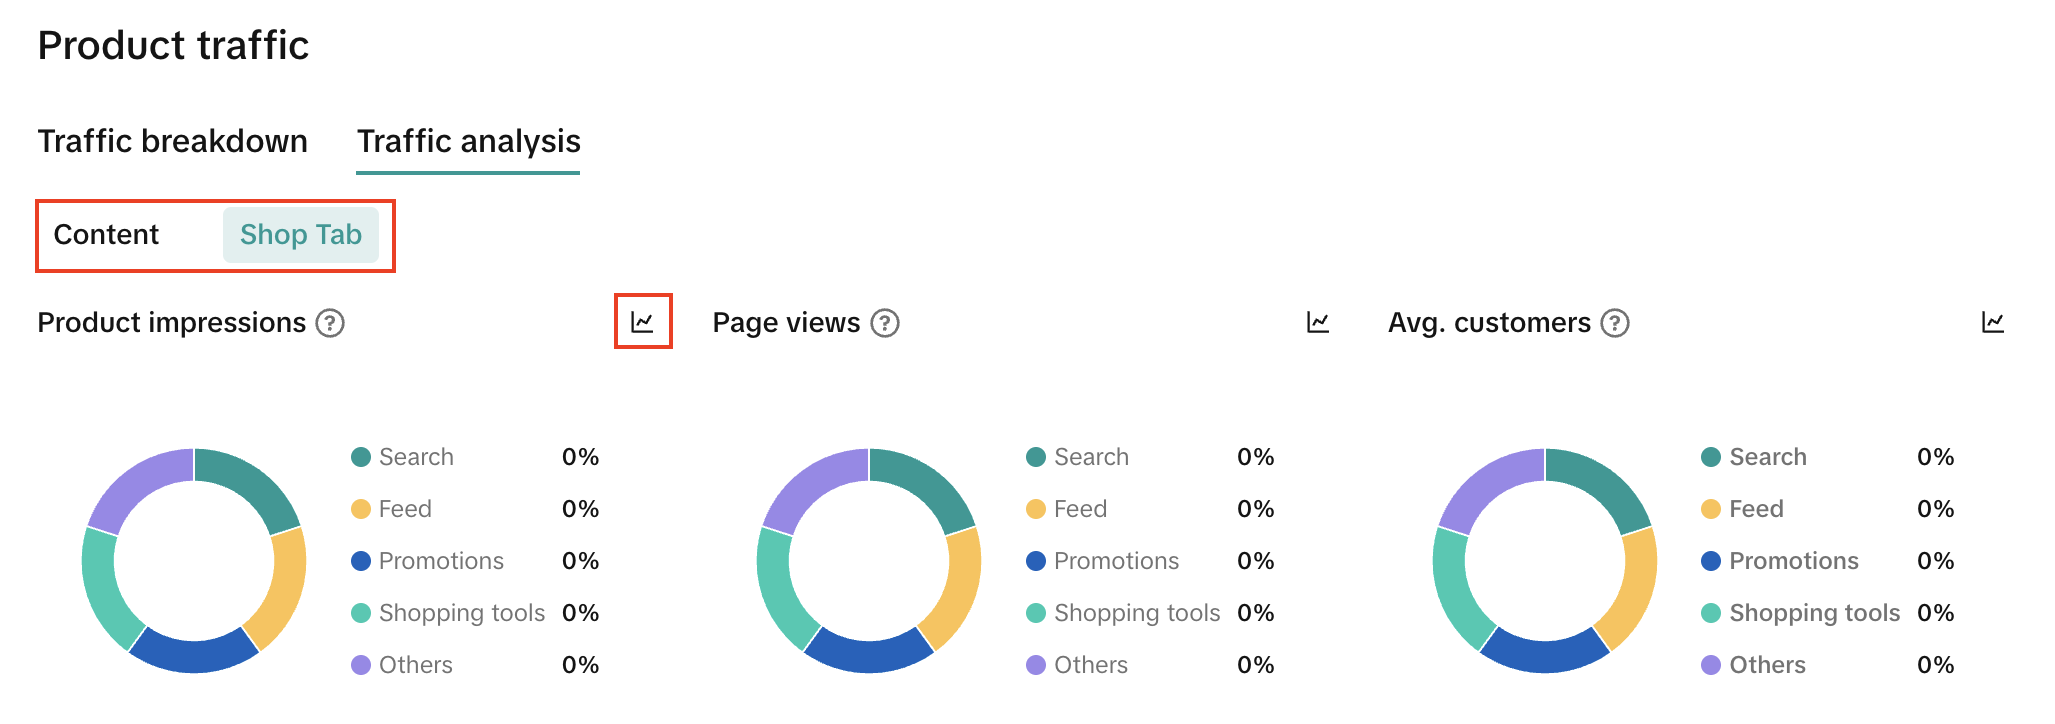 |
Performance details | This table provides you with the key metric performance (based on selection of Content/Shop tab in the above section). The red and green numbers show your traffic performance compared to the same date range picked on top of the page. You can also export this table to view and analyze the data outside of this page. | 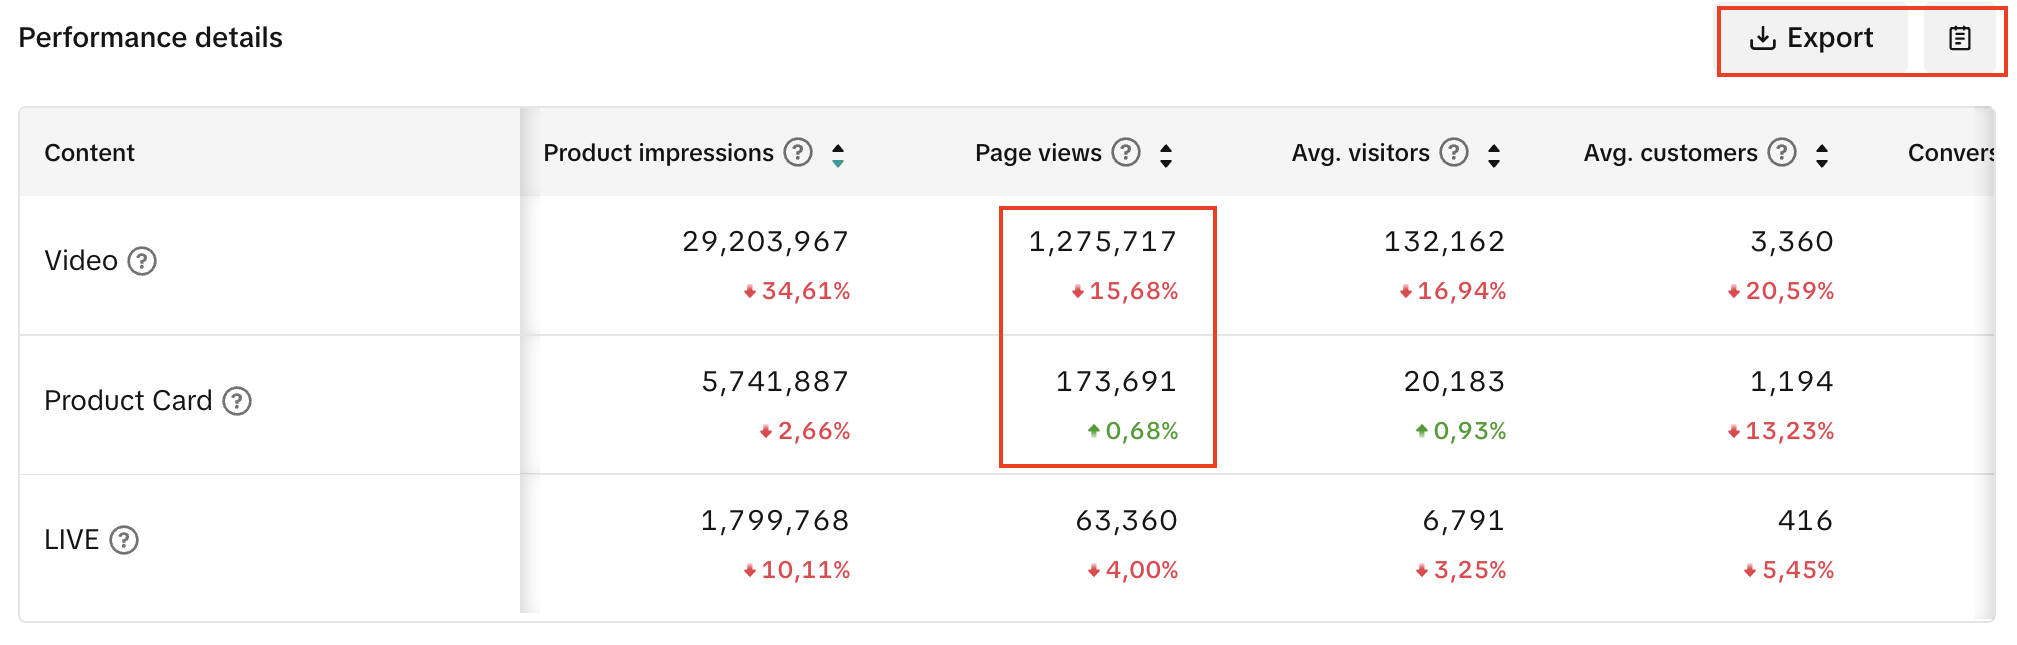 |