

How to Read Creator Center Data Overview
09/10/2025
Summary
What are the key features of the revamped TikTok Shop performance data overview page introduced in January 2024?
- It provides real-time monitoring of today's transactions, supports viewing sales and GMV for selected periods, and allows comparison with previous periods to assess performance trends.
- Users can view historical performance by genre, including separate data for live streams, videos, and product cards, with detailed navigation to product, video, and live performance pages.
How can sellers customize and interpret the data on the performance overview page?
- Sellers can select any date range (default GMT+8), view trend graphs for GMV and other metrics, and compare data with previous periods except when customizing time periods, where comparison is disabled.
- The overview shows top products (GMV top 3), videos (top 2), and live streams (top 2) with detailed trend charts and fuzzy search for products added to the showcase within the past year and viewed in the last 180 days.
What detailed insights are available for video and live stream content performance?
- Video and LIVE performance are tracked separately by GMV, views, and items sold, with top-performing content highlighted and options to explore all videos or livestreams for deeper analysis.
- Video diagnosis results help creators get inspired and optimize content, while live stream pages show ongoing and historical performance metrics for better management.
How does the navigation structure support sellers in exploring their performance data?
- A navigation bar below key metrics provides quick access to detailed pages for Products, Videos, and LIVE streams, enabling sellers to deep-dive into specific content types and performance trends.
- This structure facilitates targeted analysis and helps sellers identify growth opportunities or areas needing improvement across different sales channels.
The performance data overview page has been revamped in Jan 2024. Here you can:
Support viewing sales performance of today or historical time periods, like GMV, and orders. You are able to compare the target data period with the previous time period to find out whether the sales performance is improving or decreasing.
You can view the transaction data and top content/products of live/video/product cards separately.

Clicking the [See trend] button, the trend graph card will expand to show the trend of GMV by default. Switch to see the metric trend that you are interested in.
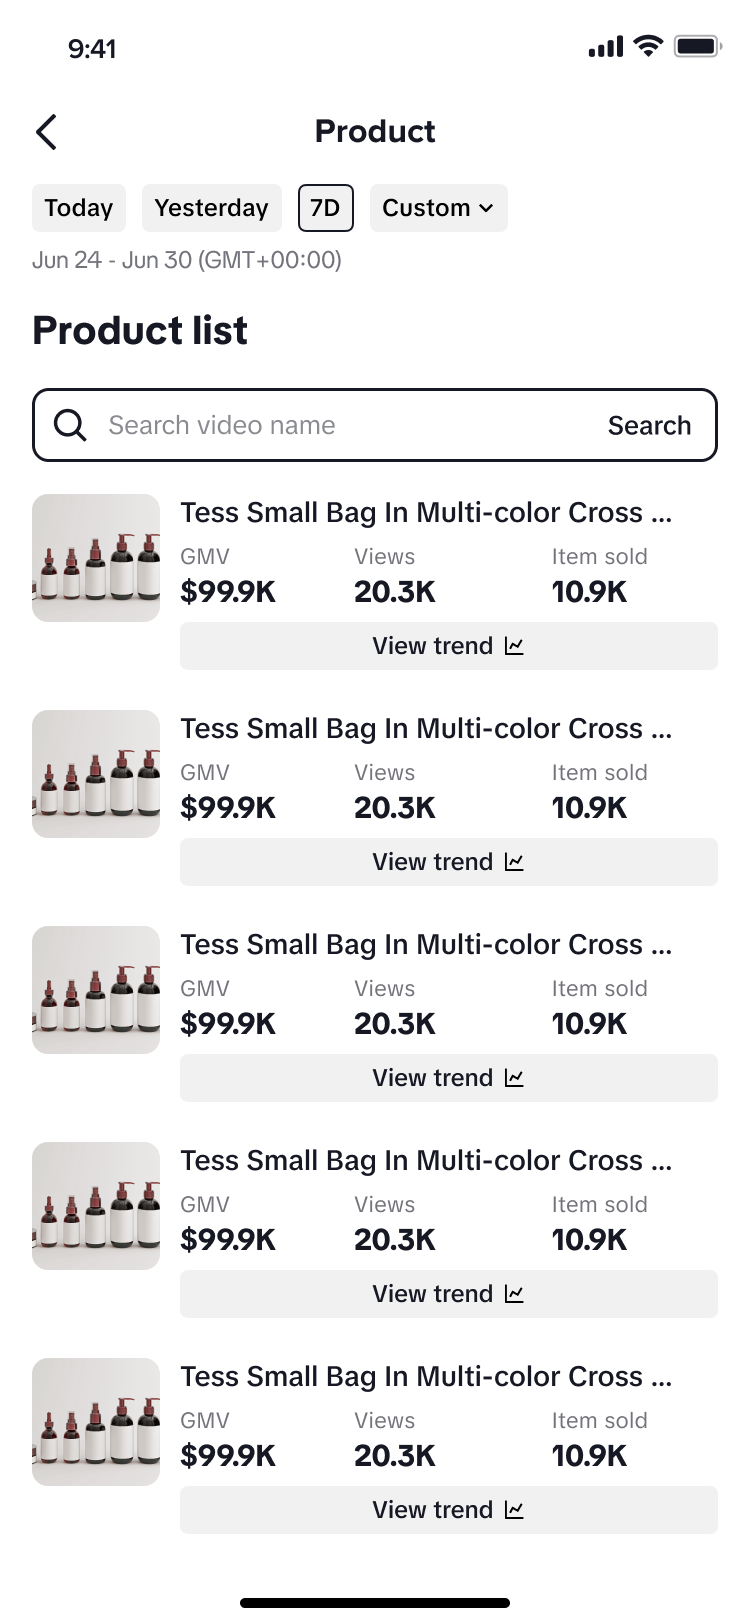
 On the detailed list page, click the View Trend button to expand the indicator trend chart by day. You can switch between 3 indicators for viewing.
The product list detailed page supports the ability to fuzzy search by product names.

Monitor today's transaction performance in real-time
Support viewing sales performance of today or historical time periods, like GMV, and orders. You are able to compare the target data period with the previous time period to find out whether the sales performance is improving or decreasing.
View historical performances by genre
You can view the transaction data and top content/products of live/video/product cards separately.
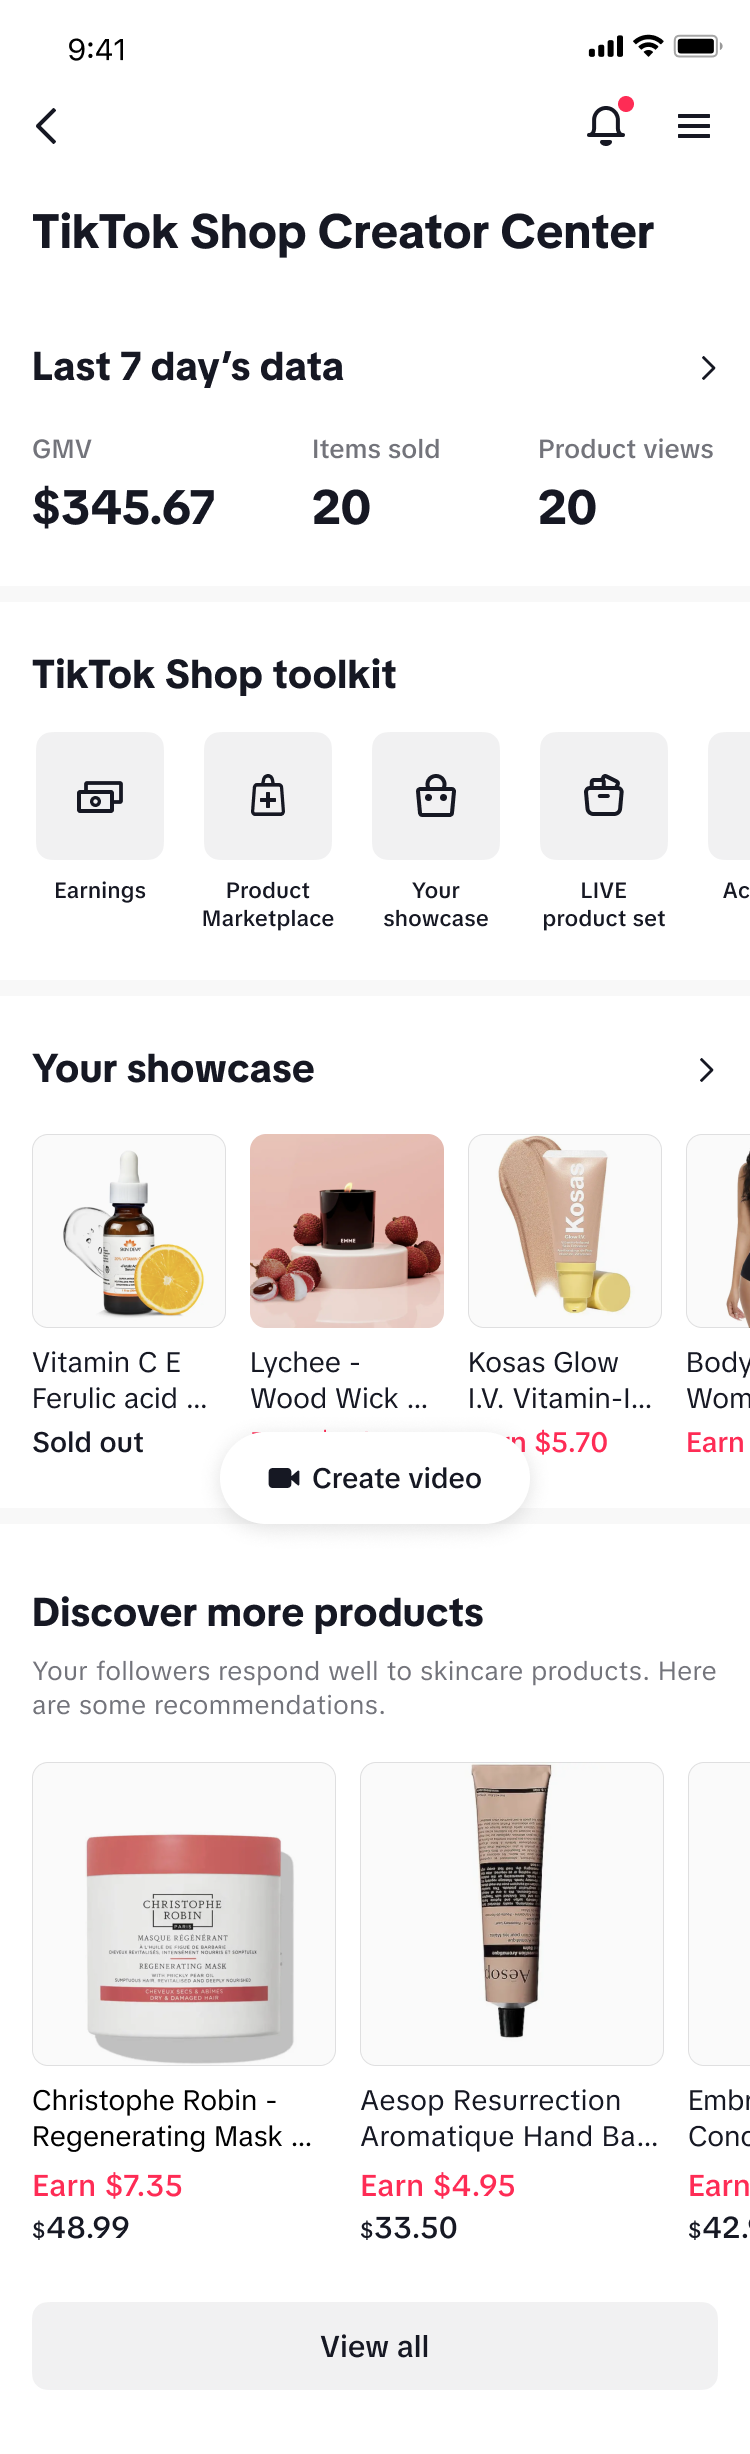
Entrance:
In TikTok Shop Creator Center, click on the arrow icon at the right side of "Last 7 day's data", and you will be directed to the overview page.Detailed introductions:
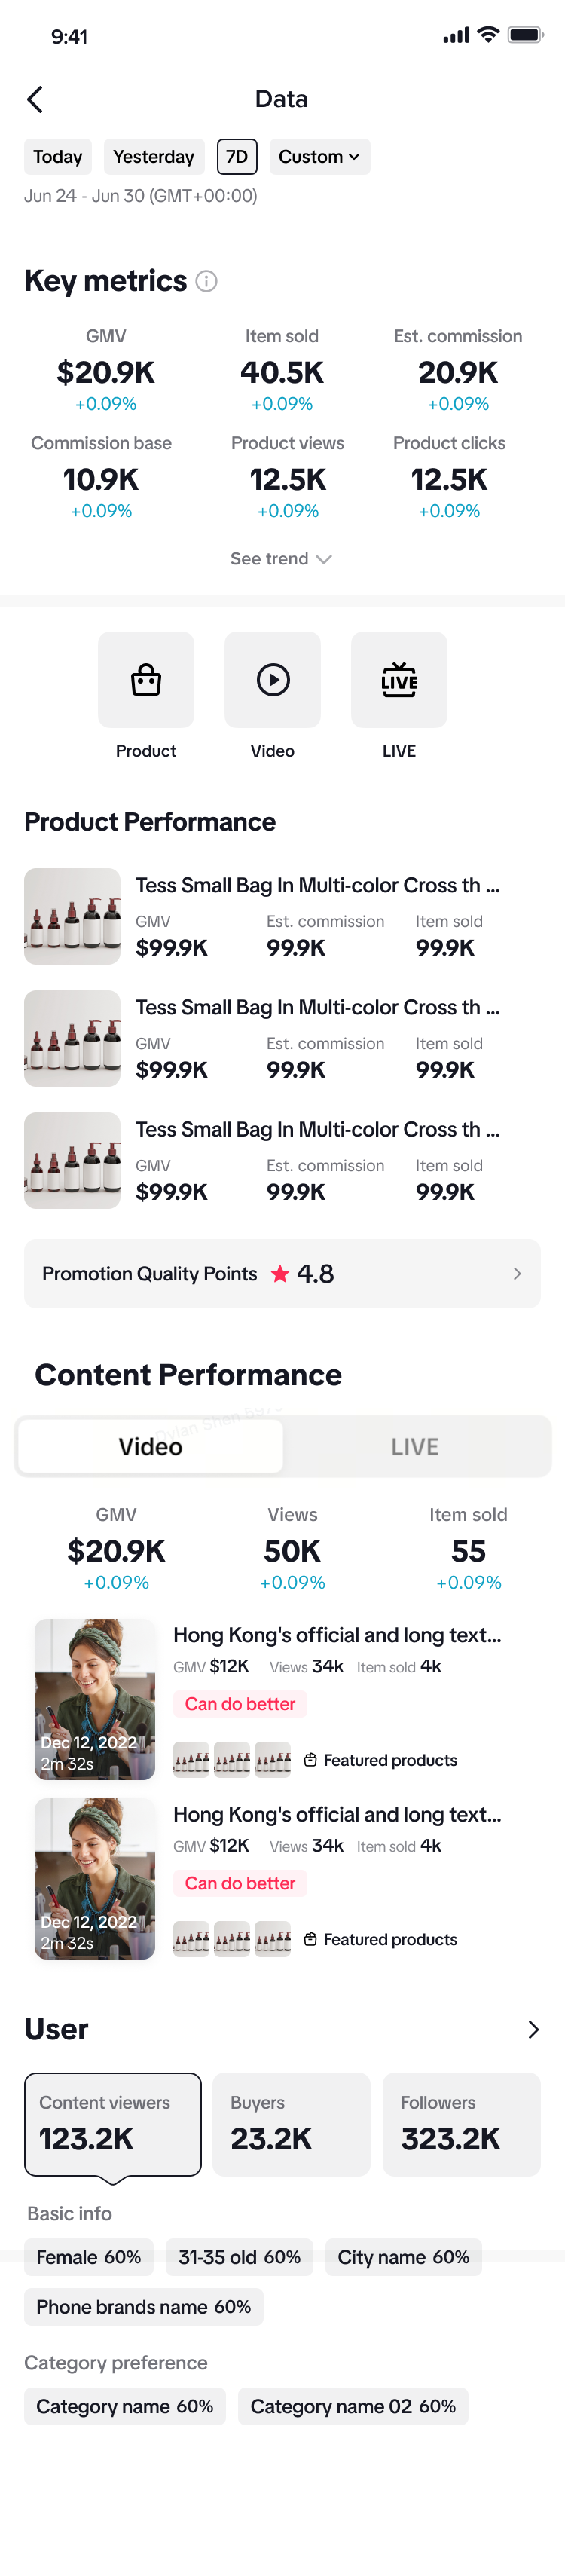
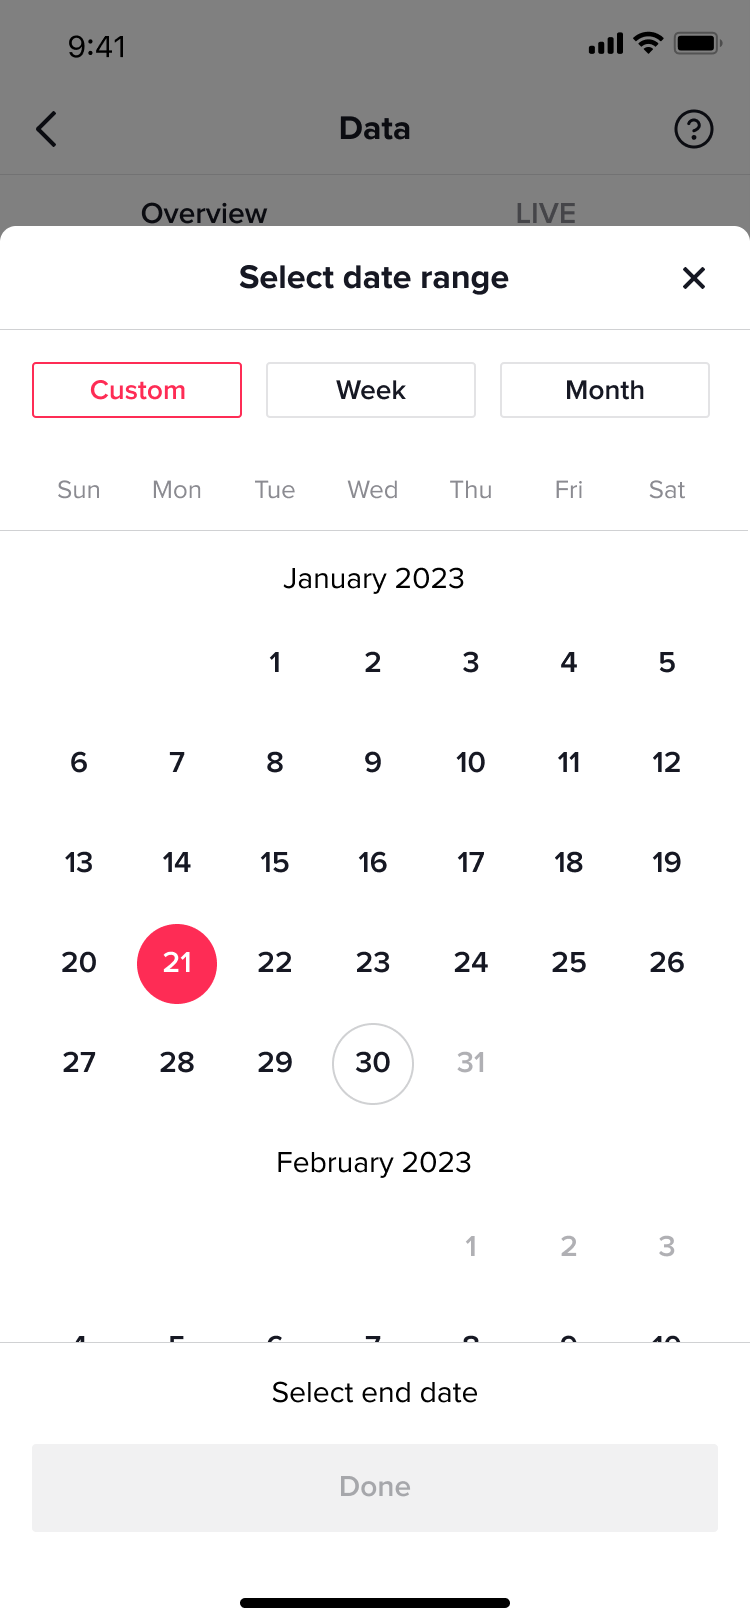
Date picker:At the top of the page, customize the time period that you focus on. You can choose today or any period in the past. The data time zone is GTM-8 by default.Key metrics:
It supports comparison with the previous time period.Clicking the [See trend] button, the trend graph card will expand to show the trend of GMV by default. Switch to see the metric trend that you are interested in.
NOTE:New followers: It will only be displayed when you select "Last 7 Days", "Week" and "Month"The trend graph is displayed at day-level granularity; and it will not display when you choose "today" or one day period.
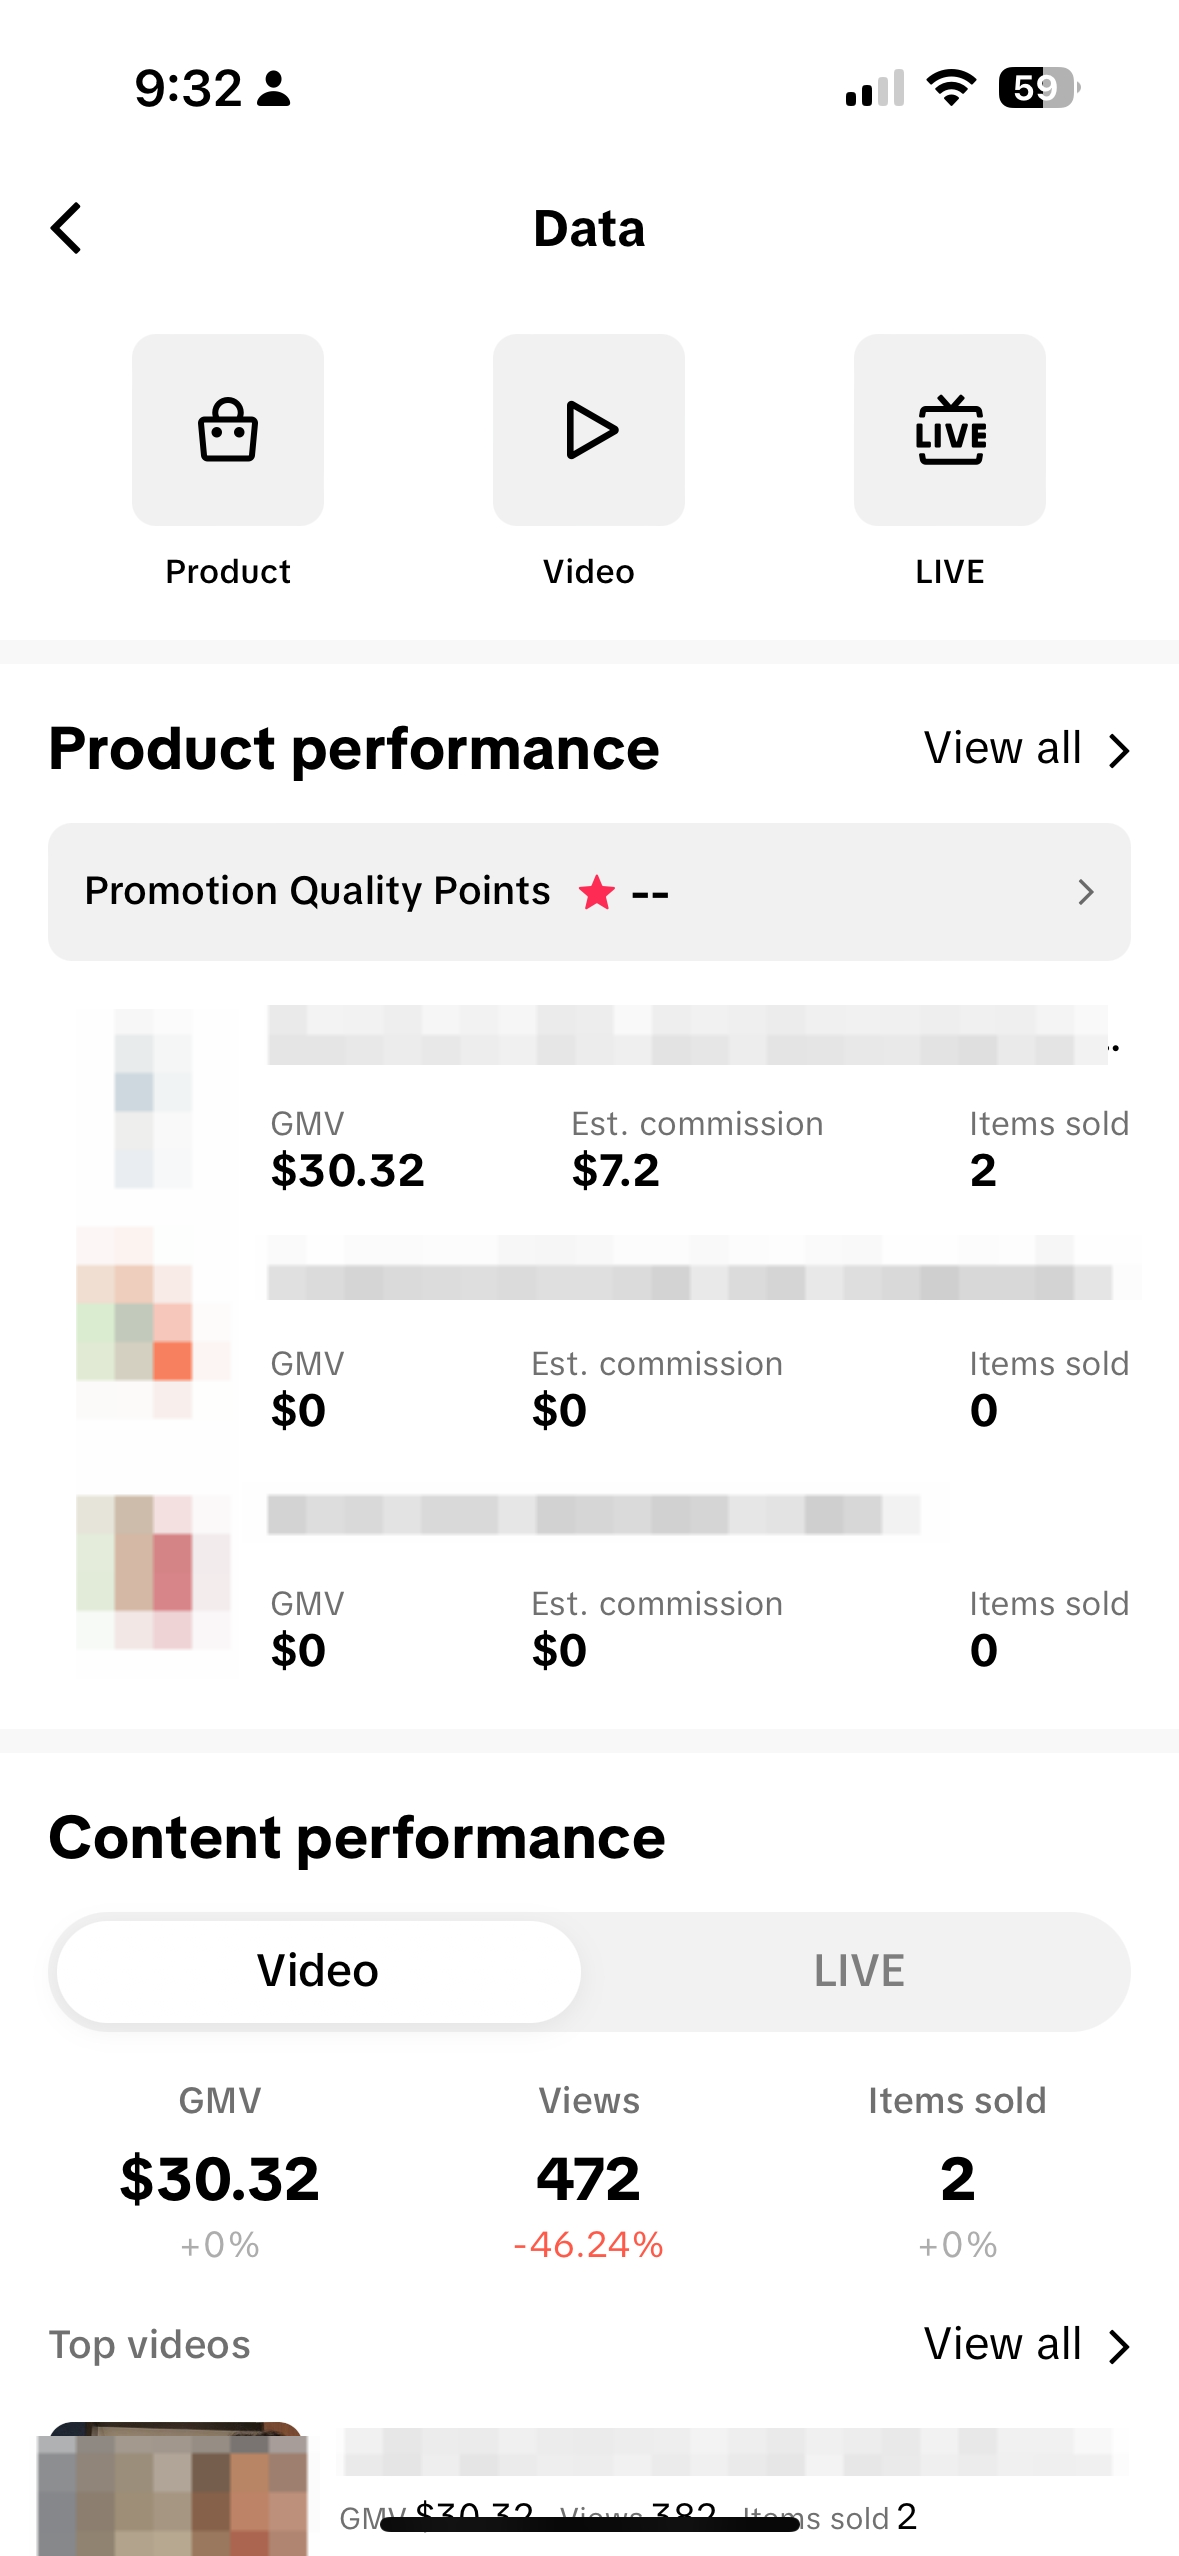
Product Performance
Display GMV top 3 products within the selected time period. Click the arrow to see the complete product list.The product list detailed page supports the ability to fuzzy search by product names.
NOTE:When you choose to customize the time period, the indicators do not support comparison with the previous time period.The product list only displays products that have been added to the showcase in the past year and product views>0 in the past 180 days.
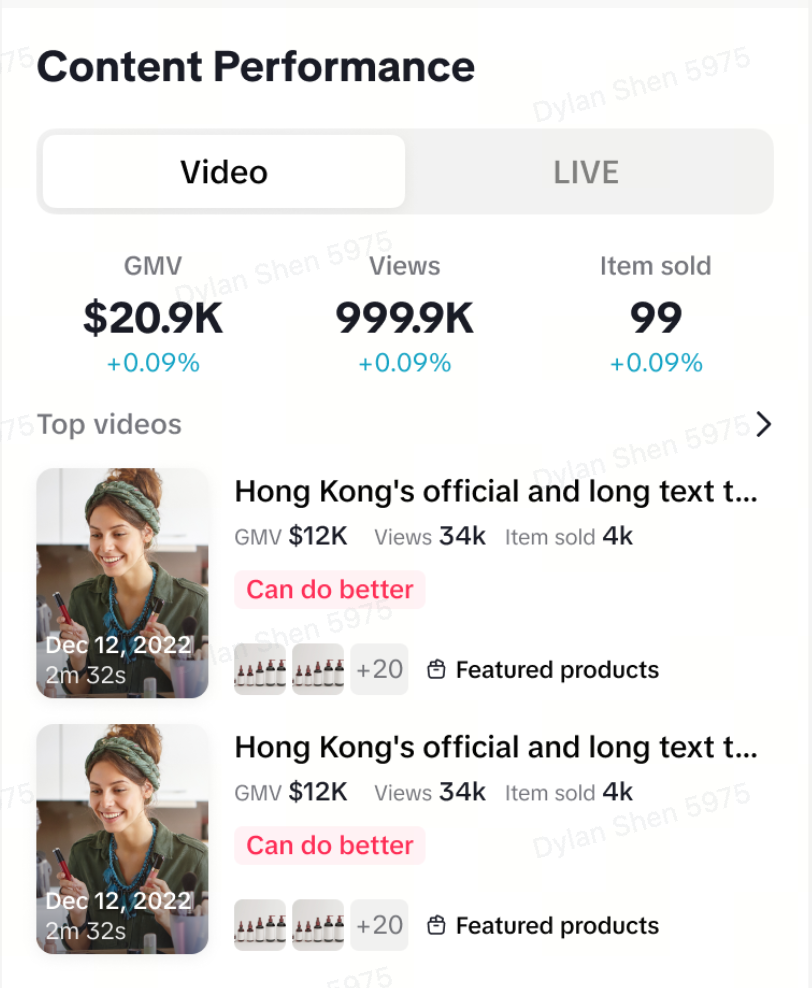
Performance Overview of Video, LIVE
The content performance is split into 2 aspects: Video and LIVE. Under each channel, you are able to check the overall metrics of the creator account by GMV, Views, Items sold.- Video: Display GMV top 2 videos within the selected time period.
- LIVE: Display GMV top 2 livestream within the selected time period.
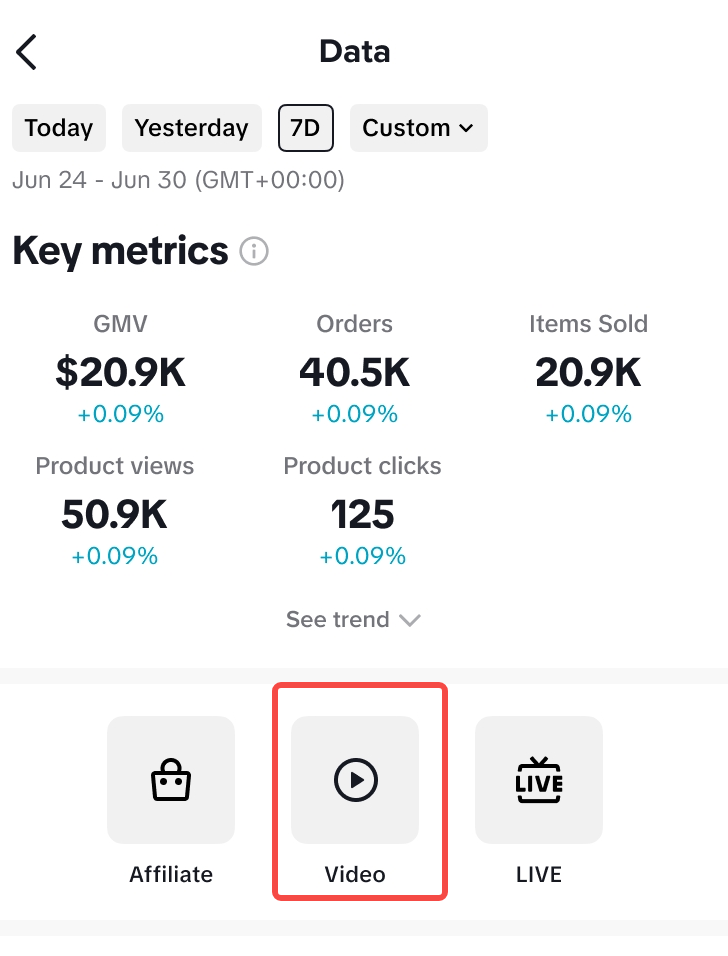
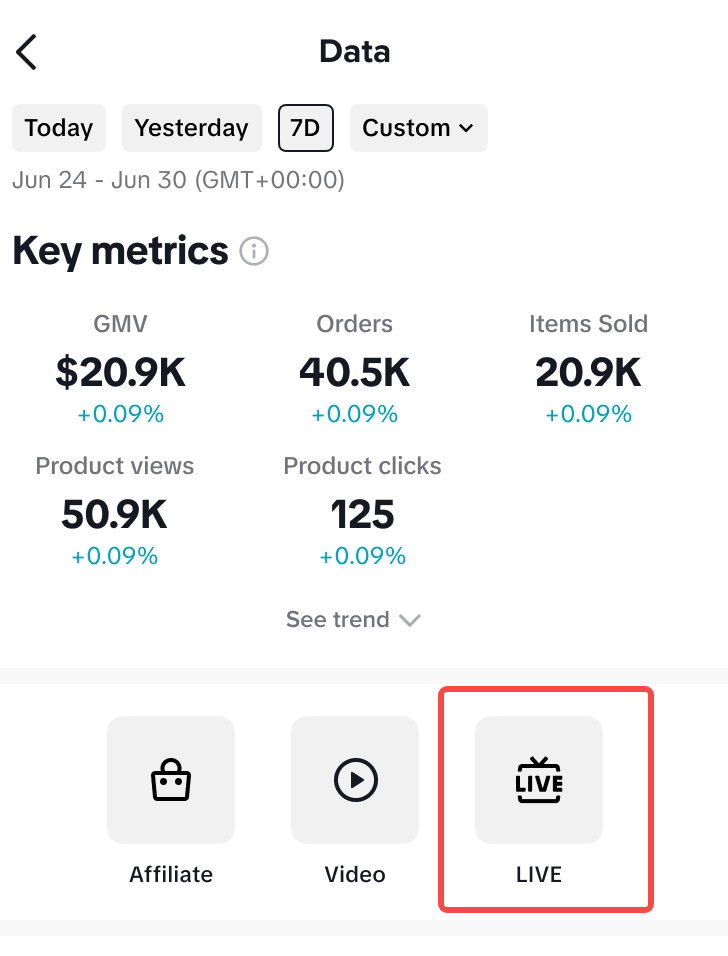
Navigation Bar
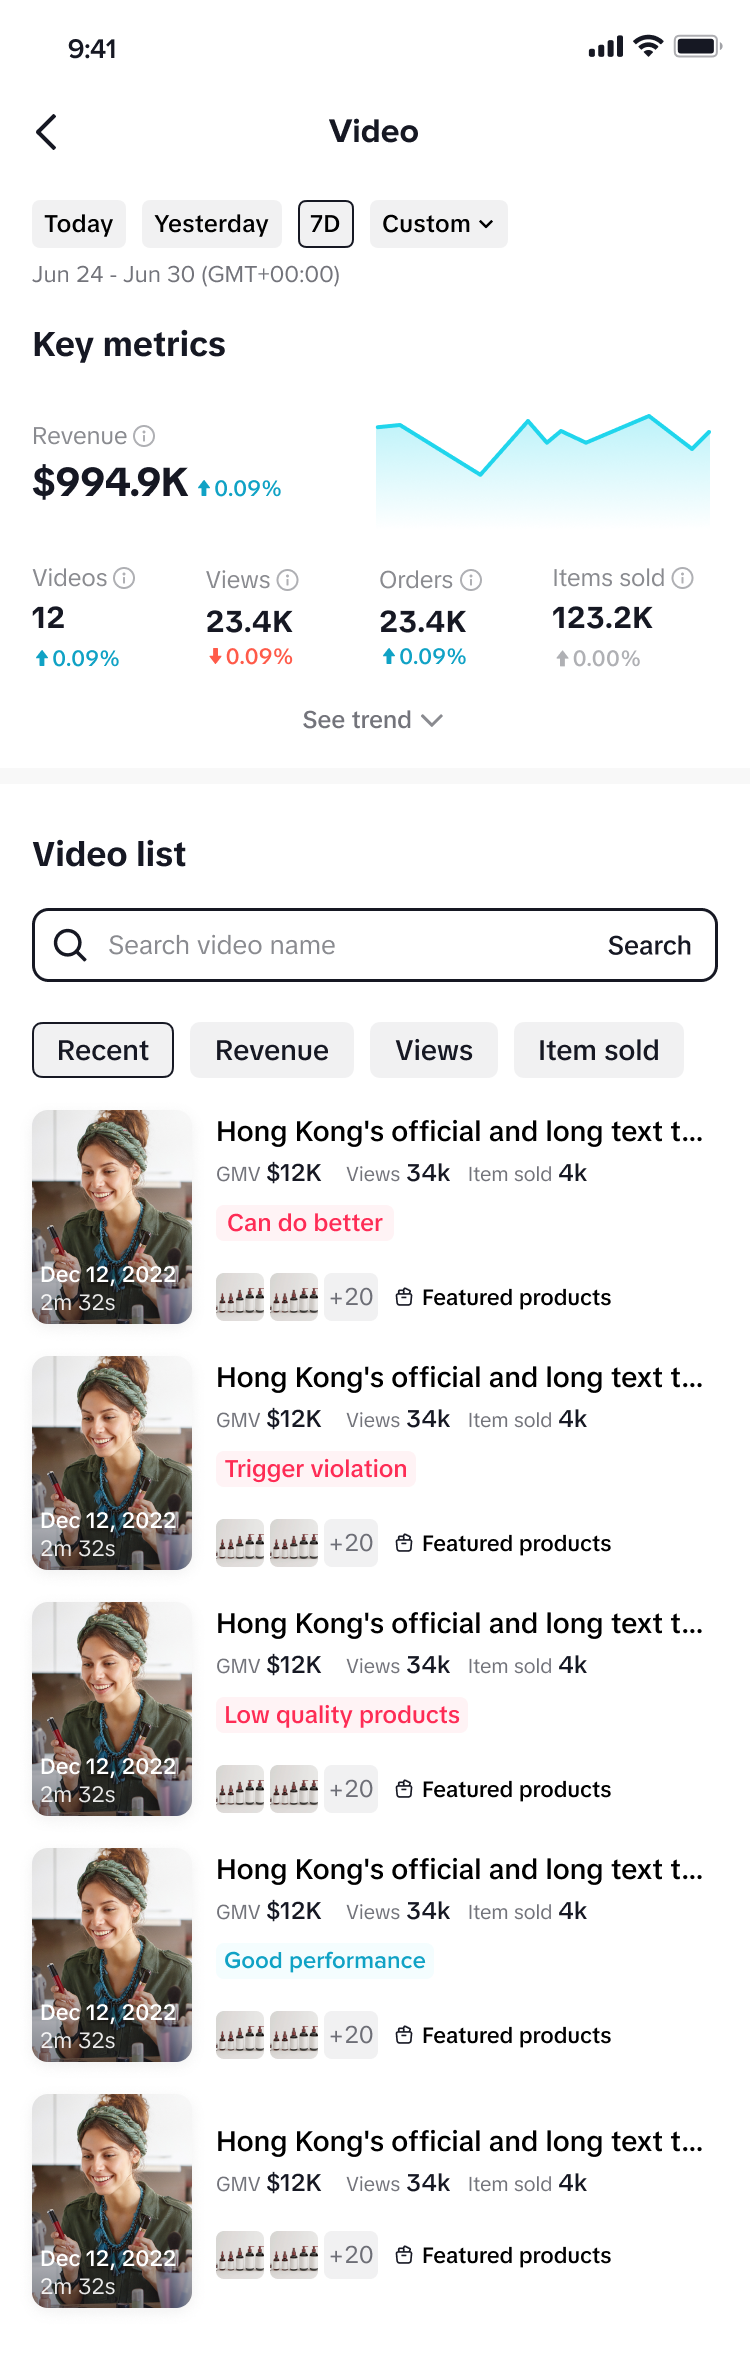
Below the key metrics module, three navigation icons are provided here--Product, Video, and LIVE, which can take you to the corresponding detailed page for further deep-dive.Video detailed page
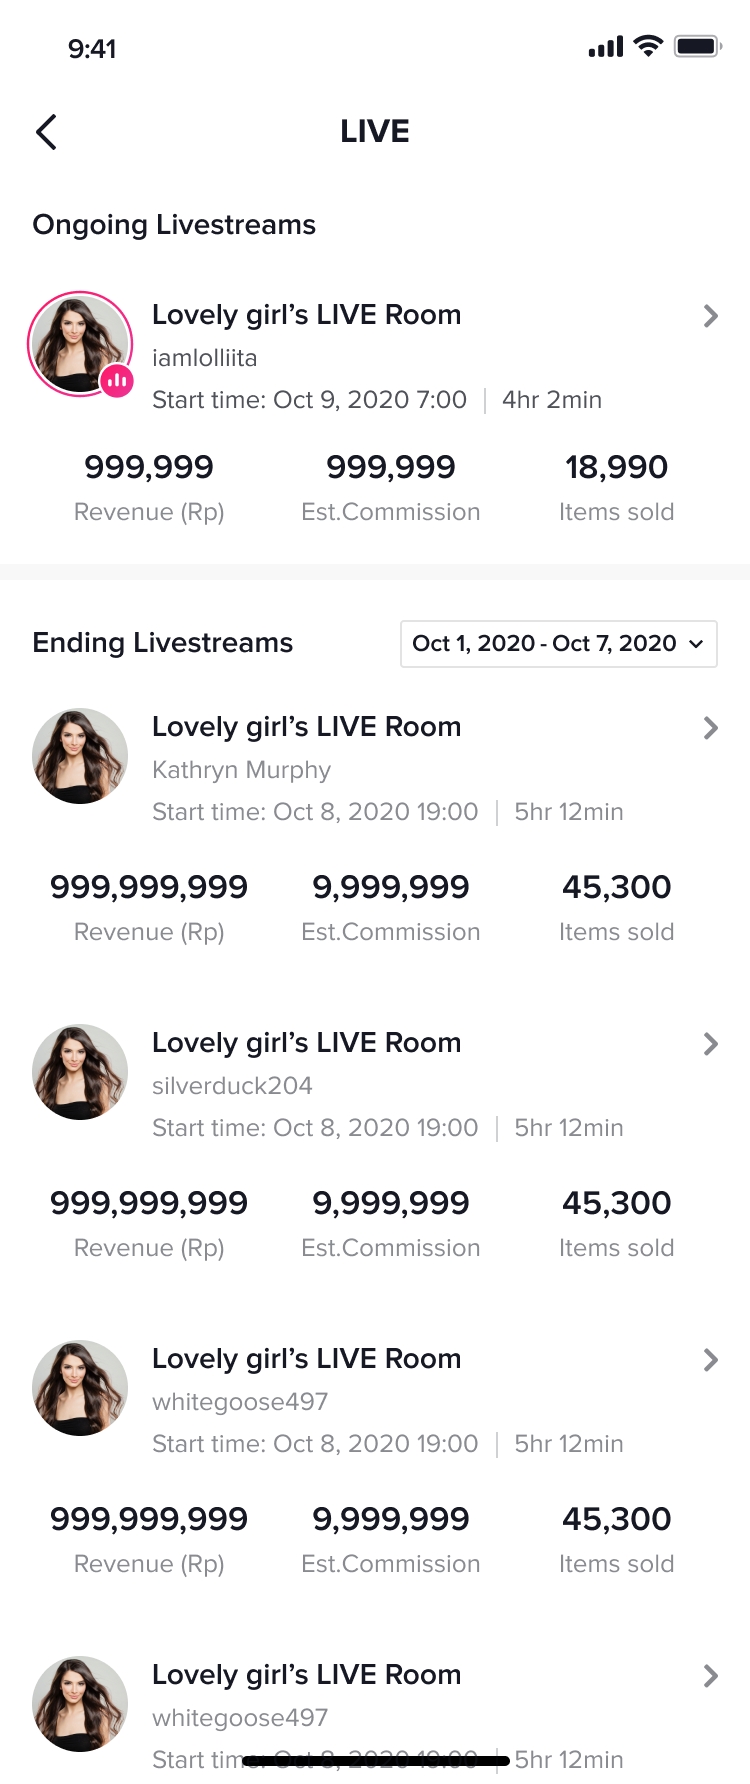
Click on the navigation icon - "Video" and you will jump to the video detailed page. Here you are able to see the aggregate video performance and trends, check video lists, and get inspired by video diagnosis results on each video.LIVE detailed page
Click on the navigation icon - "LIVE" and you will jump to the live detailed page to check performance of ongoing and historical livestreams.