How to use Affiliate Center analytics
Summary
What are the key features and benefits of the new Performance overview in TikTok Shop’s Affiliate Center?
- It offers a streamlined dashboard that consolidates affiliate performance data, providing clear summaries of creators, products, videos, and livestreams in one place for faster insights.
- Reliable, consistent metrics aligned with Seller Center enable confident, data-driven decisions to scale affiliate success.
How can sellers and creators access and utilize the Performance tab to analyze their affiliate data effectively?
- Access the Performance tab in Affiliate Center to view core metrics like GMV, orders, items sold, and traffic across collaborations, products, and content with flexible preset or custom date filters up to six months.
- Break down data by collaboration type, content type, and product category to identify where affiliate investments yield the strongest results.
What tools and tips does TikTok Shop provide to help sellers understand and leverage their affiliate metrics?
- Tooltips explain metric definitions for clarity, while the “Show trends” toggle allows comparison of two metrics over the same period to spot relationships and performance shifts.
- Data export options enable further offline analysis for deeper insights beyond the platform.
How does the new Performance overview ensure data consistency with other TikTok Shop analytics tools?
- Metrics in the Performance tab are standardized and calculated identically to those in Seller Center, ensuring sellers see consistent and reliable data across both platforms.
What is the current status of the new Performance page relative to older analytics dashboards in Affiliate Center?
- The Performance page is a new addition and currently coexists with older dashboards, but it is the most reliable source for affiliate GMV data and may eventually replace older analytics pages as improvements continue.
Product Overview
Analyze your affiliate performance and scale your success with a clear, reliable, and centralized Performance overview in Affiliate Center.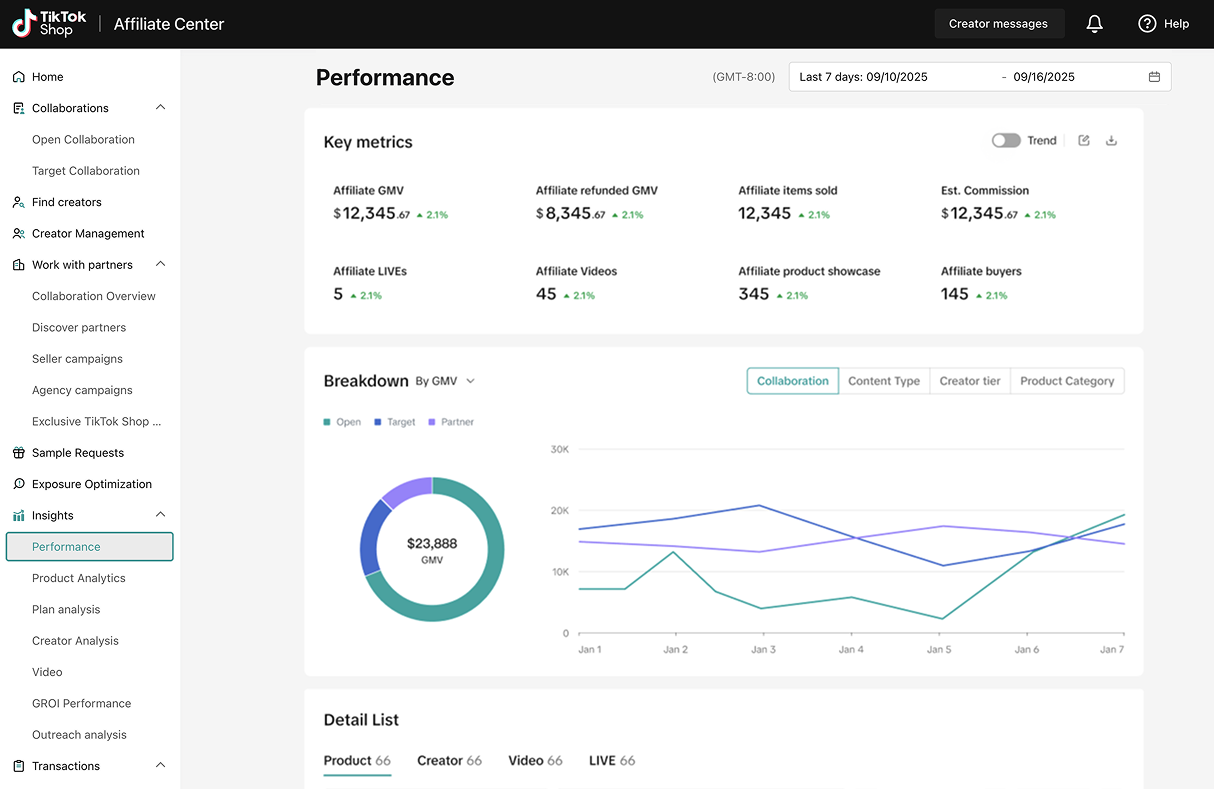
- Find your insights faster: Stop clicking around with a streamlined dashboard design that gives you a clear summary of your performance.
- Get the data you need: Say goodbye to guesswork and access consistent, reliable metrics that match definitions in Seller Center.
- See the big picture, at a glance: Analyze your affiliate performance holistically with a high-level summary that brings together creators, products, videos, and livestreams — all in one place.
- Spot trends and take action: Track shifts in performance, review sales composition, and quickly identify which creators and content are driving the strongest results.
- Drill down with ease: Navigate seamlessly into product, creator, video, or live analytics, with your chosen date range applied across tabs for consistency.
- Decide with Confidence, faster: Leverage a restructured data foundation and an expanded set of reliable metrics aligned with Seller Center, giving you trustworthy insights to grow faster.
How it works
We've added a page to Affiliate Center analytics to make it easier to find and understand your performance data.- Access your dashboard. Go to the Affiliate Center and click on the new Performance tab. You'll land on a redesigned dashboard with a streamlined view of your core strategic data.
- Explore your performance. This page consolidates your core performance data, including GMV, orders, items sold, and traffic metrics, for all your collaborations, products, creators, and content.
- Use flexible time filters. We've added more pre-set time filters like last seven days, last 28 days, and last week. You can also use a custom time filter that allows you to trace data back up to six months.
- Break down your data. You can break down your metrics by collaboration type, content type, and product category to see where your affiliate investments are having the most impact.
Tips
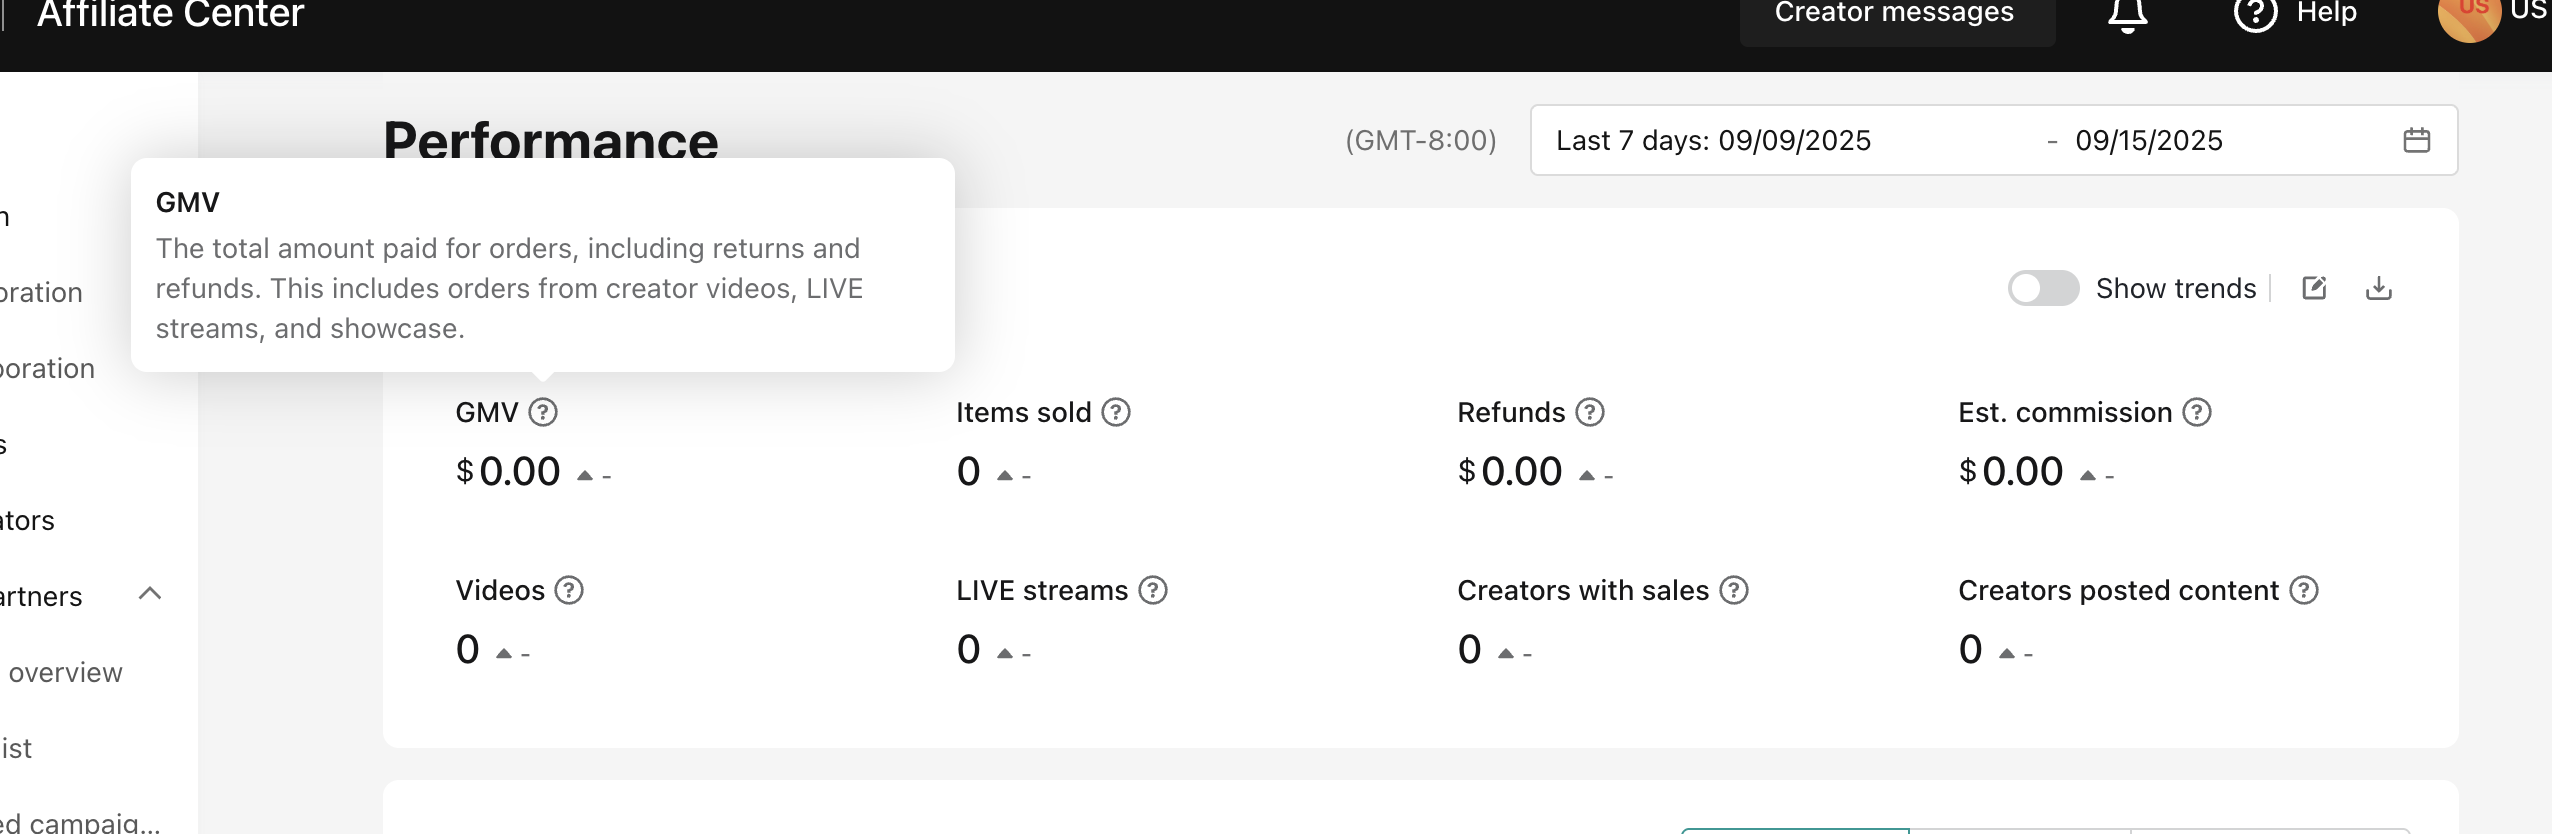
- Understand your metrics! To understand the definitions for your key metrics, use the tool tip (grey question mark in circle) to learn more about each metric and how we define it.
- Explore trends! By toggling "Show trends" in the key collaboration metrics section, you'll have the ability to compare two metrics over the same time range. This can be helpful in understanding the relationship between different dimensions.
- Export your data for further analysis. In the key collaboration metrics and details section, you'll have the opportunity to export your data if there is additional analysis you want to do off the TikTok Shop platform.
FAQs
- Does this data match what's in Seller Center?
- Will the old analytics dashboards still be available?
- I want to learn more about samples?
- How do I look up the definitions of my key collaboration metrics?