

Customer Analytics: Learn more about your shop’s new and repeat buyers
05/07/2024
Summary
What is the purpose of Customer Analytics in Data Compass for TikTok Shop sellers?
- Customer Analytics helps sellers understand customer acquisition, follower conversion rates, and transaction statuses to implement targeted strategies for different customer groups.
How can sellers expand their shop's new buyer base using Customer Analytics?
- Sellers can click on the New Buyer card to track growth rates and revenue from new buyers, and analyze trends to tailor content that attracts new buyers based on device price estimates.
How can sellers promote repeat purchases among returning buyers?
- By using the Repeat Buyer card, sellers can identify products and content that attract repeat buyers, and create similar content to engage these groups and encourage repeat purchases.
How can sellers improve their accounts' ability to attract new followers?
- Sellers can analyze follower growth trends for different accounts and use the New Followers card to tailor content that matches new buyers' preferences, enhancing follower attraction.
What insights can sellers gain about new and active followers?
- Sellers can view trends, transaction totals, and channel contributions for new and active followers, and analyze customer portraits to understand preferences and device price distributions.
Access this feature here
.Would you like to know how many new buyers your shop has attracted recently?Would you like to know the statistics on your shop's new and repeat buyers?Would you like to know how many followers your different accounts have recently amassed?Would you like to know which products and LIVEs bring in more followers and new buyers?Customer Analytics will soon be available in Data Compass to help sellers understand their customer acquisition, follower conversion rates, the proportion of different customer groups, transaction statuses, and how to implement targeted operational strategies for different customer groups.(Disclaimer: Any analytics displayed in Data Compass are estimated based on factors such as buyer behavior, information provided by customers, and device information. The accuracy of such insights may vary with the information provided. In using or relying on such insights when managing your TikTok Shop account, you agree that these estimates are not a guarantee of future performance.)
Main usage scenarios
Scenario 1: Expand your shop's new buyer base
- Instructions:
 (Device price information is an estimate and may become more inaccurate over time. Estimated prices are based on the device price at the time it was launched in each market.)
Scenario 2: Promote repeat purchases for returning buyer groups
- Instructions:
Scenario 3: Improve the ability of your accounts to attract new followers
- Instructions:
Scenario 4: Increase follower activity with high-quality content
- Instructions:
Detailed introduction to features
New and repeat buyer customer portraits
- New Buyers: New buyers are defined as customers who have made a purchase during the selected period but have no history of making purchases from the shop in the prior year.
- Repeat Buyers: This is the number of buyers who made a purchase during the selected period minus the number of new buyers during that same period.
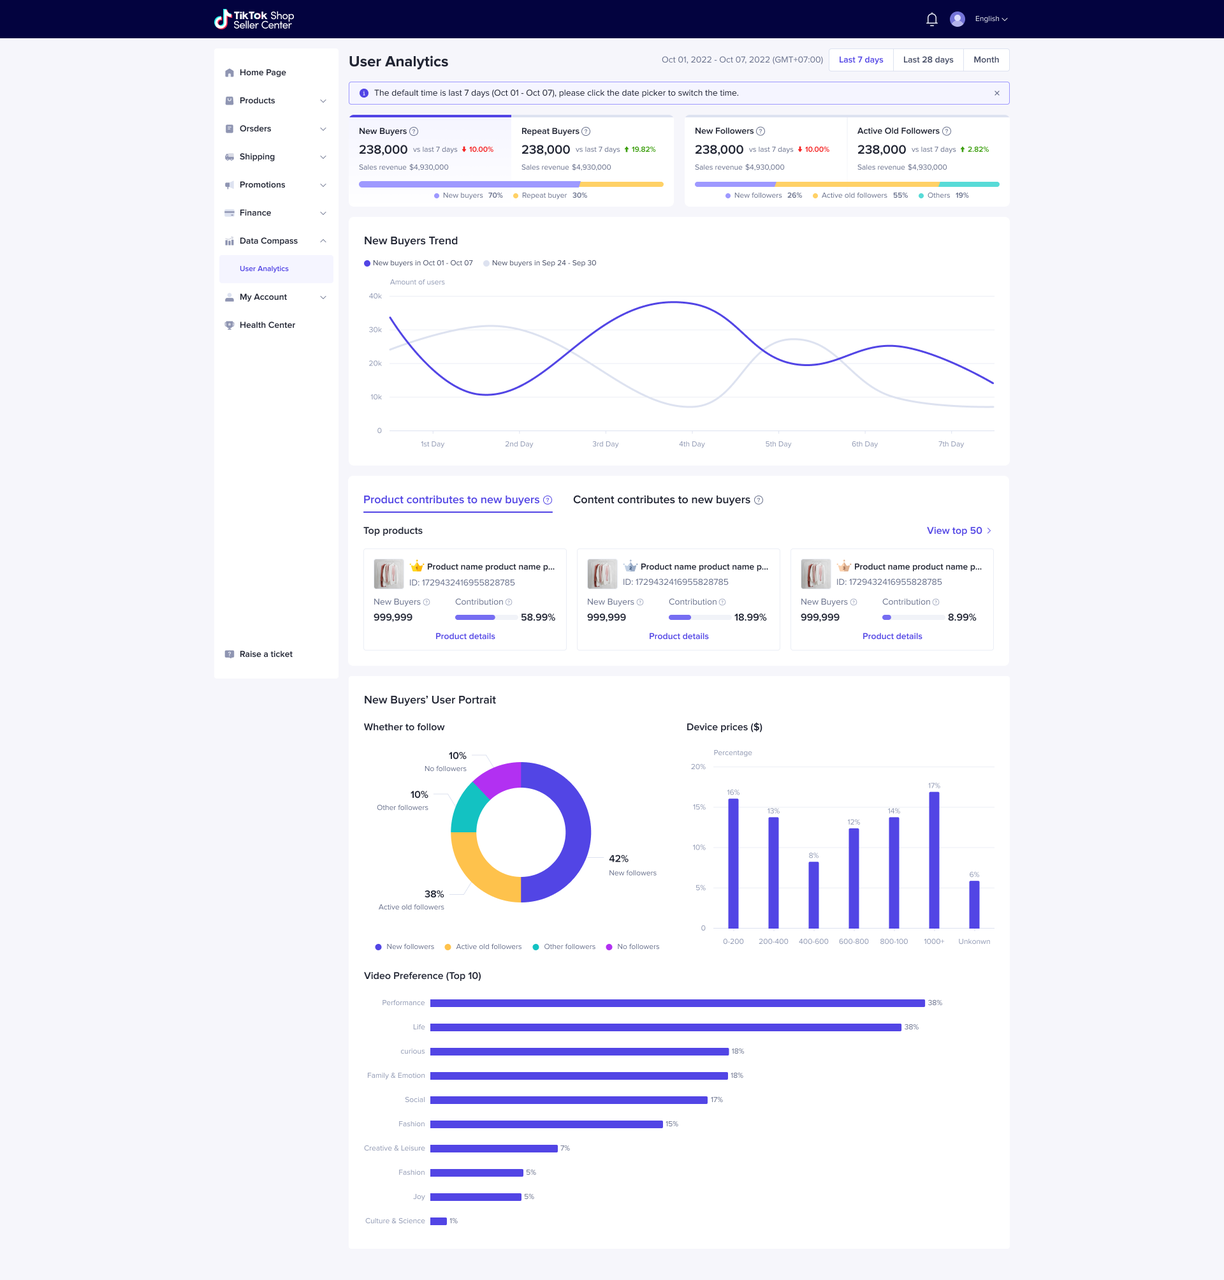
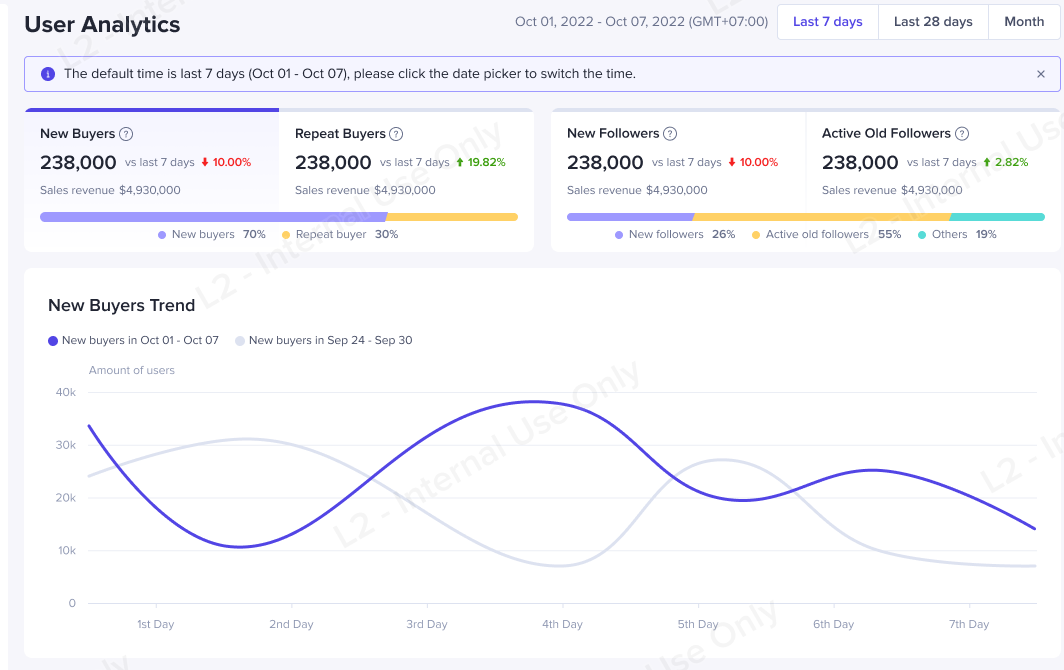
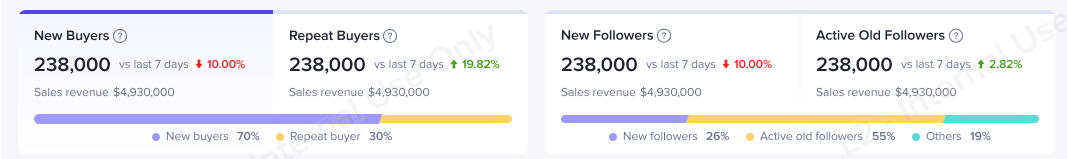
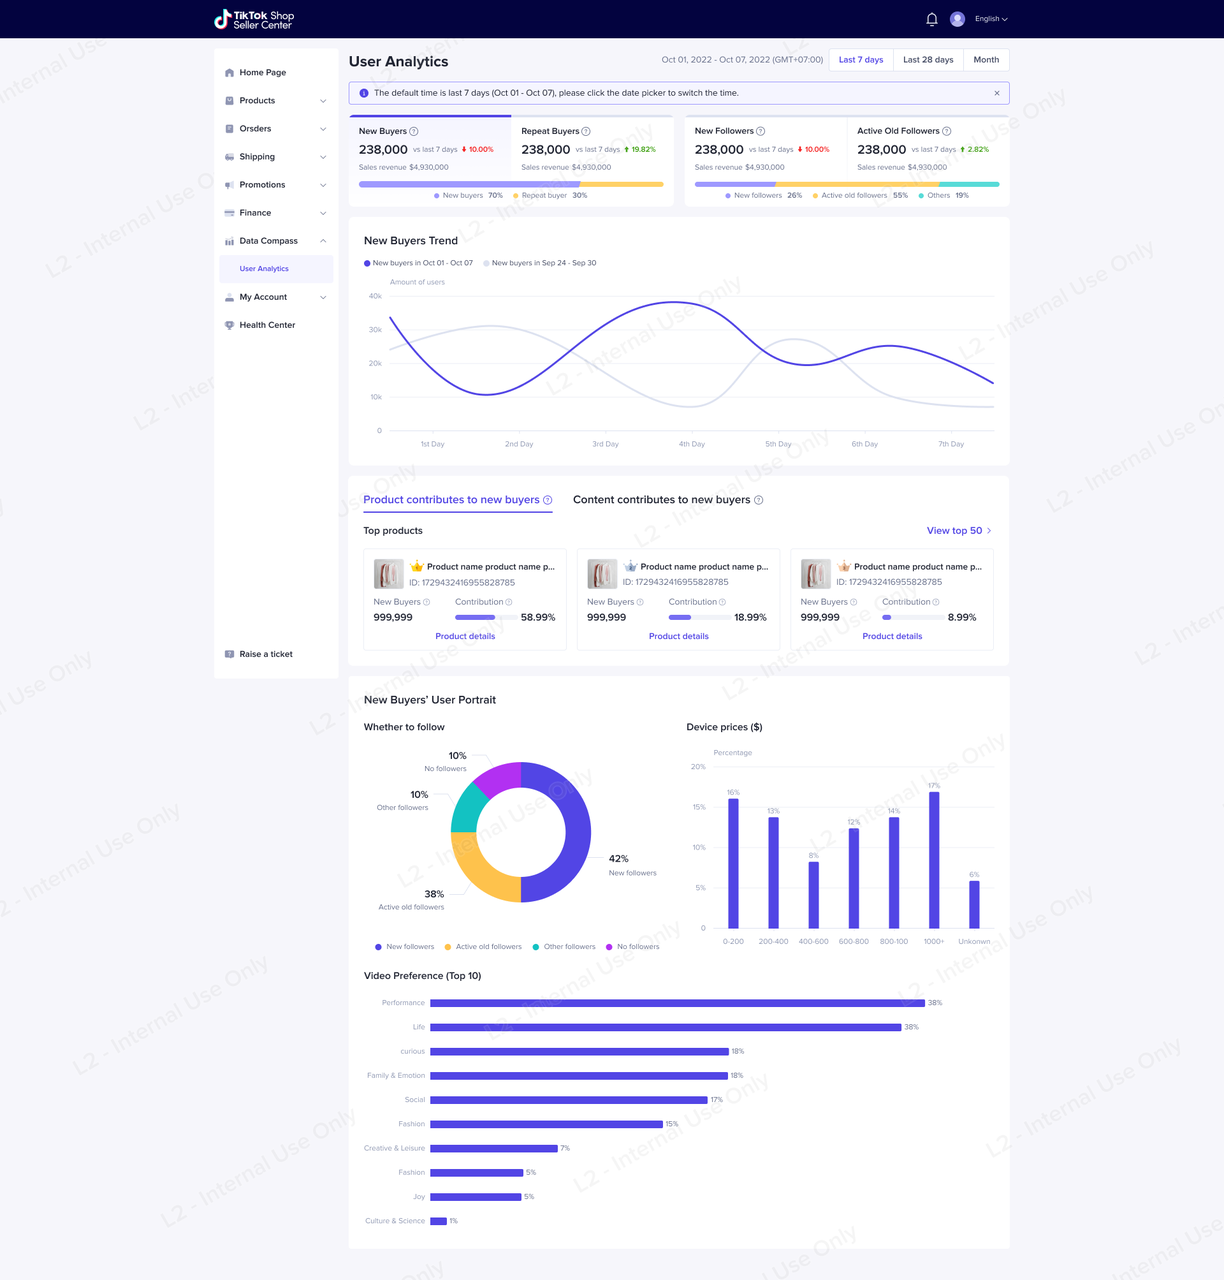
Overview of new and repeat buyers
- View the total number of new and repeat buyers and the change in the number of new buyers over the previous 7 days.
- View the proportion of new and repeat buyers out of all buyers.
- View the revenue brought in by new and repeat buyers for the selected period.
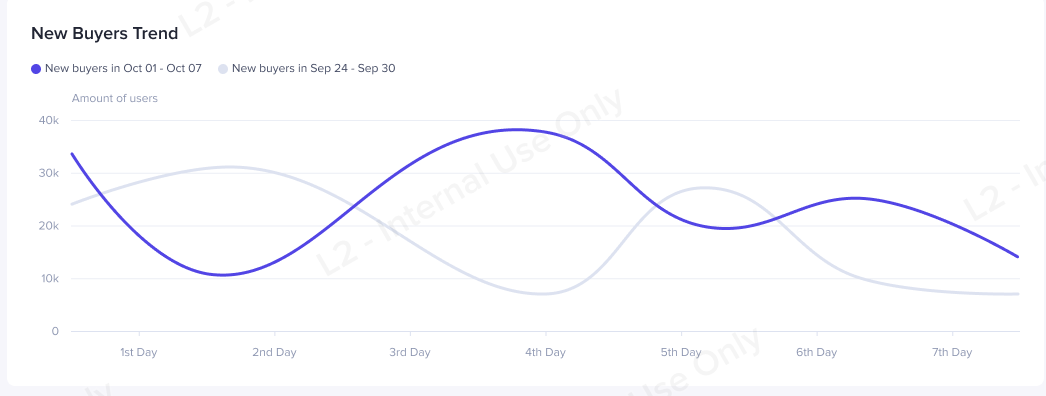
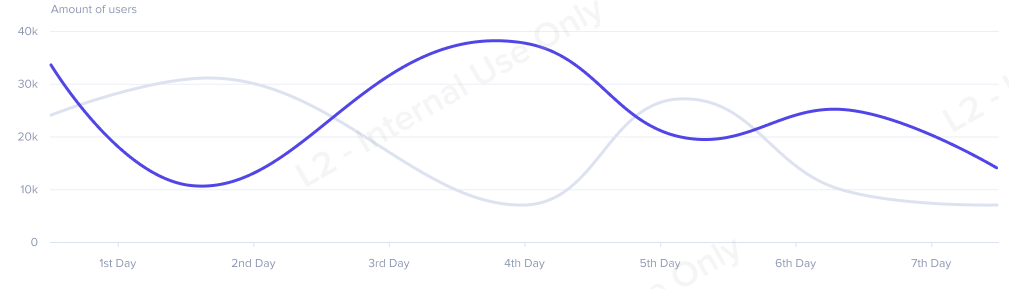
New and repeat buyers trends
- View trends for your shop’s new and repeat buyers and compare them with data from the previous 7 days.
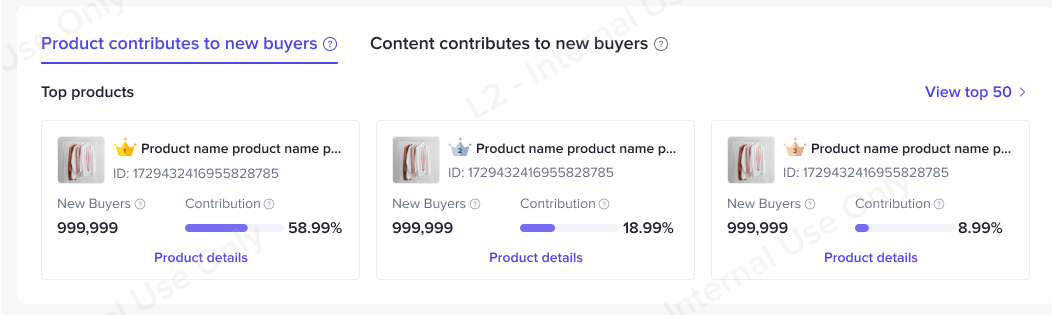
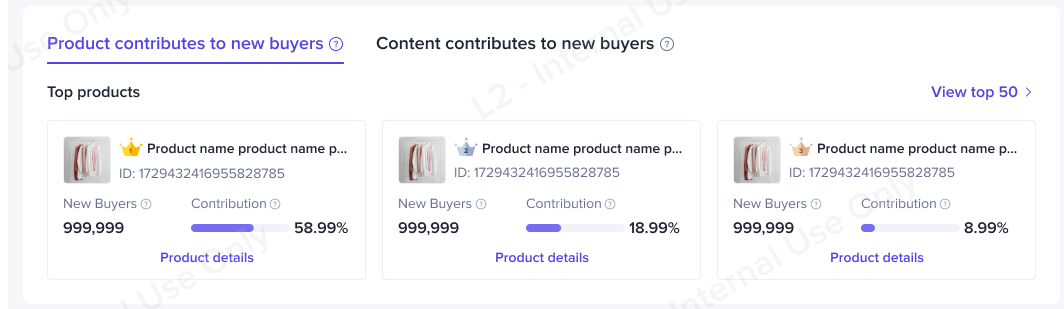
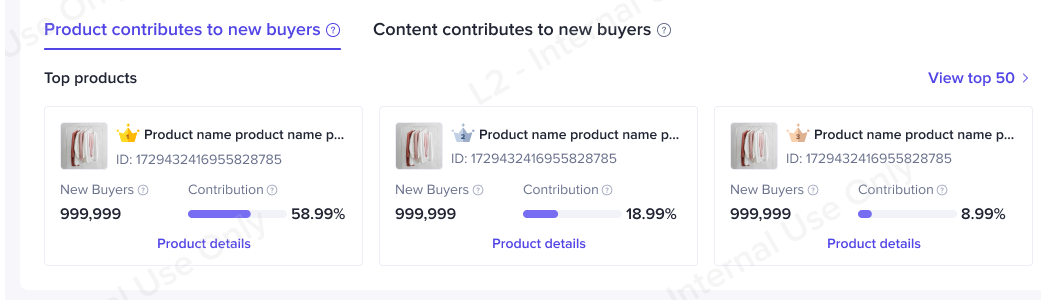
Find out the contribution of different products and channels to revenue from new and repeat buyers
- Product contribution ranking: Displays the revenue from new and repeat buyers for each product. Click Details to go to the product details page.
- Channel contribution ranking:
- LIVE: Displays the revenue from new and repeat buyers brought in by different LIVEs. Click Live Dashboard to go to the Live Dashboard.
- Videos: Displays the revenue from new and repeat buyers brought in by different videos.
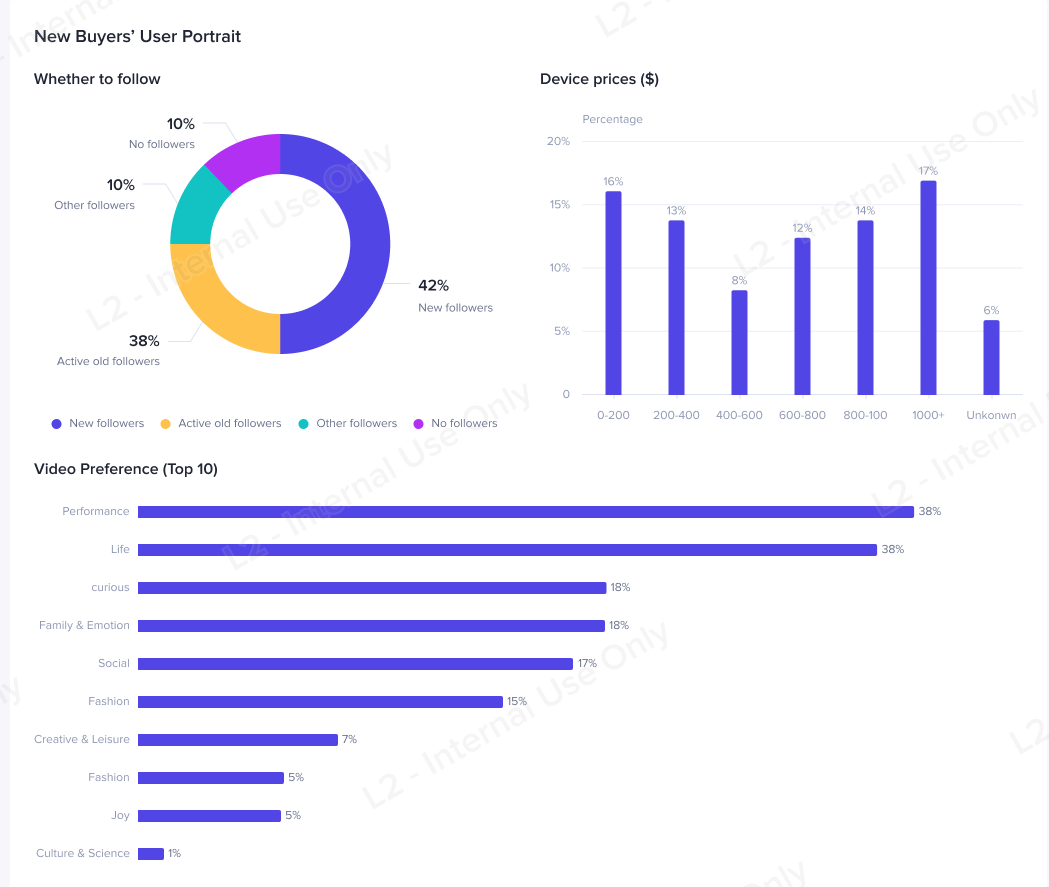
New and repeat buyer customer portraits
- Followers: Displays the proportion of non-followers, new followers, and active followers from the new and repeat buyers.
- Device price: Displays the price band distribution of new and repeat buyers' mobile phones.
- Video preferences: Displays video content preferences of new and repeat buyers.
New and active followers’ customer portraits
- New Followers: The number of people who followed accounts linked to the shop (official accounts and channel accounts) during the selected period and who were still following the account on the last day of the selected period.
- Active Followers: Followers who viewed videos or LIVEs for the accounts linked to the shop (including e-commerce and non-e-commerce content) during the selected period and who were still active followers (total followers minus new followers) of the account on the last day of the selected period.
- Total Followers: The number of customers following the account on the last day of the statistical period.
Overview of new and active followers
- View the number of new and active followers and compare the change for the previous 7 days.
- View the proportion of new and active followers out of all followers.
- View the transaction totals for new and active followers during the selected period.
New and active follower trends
- View trends for new and active followers for different accounts and compare them with the data for the previous 7 days.
Find out the contribution of different products and channels to revenue from new and active followers
- Channels for acquiring new followers:
- Channel contribution ranking:
- LIVE: Displays the number of new followers brought in by different LIVEs. Click Live Dashboard to go to the Live Dashboard. Click More Lives to view the number of new followers brought in by other LIVEs.
- Video: Displays the number of new followers brought in by different videos. Click More Videos to view the number of new followers brought in by other videos.
- Product Card: Displays the number of new followers who have followed the account through product cards.
- Channel contribution ranking:
- Channels frequented by active followers:
- Channel contribution ranking:
- LIVE: Displays the number of active followers attracted by different LIVEs. Click Live Dashboard to go to the Live Dashboard. Click More Lives to view the number of active followers brought in by other LIVEs.
- Video: Displays the number of active followers attracted by different videos. Click More Videos to view the number of active followers brought in by other videos.
- Product Card: Displays the number of active followers who have followed the account through product cards.
- Channel contribution ranking:
New and active followers’ customer portraits
- Followers: Displays the proportion of non-purchasing customers, new buyers, and repeat purchase buyers out of new and active followers
- Device price: Displays the price band distribution of new and active followers' mobile phones