

How to Analyze Product Performance in LIVE Manager
Summary
What key product performance insights can sellers gain from TikTok Shop’s Product Analytics?
- Sellers can track revenue, commission, traffic, refund rates, and buyer behavior across livestreams, videos, and showcases to optimize product strategy.
- Detailed metrics include product ranking by revenue and refunds, conversion funnel analysis, and demographic breakdowns by age and gender.
How does Product Analytics help sellers understand and improve conversion rates and customer retention?
- By analyzing conversion rates at each funnel stage (view → click → purchase), sellers can identify where customers drop off and adjust marketing or product offerings accordingly.
- Insights into refund and bad evaluation rates help sellers address quality issues and reduce customer loss.
What specific features enable sellers to analyze product performance across different sales channels on TikTok Shop?
- Sellers can compare revenue, orders, and buyer data across livestreams, videos, and showcases, with the ability to view top-performing content and jump directly to detailed video or live analysis.
- User conversion and demographic data are available by channel, allowing targeted optimization based on audience behavior and preferences.
Are there any limitations or recommendations when using the Product Analytics tool for custom time ranges?
- User profile and unique visitor (UV) data are not available for custom time ranges due to deduplication issues; sellers should use preset periods like last 7 or 28 days for accurate user insights.
How can sellers utilize the export and search functions within Product Analytics to enhance their data-driven decisions?
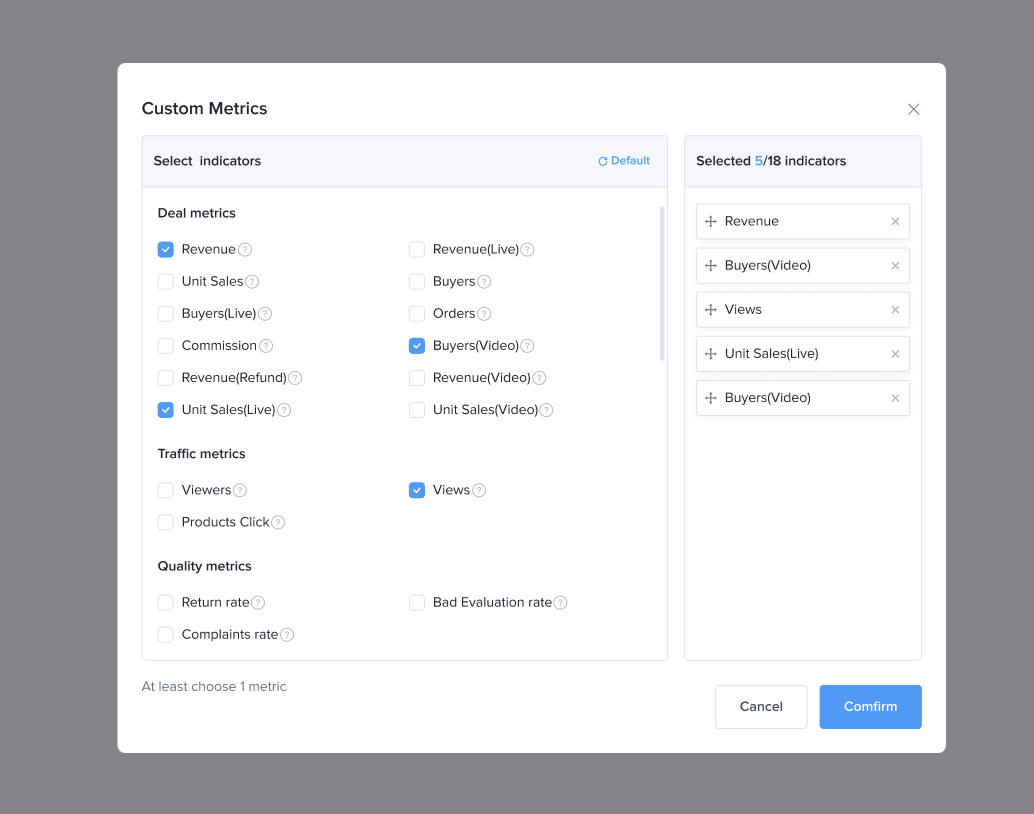
- Sellers can export detailed product data across 22 performance metrics for offline analysis and use the search function to quickly locate specific products for focused evaluation.
How to access: LIVE Manager > Data Compass > Product Analytics
Highlights
- See revenue, commission, traffic and refund performance of the products you've sold
- See which Videos and Livestreams sell the most products
- Get more insight into why you lost customers and who is interested in the products you are promoting
How to use Product Analytics
See high level product metrics
In-depth Product analysis
Understand product performance of different channels
Analyze Conversion funnel
Core features
- Product revenue channel analysis
- Understand the revenue amount and ranking of livestream/video/showcase, as well as TOP video and livestream, and support jump to live analysis and video analysis directly.
- Product user analysis
- Show all/livestream/video/showcase channels' conversion rate from view to click and from click to revenue, as well as gender and age distribution of users group at each stage. Support the comparative analysis of the distribution of people in different stages.
Detail introduction of functions
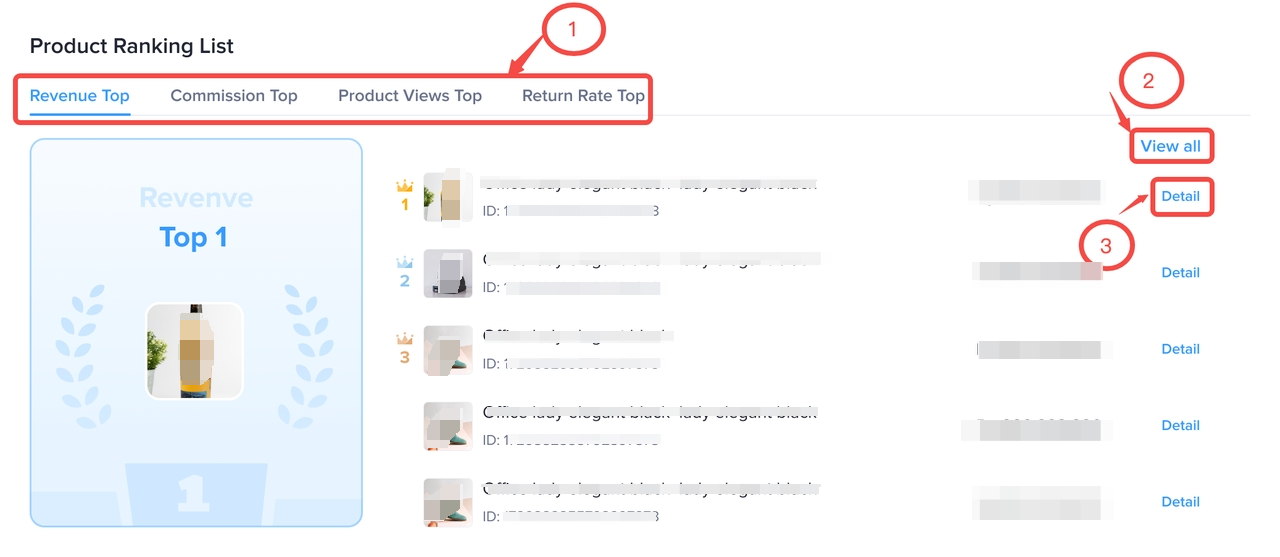
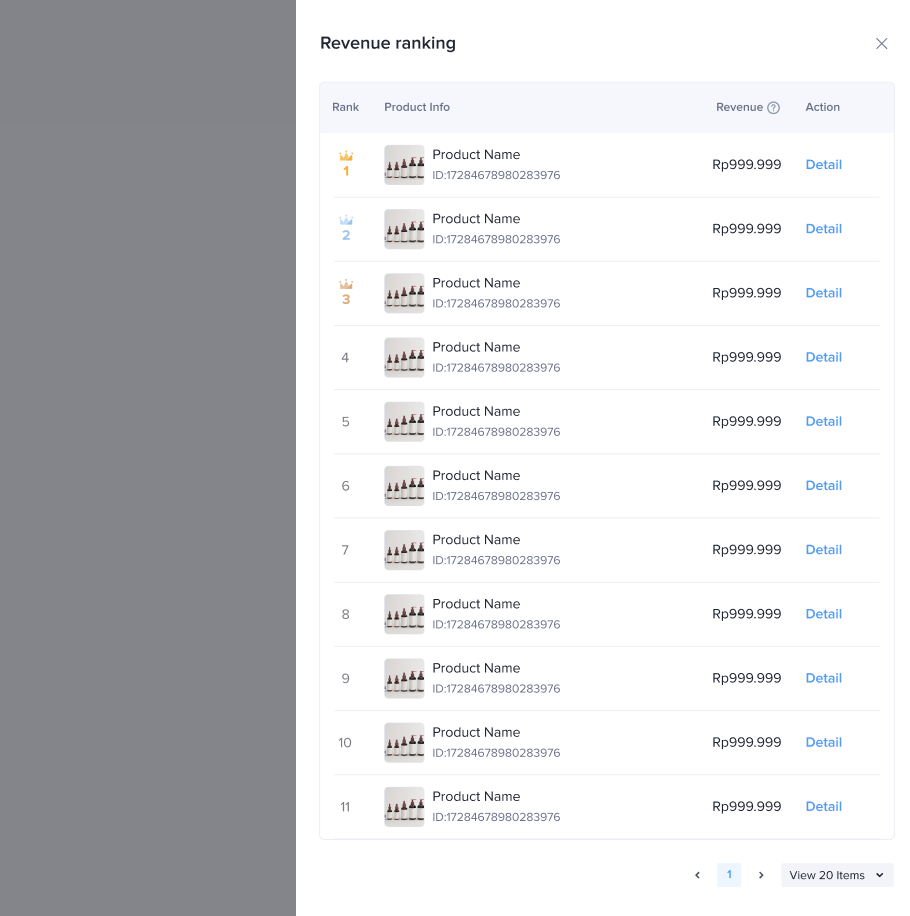
Product Ranking&Product List
Detail introduction | Product display (test account, virtual data, subject to product) Note: the numbers in the screenshots are for demonstration purpose, they do not represent actual or predicted results. |
Product RankingView your product performance based on different dimensions like Revenue, Commission, Product vides and refund rates.
|   |
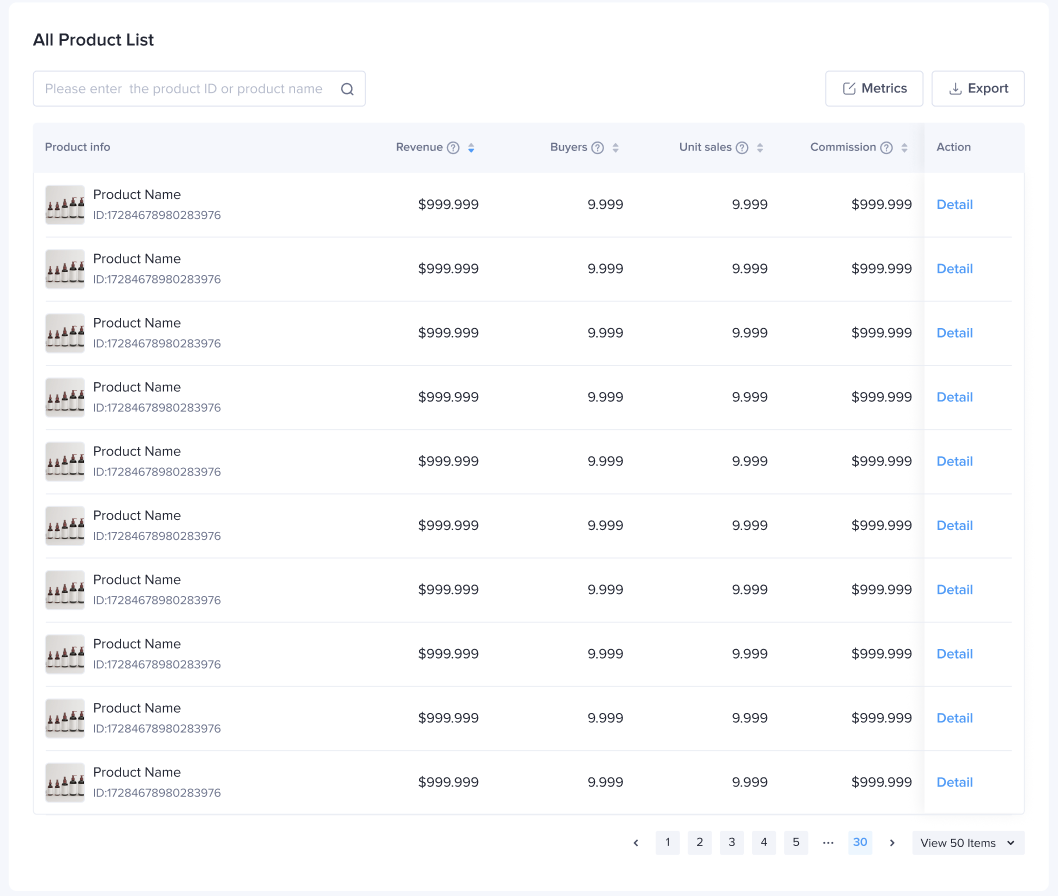
Product ListUnder the Product list, you can see all your products listed and search for specific products You can also view the performance based on 22 different metrics listed below.
|   |
Product Details
Detail introduction | Product display (test account, virtual data, subject to product) Note: the numbers in the screenshots are for demonstration purpose, they do not represent actual or predicted results. |
Product DetailHere you can see all the details about an individual product such as sales status, revenue/refund/traffic and quality indicators of different channels; | 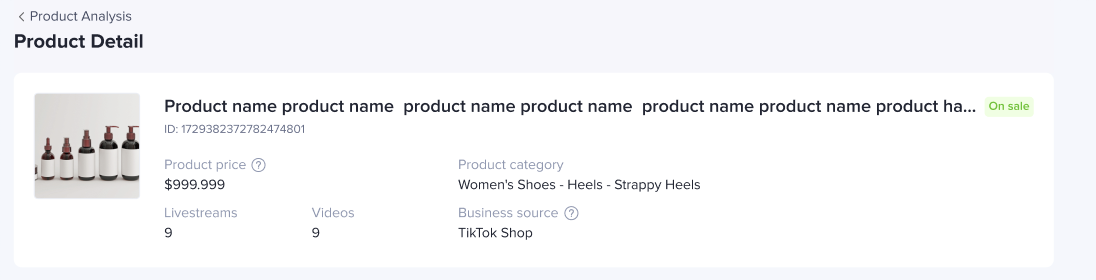 |
Product performanceHere you can see the details about revenue, refund and traffic performance of products according to all/livestream/video/ window channel:
| 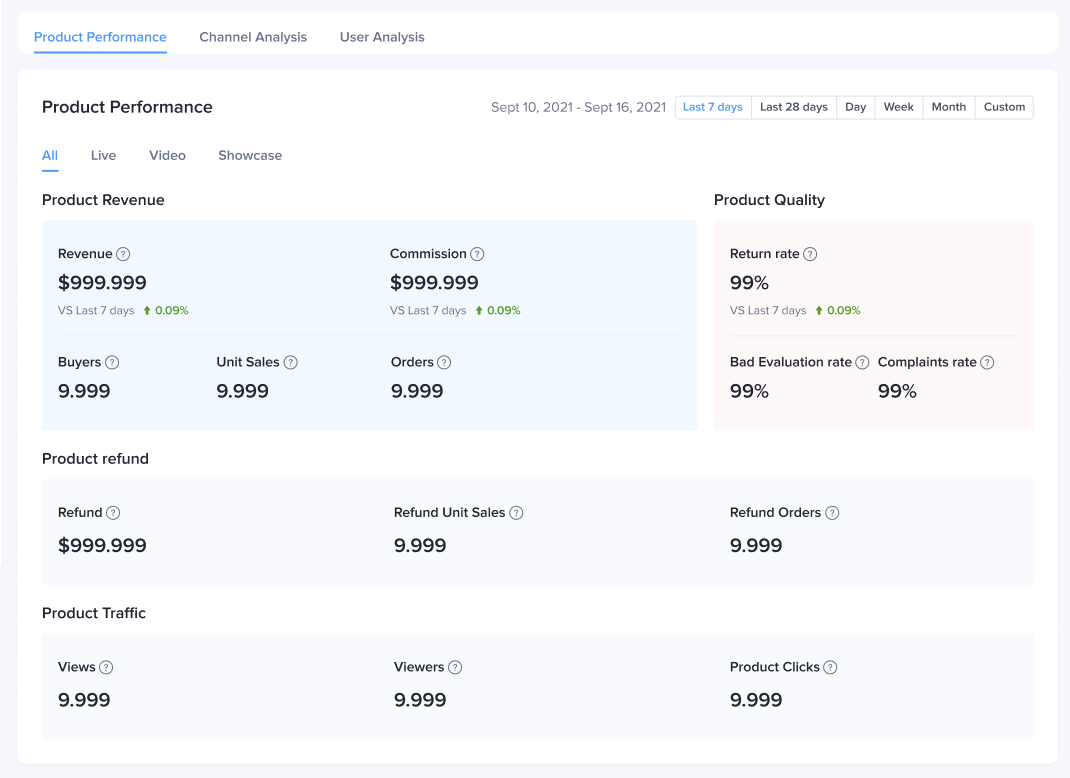 |
Revenue channel analysisView channels according to the revenue amount generated for each product.
| 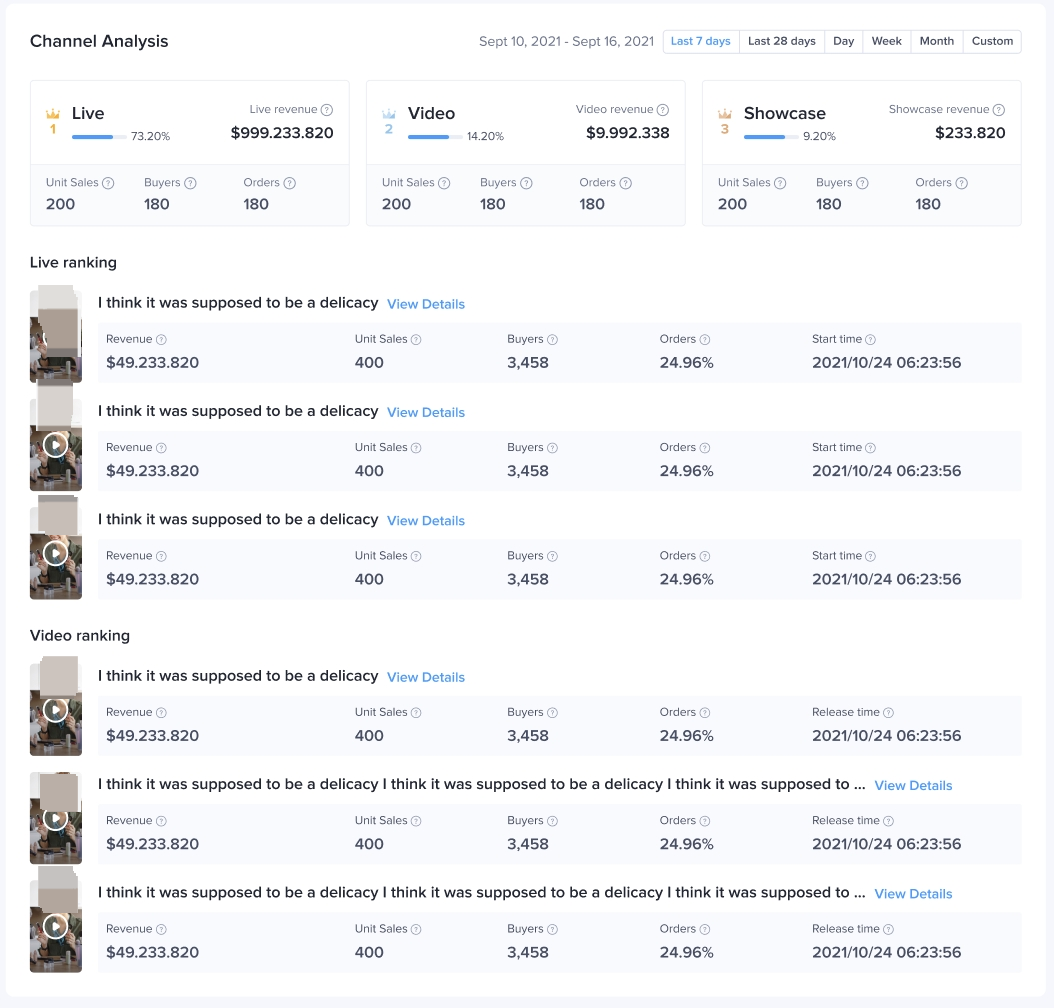 |
User AnalysisUser conversion analysisHere you can see the numbr of users and conversion rate for each stage of the conversion funnel including product view - click - revenue. You can also see this data by different channels:User trendsYou can see user trends for each channel type all/live/video/showcase and their activity for view/click/revenue stage.User profileYou can see the demographic data for each channel at every ptage of the conversion funnel You can also see a comparison of user profiles in different stages of view/click/revenue. | 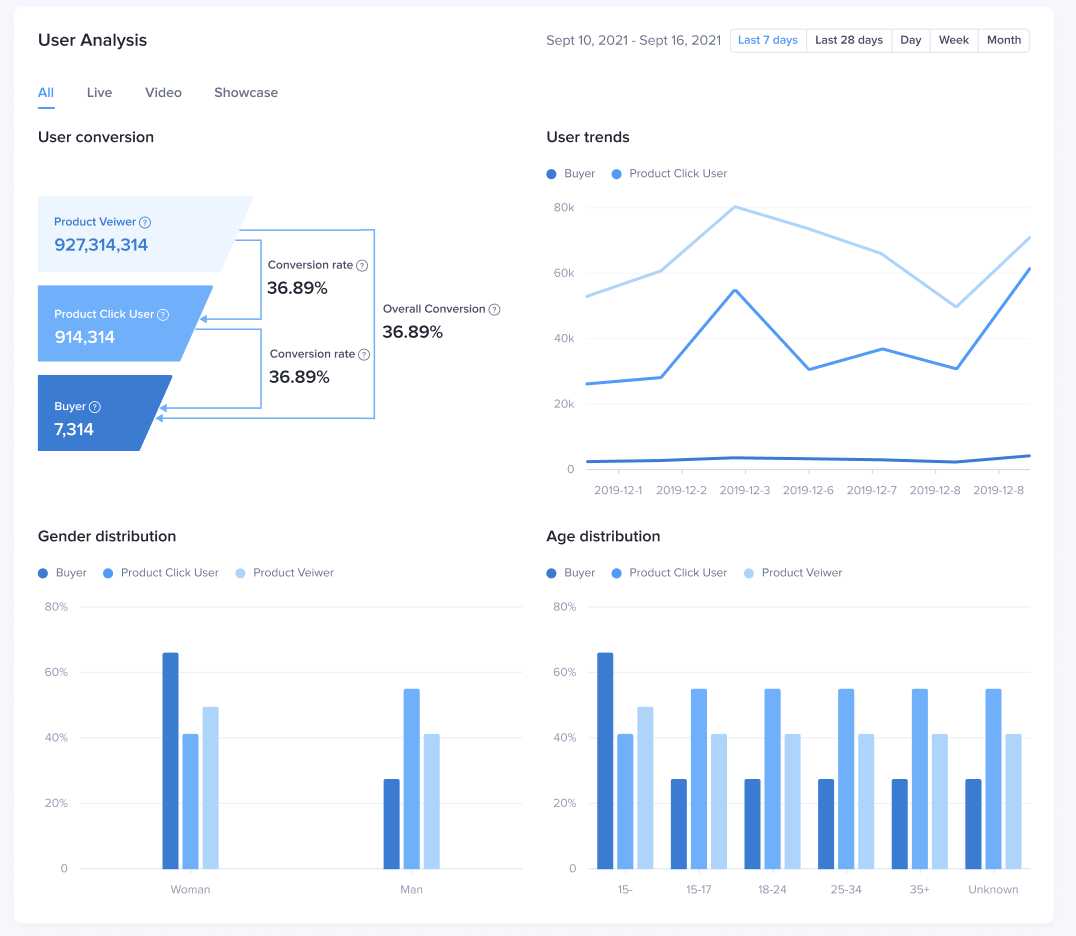 |
Q&A
Why is there no data for user profile module and UV indicators when choosing custom time range?
When selecting a custom time range, the user analysis module is not displayed. It is recommended to view the user analysis using a time period of last 7 days, last 28 days, day, week, and month.
- When selecting a custom time range, the UV indicators (number of users) are not displayed because they cannot be deduplicated. It is recommended to view the UV indicators using a time period of last 7 days, last 28 days, day, week, and month.

