How to Deep Dive with Sales Analytics
09/10/2025
Summary
What key features does the TikTok Shop Sales Analytics tool offer to help sellers understand their sales performance?
- It provides deep dive metrics like gross sales, shipping fees, tax, first-time buyers, and SKU orders, enabling sellers to analyze overall sales trends and contributions by content type and affiliate status.
- Sellers can identify top-performing content/channels and optimal times for LIVEs, videos, or product listings by analyzing orders by day and hour.
How can sellers use the Sales Analytics dashboard to monitor and improve their store's performance?
- Sellers can select custom time periods to compare key metrics (GMV, orders, AOV, refunds, etc.) against previous periods and track trends via metric cards.
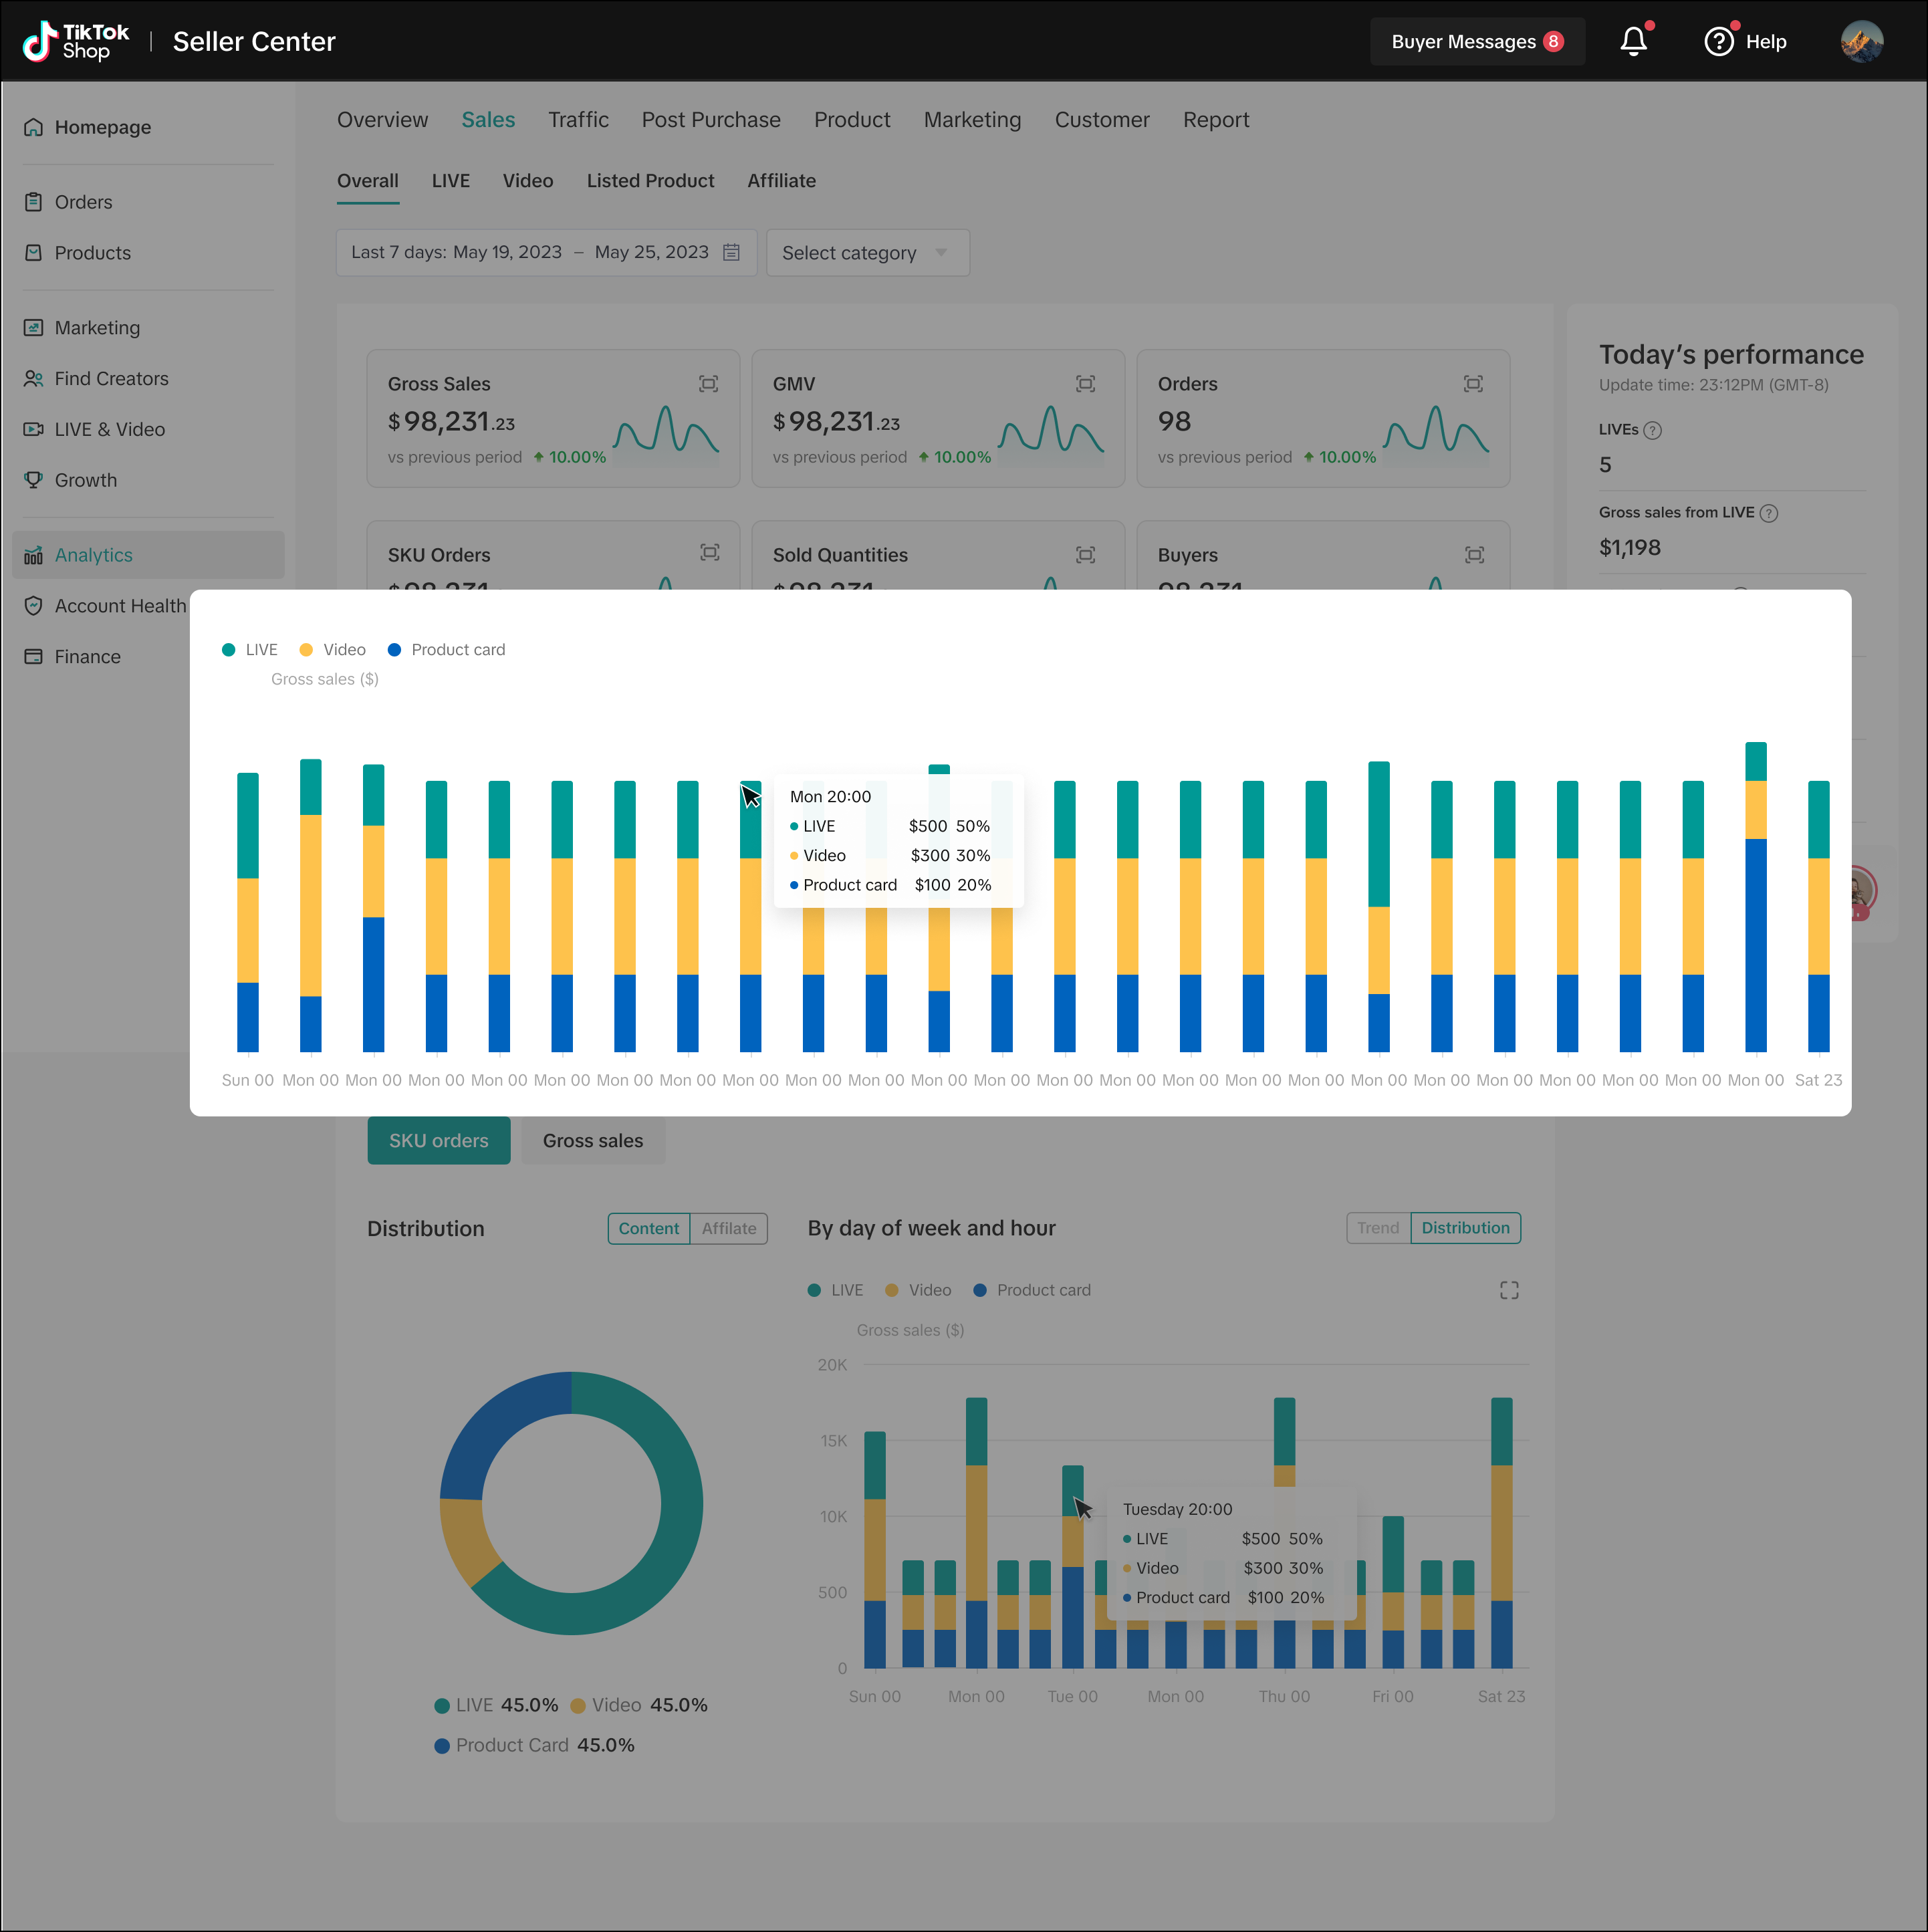
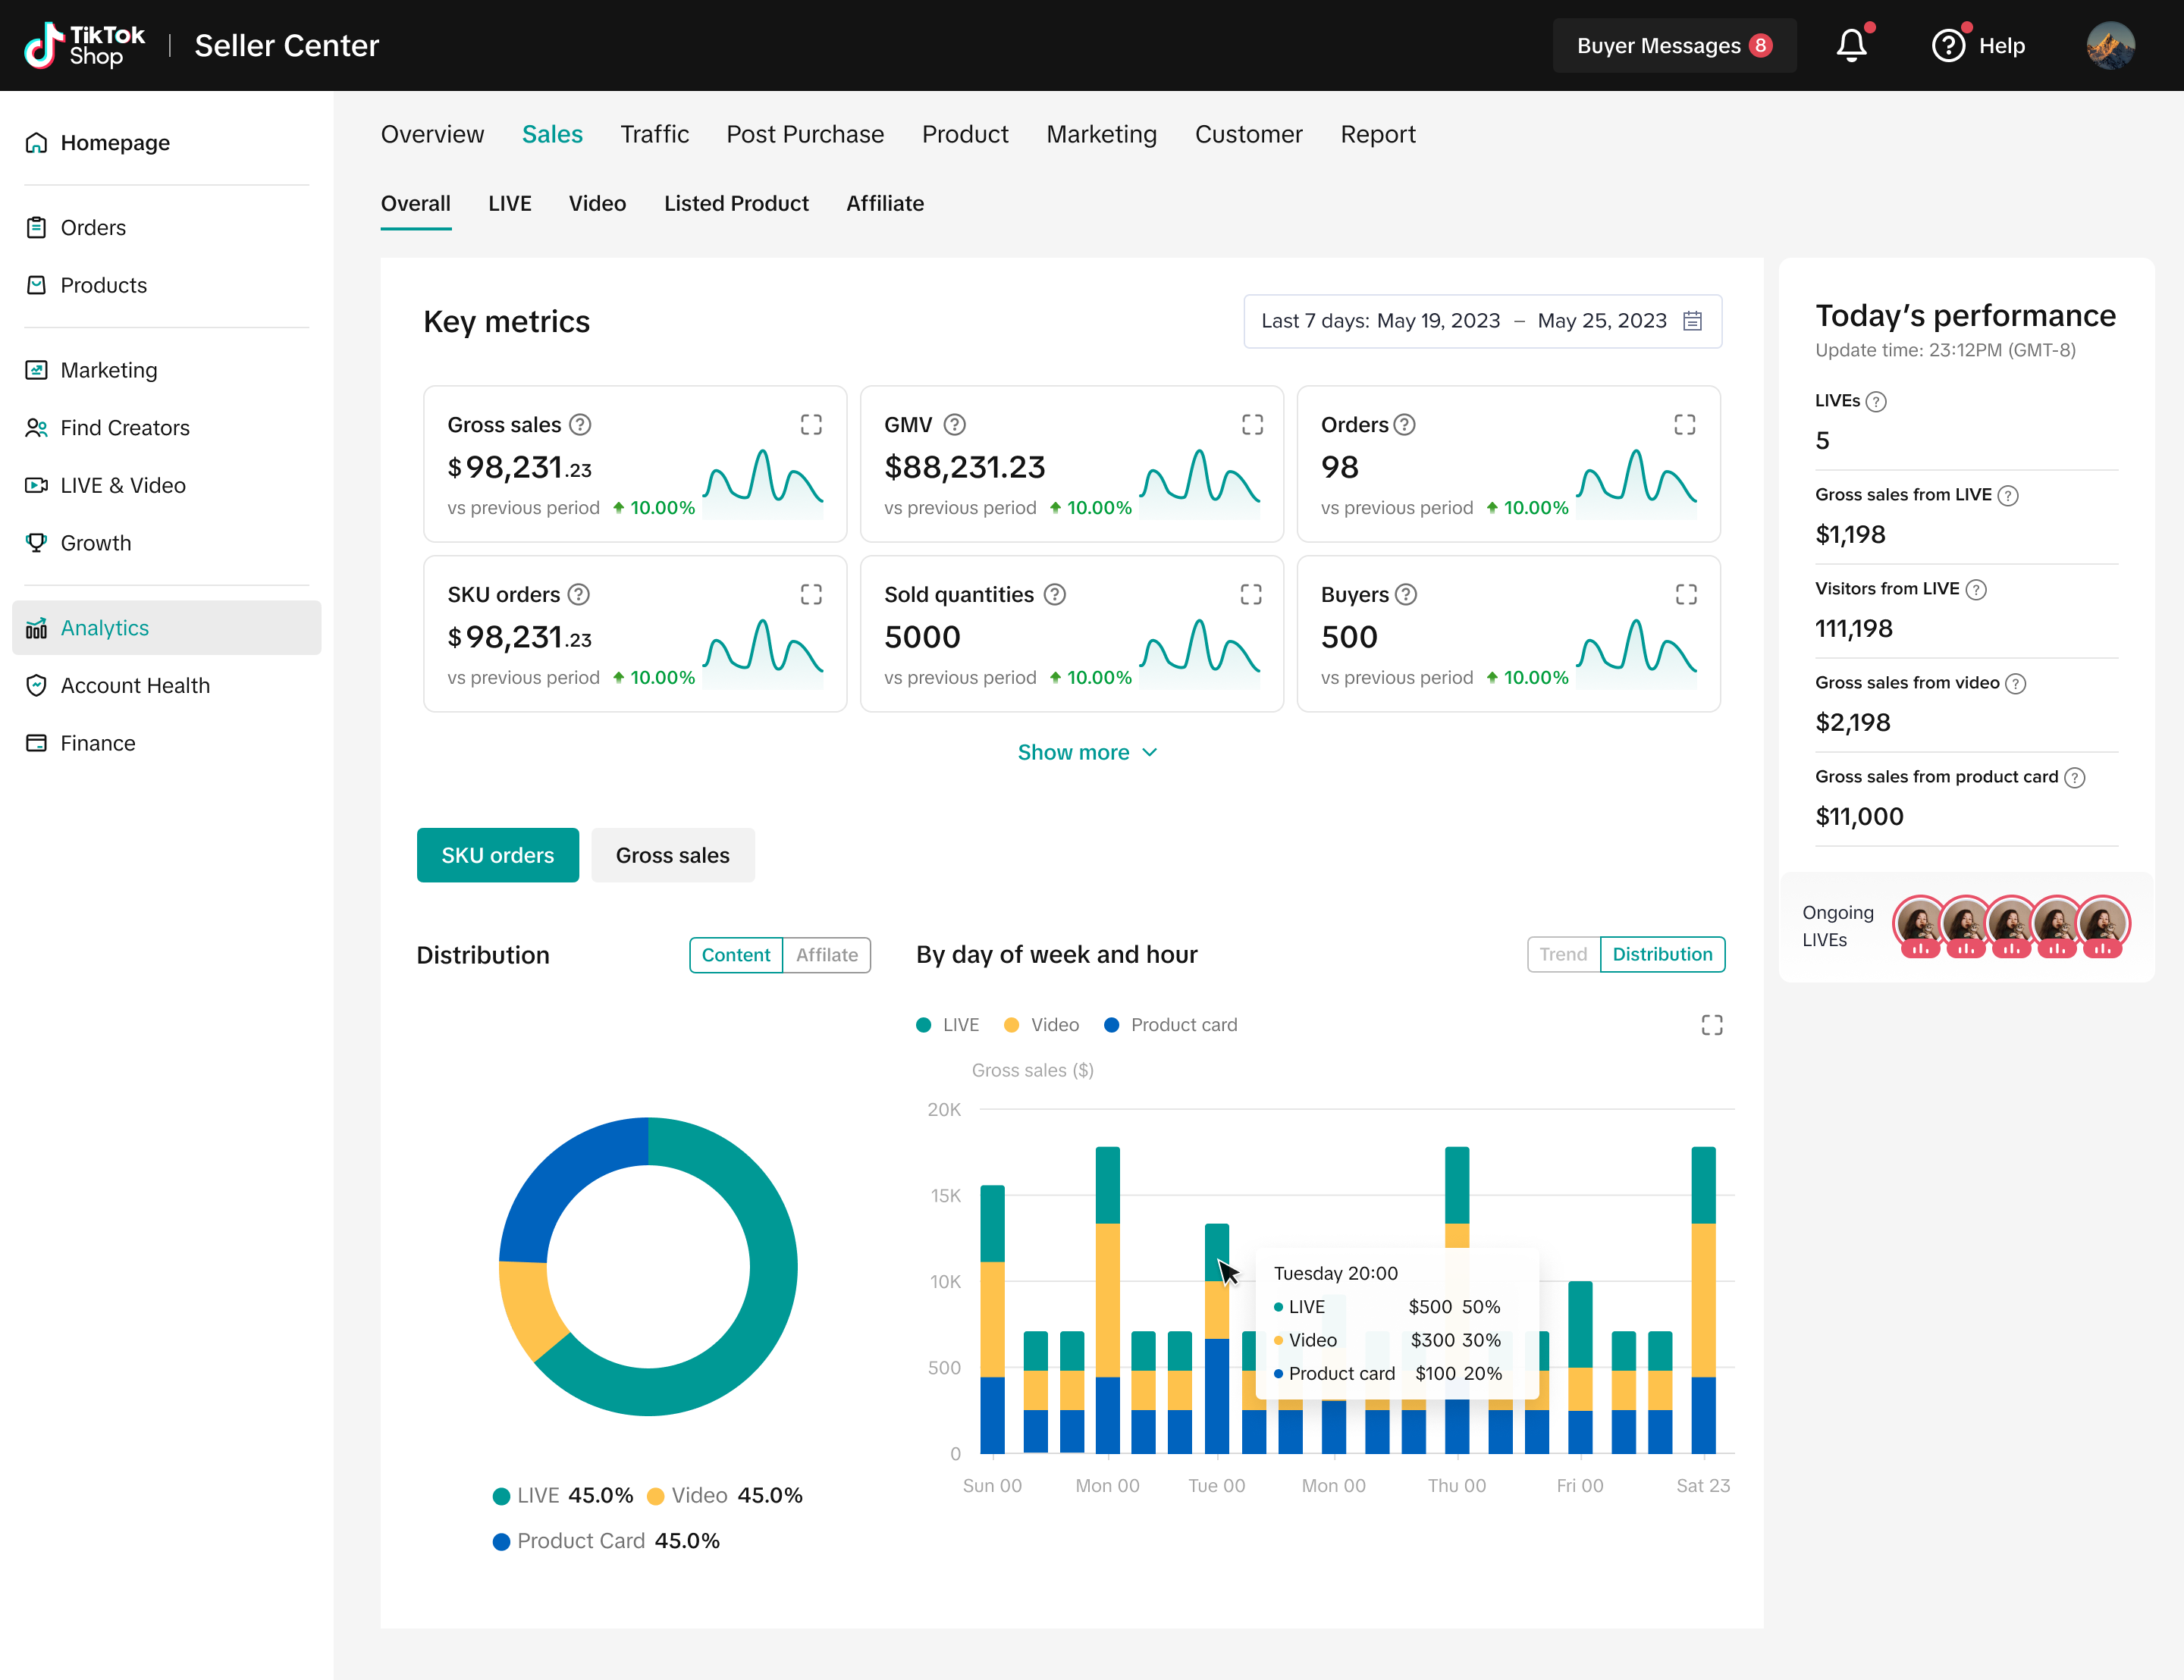
- The dashboard offers distribution analysis of SKU orders and sales by content type or affiliate status, helping identify channels causing sales fluctuations.
What insights can sellers gain from the LIVE/Video/Product Card tabs within the Sales Analytics tool?
- These tabs provide sales metrics and trends by traffic source and shop account, allowing sellers to pinpoint sales issues by genre or content type.
- Sellers can view detailed performance data for each video, product, or creator and identify the best times of week for buyer engagement.
How does the Sales Analytics tool support real-time monitoring of sales activities?
- The dashboard displays real-time GMV from LIVE, Video, and Product Card sales, alongside up to five ongoing LIVEs, enabling sellers to track live sales performance instantly.
- Tooltips with definitions help sellers understand metrics clearly for better decision-making.
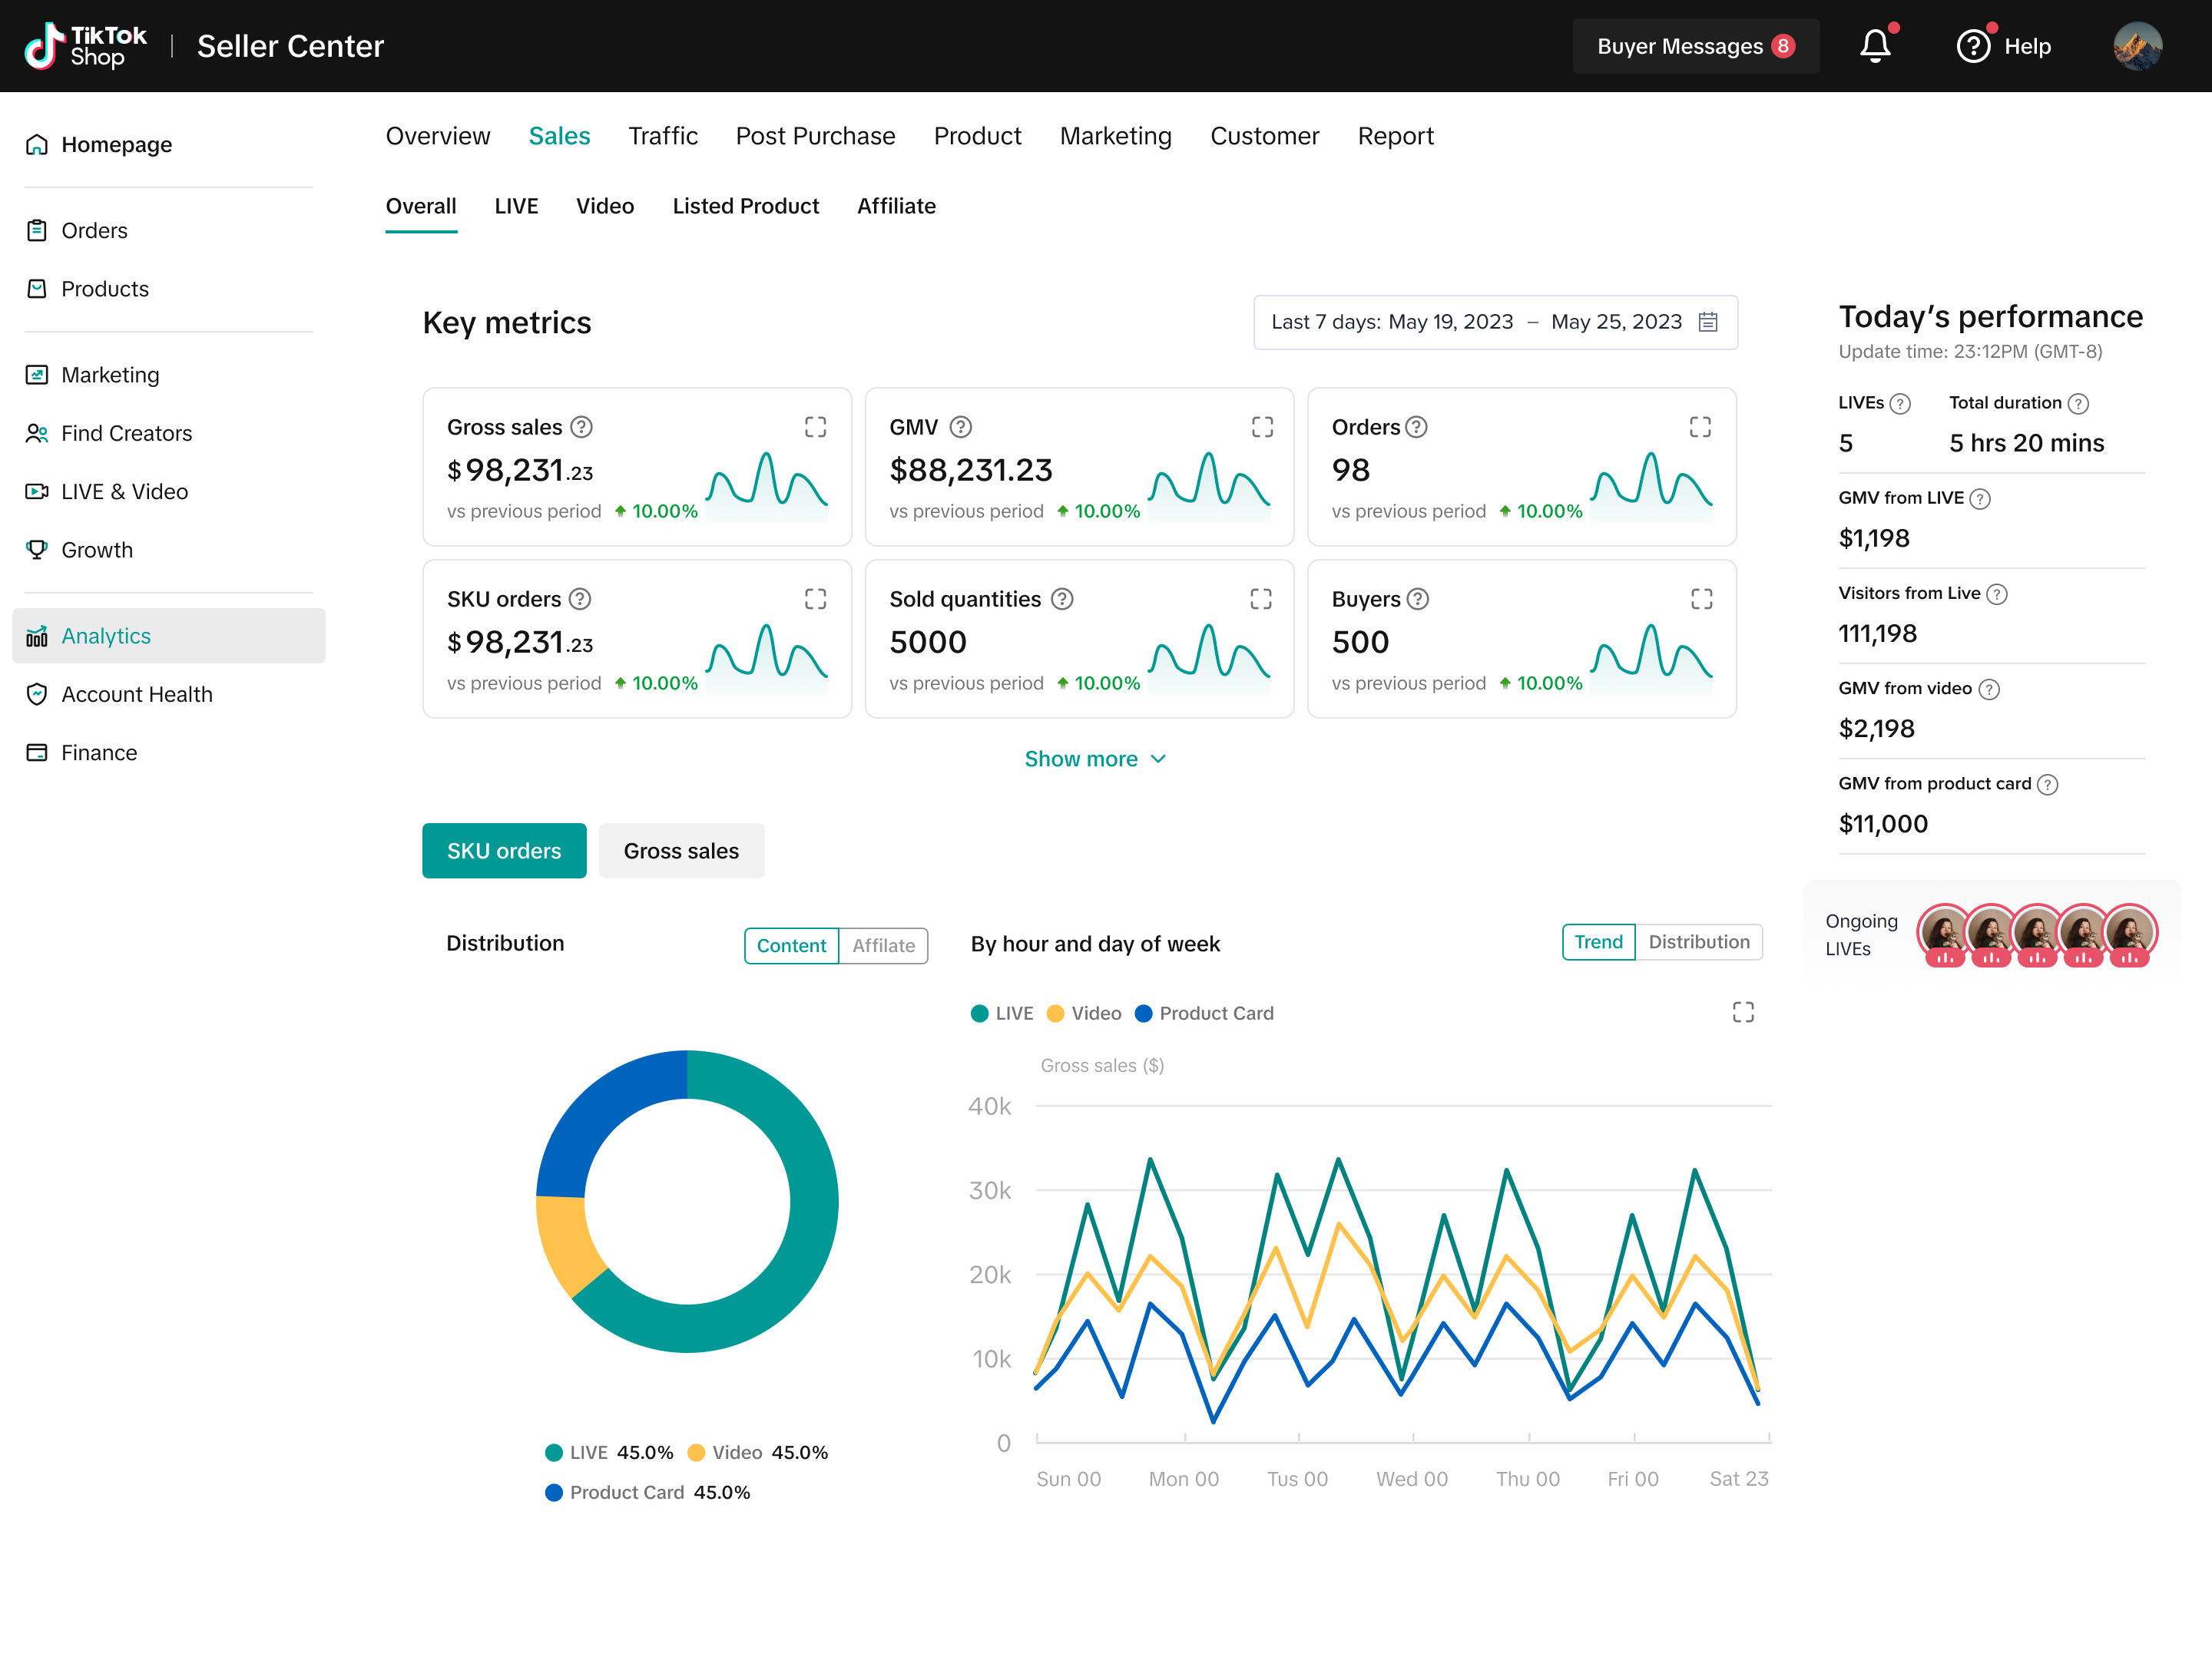
Dive deeper and grow your store with our Sales Analytics tool to help you understand better latest trends, contributions and sales performance LIVE, video and product cards.
The Sales performance tab is under Data Analytics -> Growth & insights module. Under this tab you can:
Check your overall sales performance with deep dive metrics and analyze the trends and contributions
View the sales performance of LIVE/Video/Product Cards and conduct analysis by multiple dimensions
How to use the Sales Analytics dashboard
- Aggregate sales performance and trends:
- Select the time period that you want to check, and then you will see the Key metrics of sales vs. the previous period, including Gross sales, GMV, Orders, SKU orders, Sold quantities, Buyers, First time buyers, AOV, Refunds, Shipping fee, and Tax.
- Check the metric cards to see the trends.
- Distributions of SKU orders and sales:
- Today's performance
Hover on the "?" icon to see the definitions.