Campaign Performance
05/07/2024
Summary
What is the purpose of the new Data Compass tool on TikTok Shop?
- The Data Compass provides clearer data and insights into how campaigns impact transactions, traffic, and product performance.
- It offers features like a year-round campaign calendar, single campaign analysis, and easy generation of campaign performance reports.
How can sellers use campaign analysis to improve their store performance?
- Monitor promotion targets and compare sales and traffic during campaigns with daily performance.
- Analyze top-performing products to focus on high-revenue items and adjust strategies for products with high traffic but low conversion.
What are the key features of the campaign analysis tool?
- Features include a campaign calendar, single campaign analysis, comparison of campaign vs. non-campaign periods, and customizable campaign reports.
- Sellers can track core indicators like transaction amount, conversion rate, and product exposure.
How can sellers customize their campaign reports?
- After a campaign ends, sellers can select main and secondary indicators to include in their reports, such as GMV growth rate and order growth rate.
- These reports can be used for internal motivation, results reporting, and marketing communications.
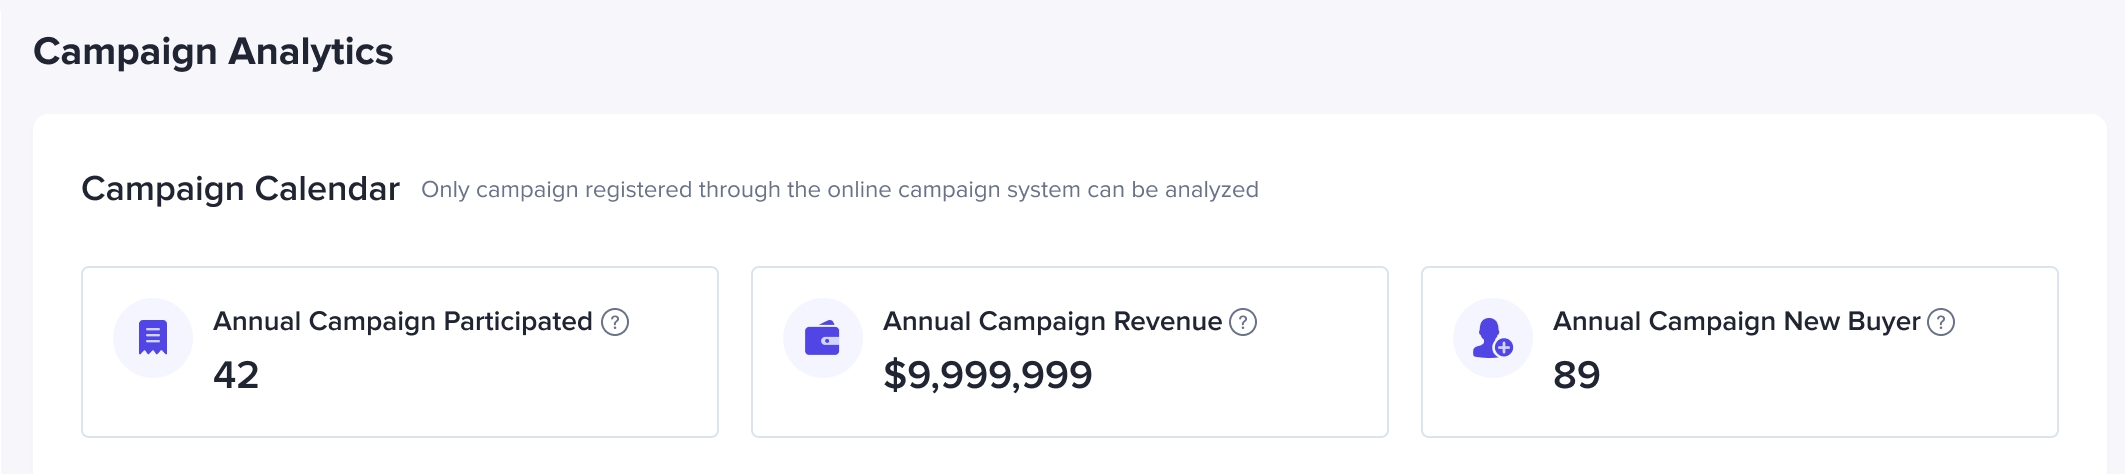
What insights can sellers gain from reviewing their annual promotion performance?
- Sellers can access a one-page overview of annual promotion performance, showing cumulative sales and activities participated in.
- Detailed indicators include transaction amounts, conversion rates, product rankings, and new customer acquisition.
❓Want to know the impact of your participation in a platform promotion and how much growth it added to your daily sales and traffic?❓
❓Want to review store performance for the full year and analyze growth during specific initiatives?❓
❓Want to share your store’s promotion performance with one click?❓
Our new Data Compass provides clearer data and a more comprehensive perspective on how your campaigns are impacting transactions, traffic, and product performance! This enhanced analysis offers:- A year-round campaign calendar — Review your campaign sales performance history anytime
- Single campaign analysis — Gain insight into big sales, traffic, and product performance
- Campaign reports — Generate a store-specific campaign performance report with a click
1. How can campaign analysis help me?
🔥Annual campaign calendar
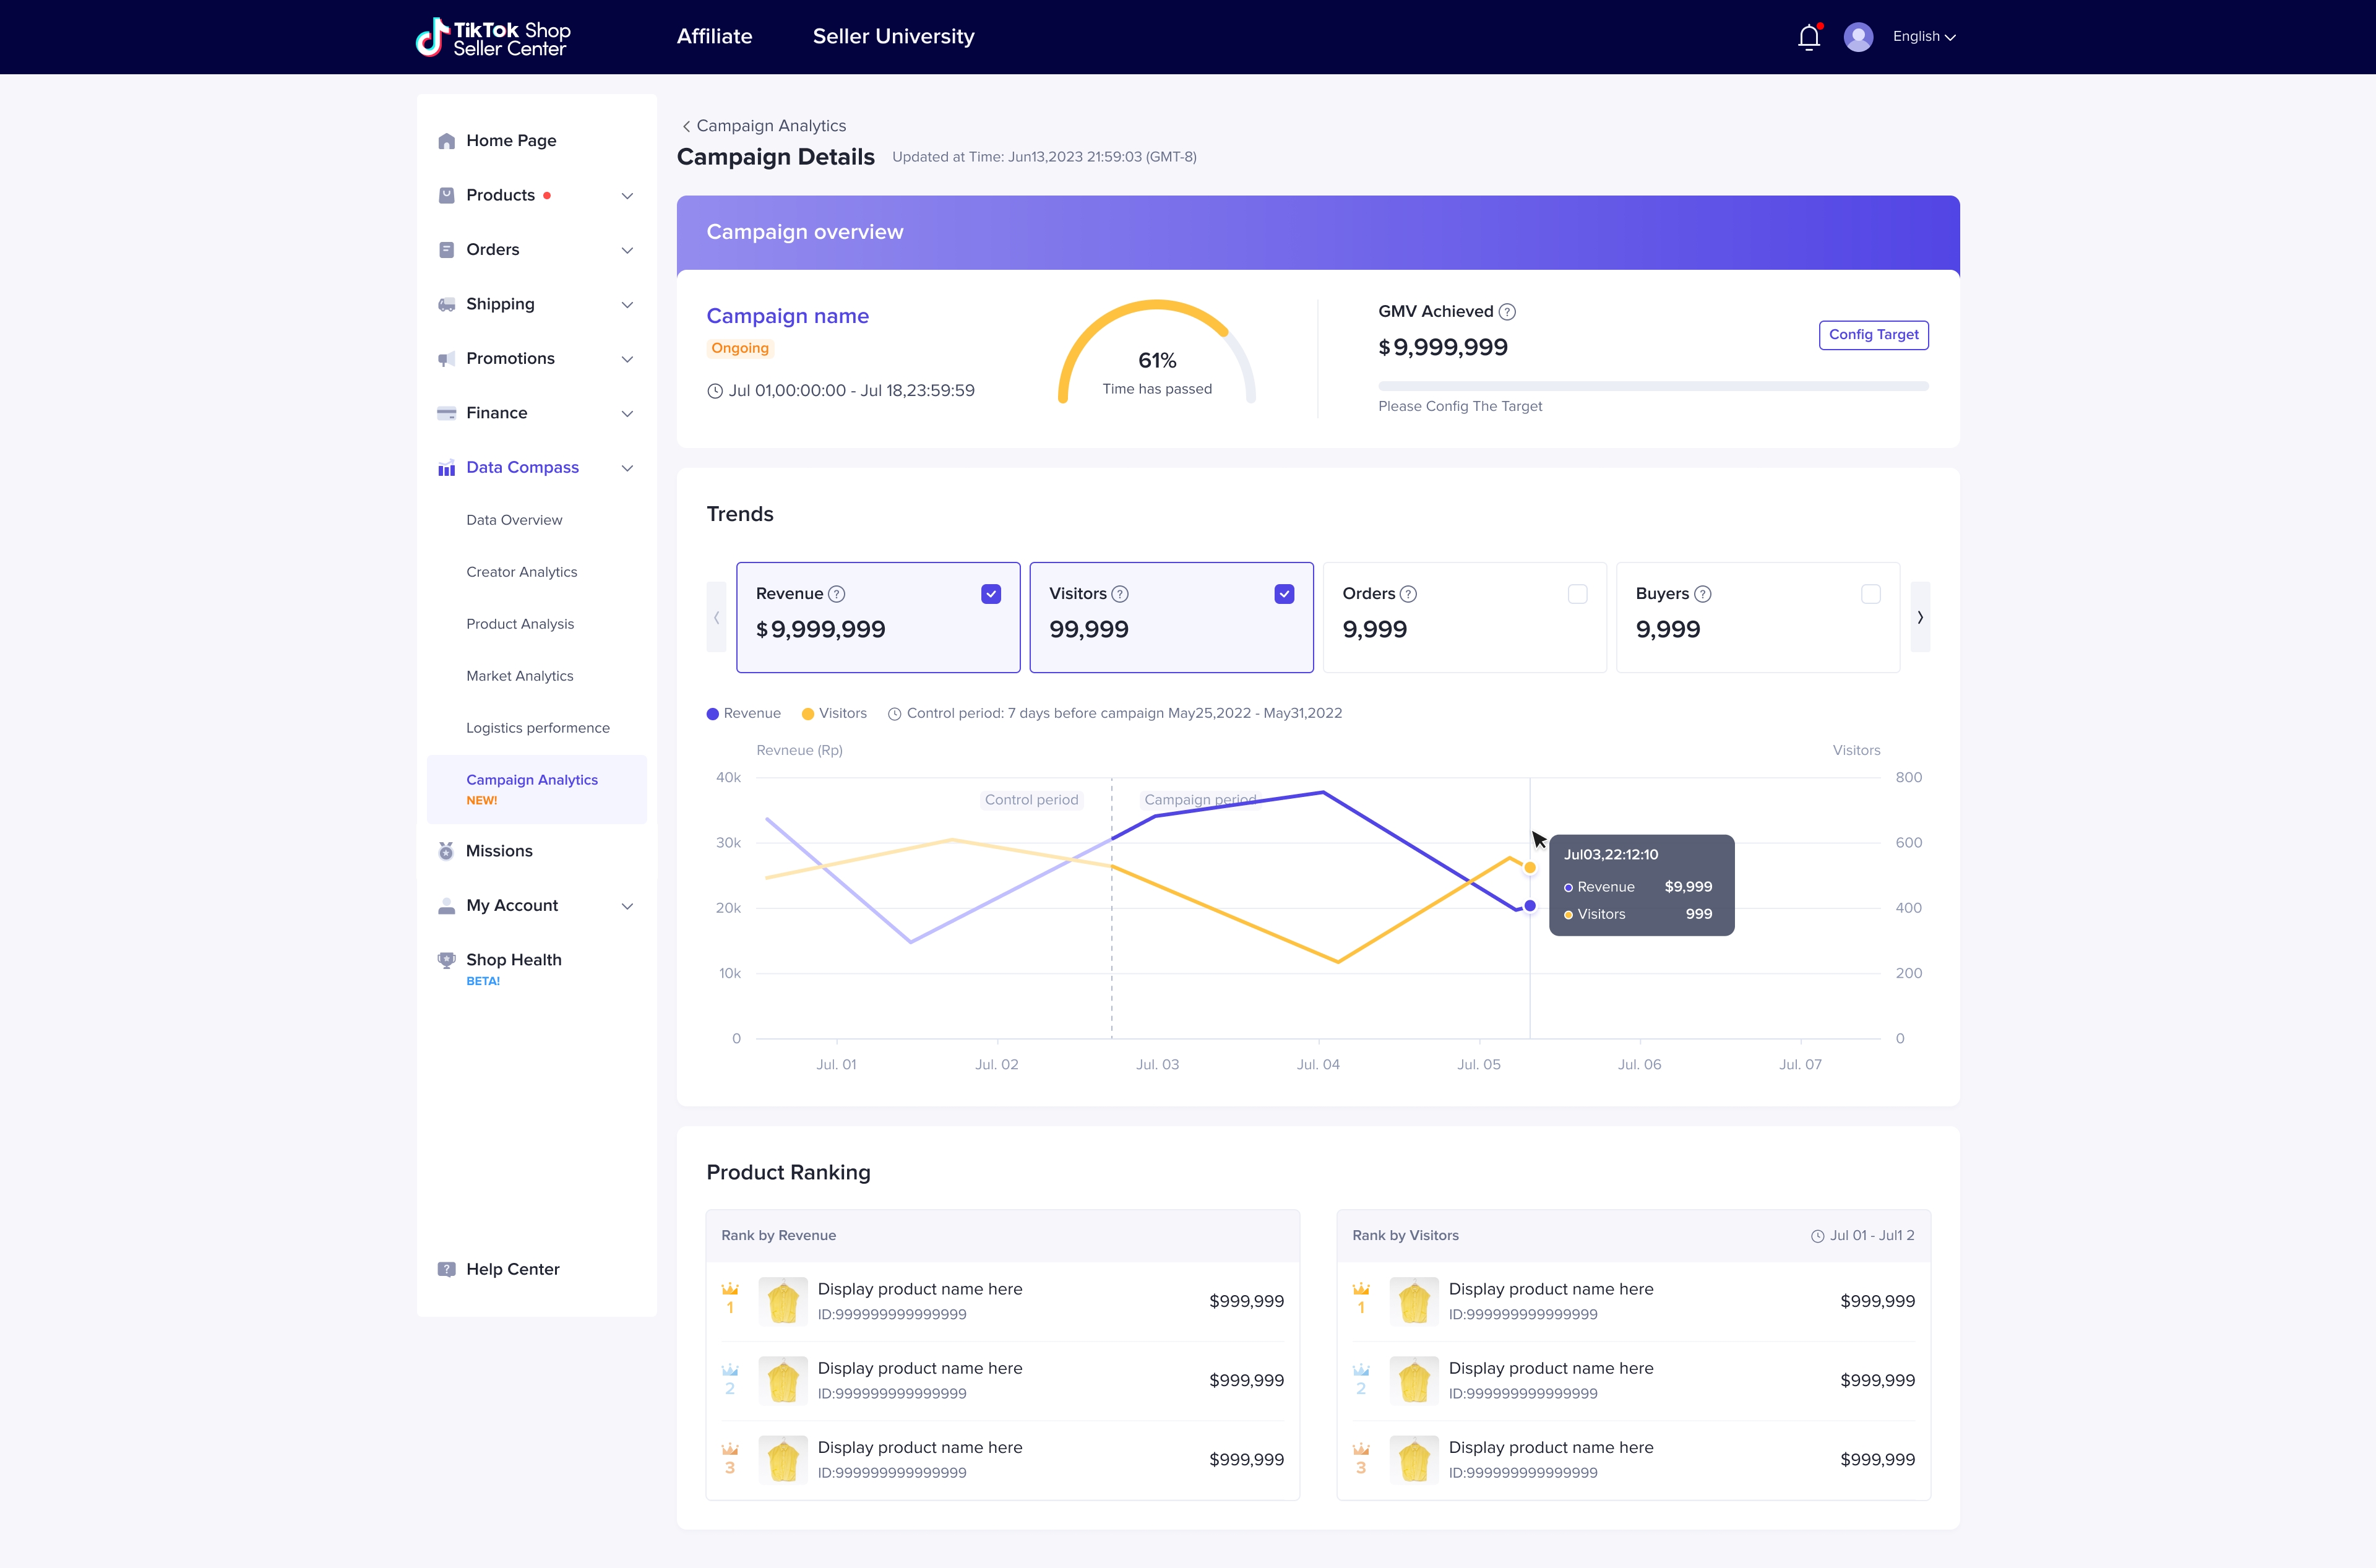
Better understand how your campaigns affect your store's annual cumulative transaction performance.🔥Single campaign analysisMonitor a campaign in real time and, once it ends, review how well it achieved its goals, including analysis of revenue and traffic performance.
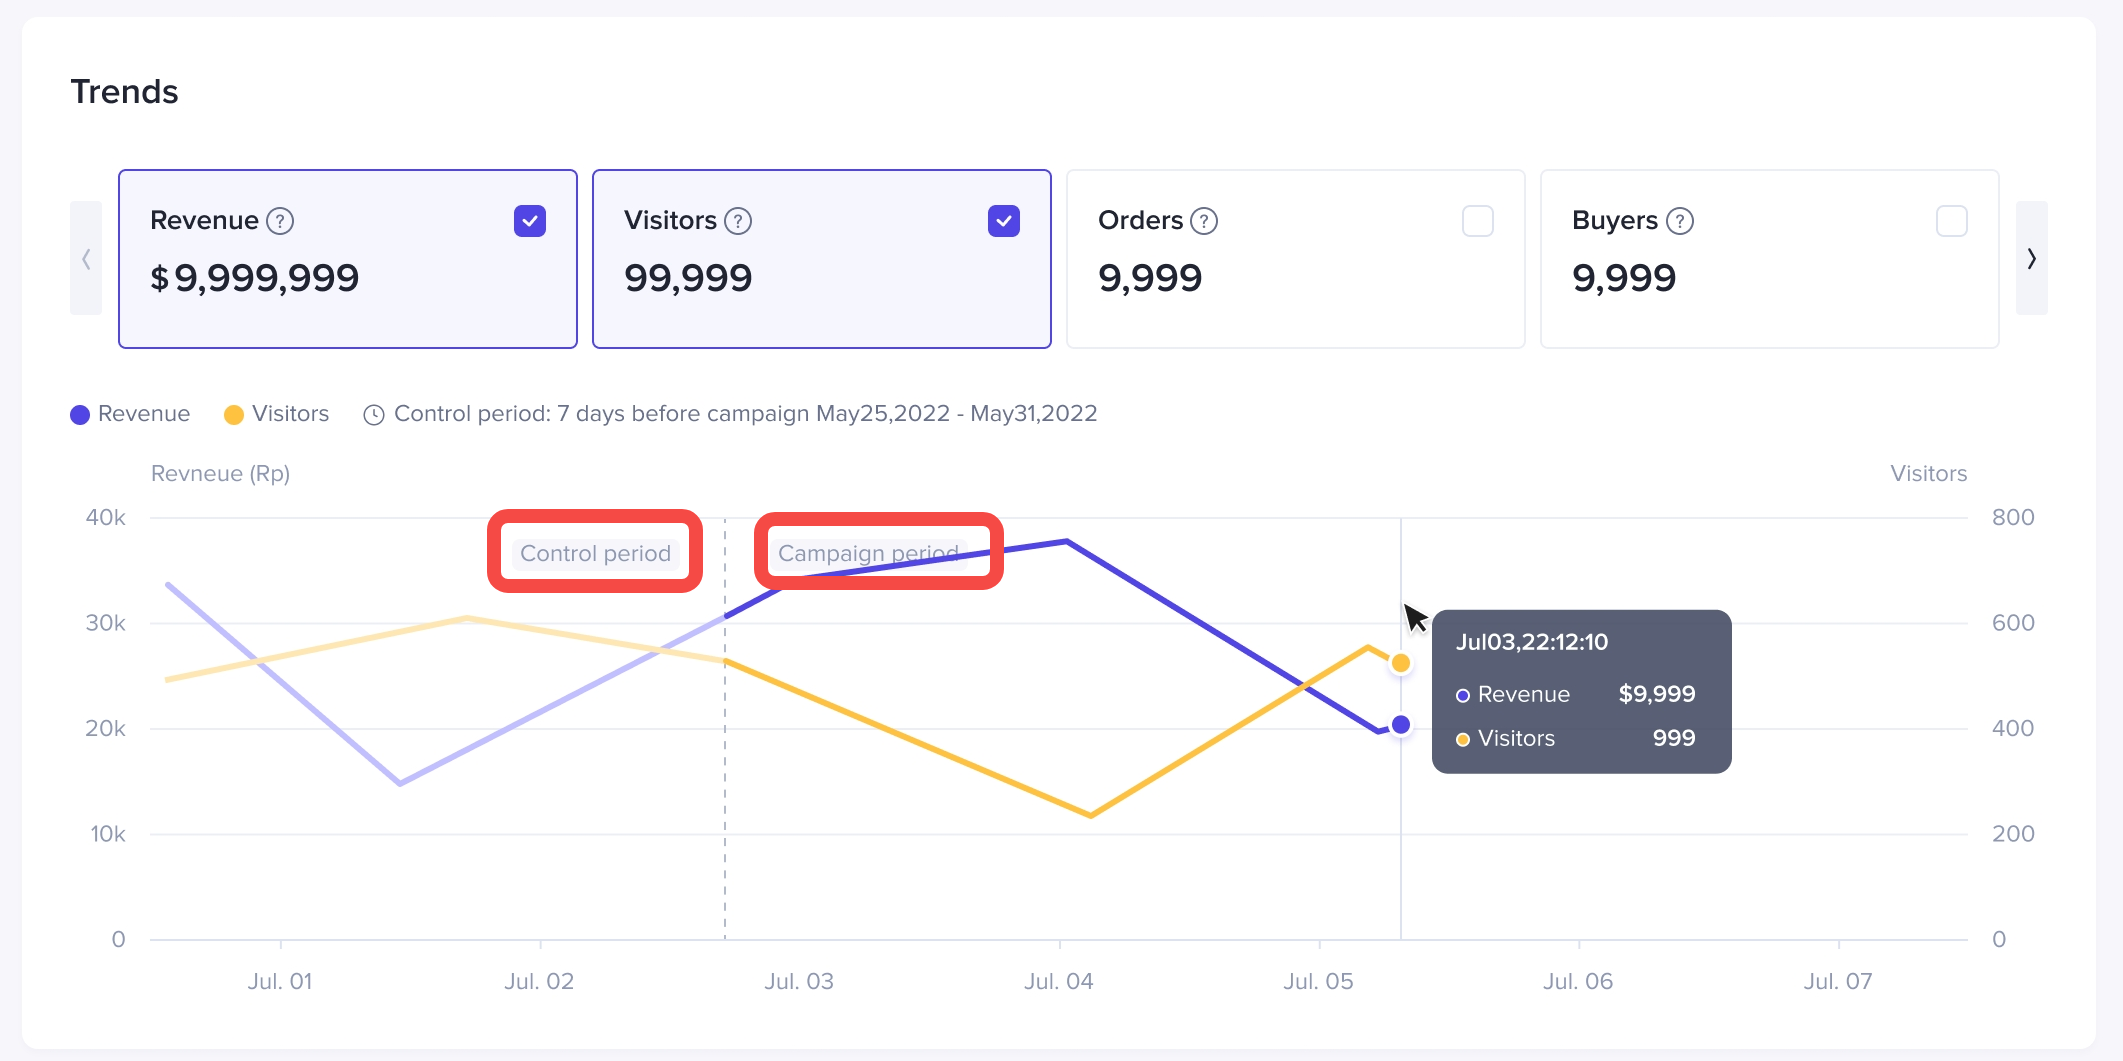
🔥Comparison of non-campaign and campaign periods
Explore the improvement in store sales levels spurred by your campaigns.🔥Hot products
Find out which of your products brought in the most revenue and traffic during your campaigns.🔥Campaign report
Once a campaign ends, generate your store’s own campaign report for easy marketing communication by customizing the indicators.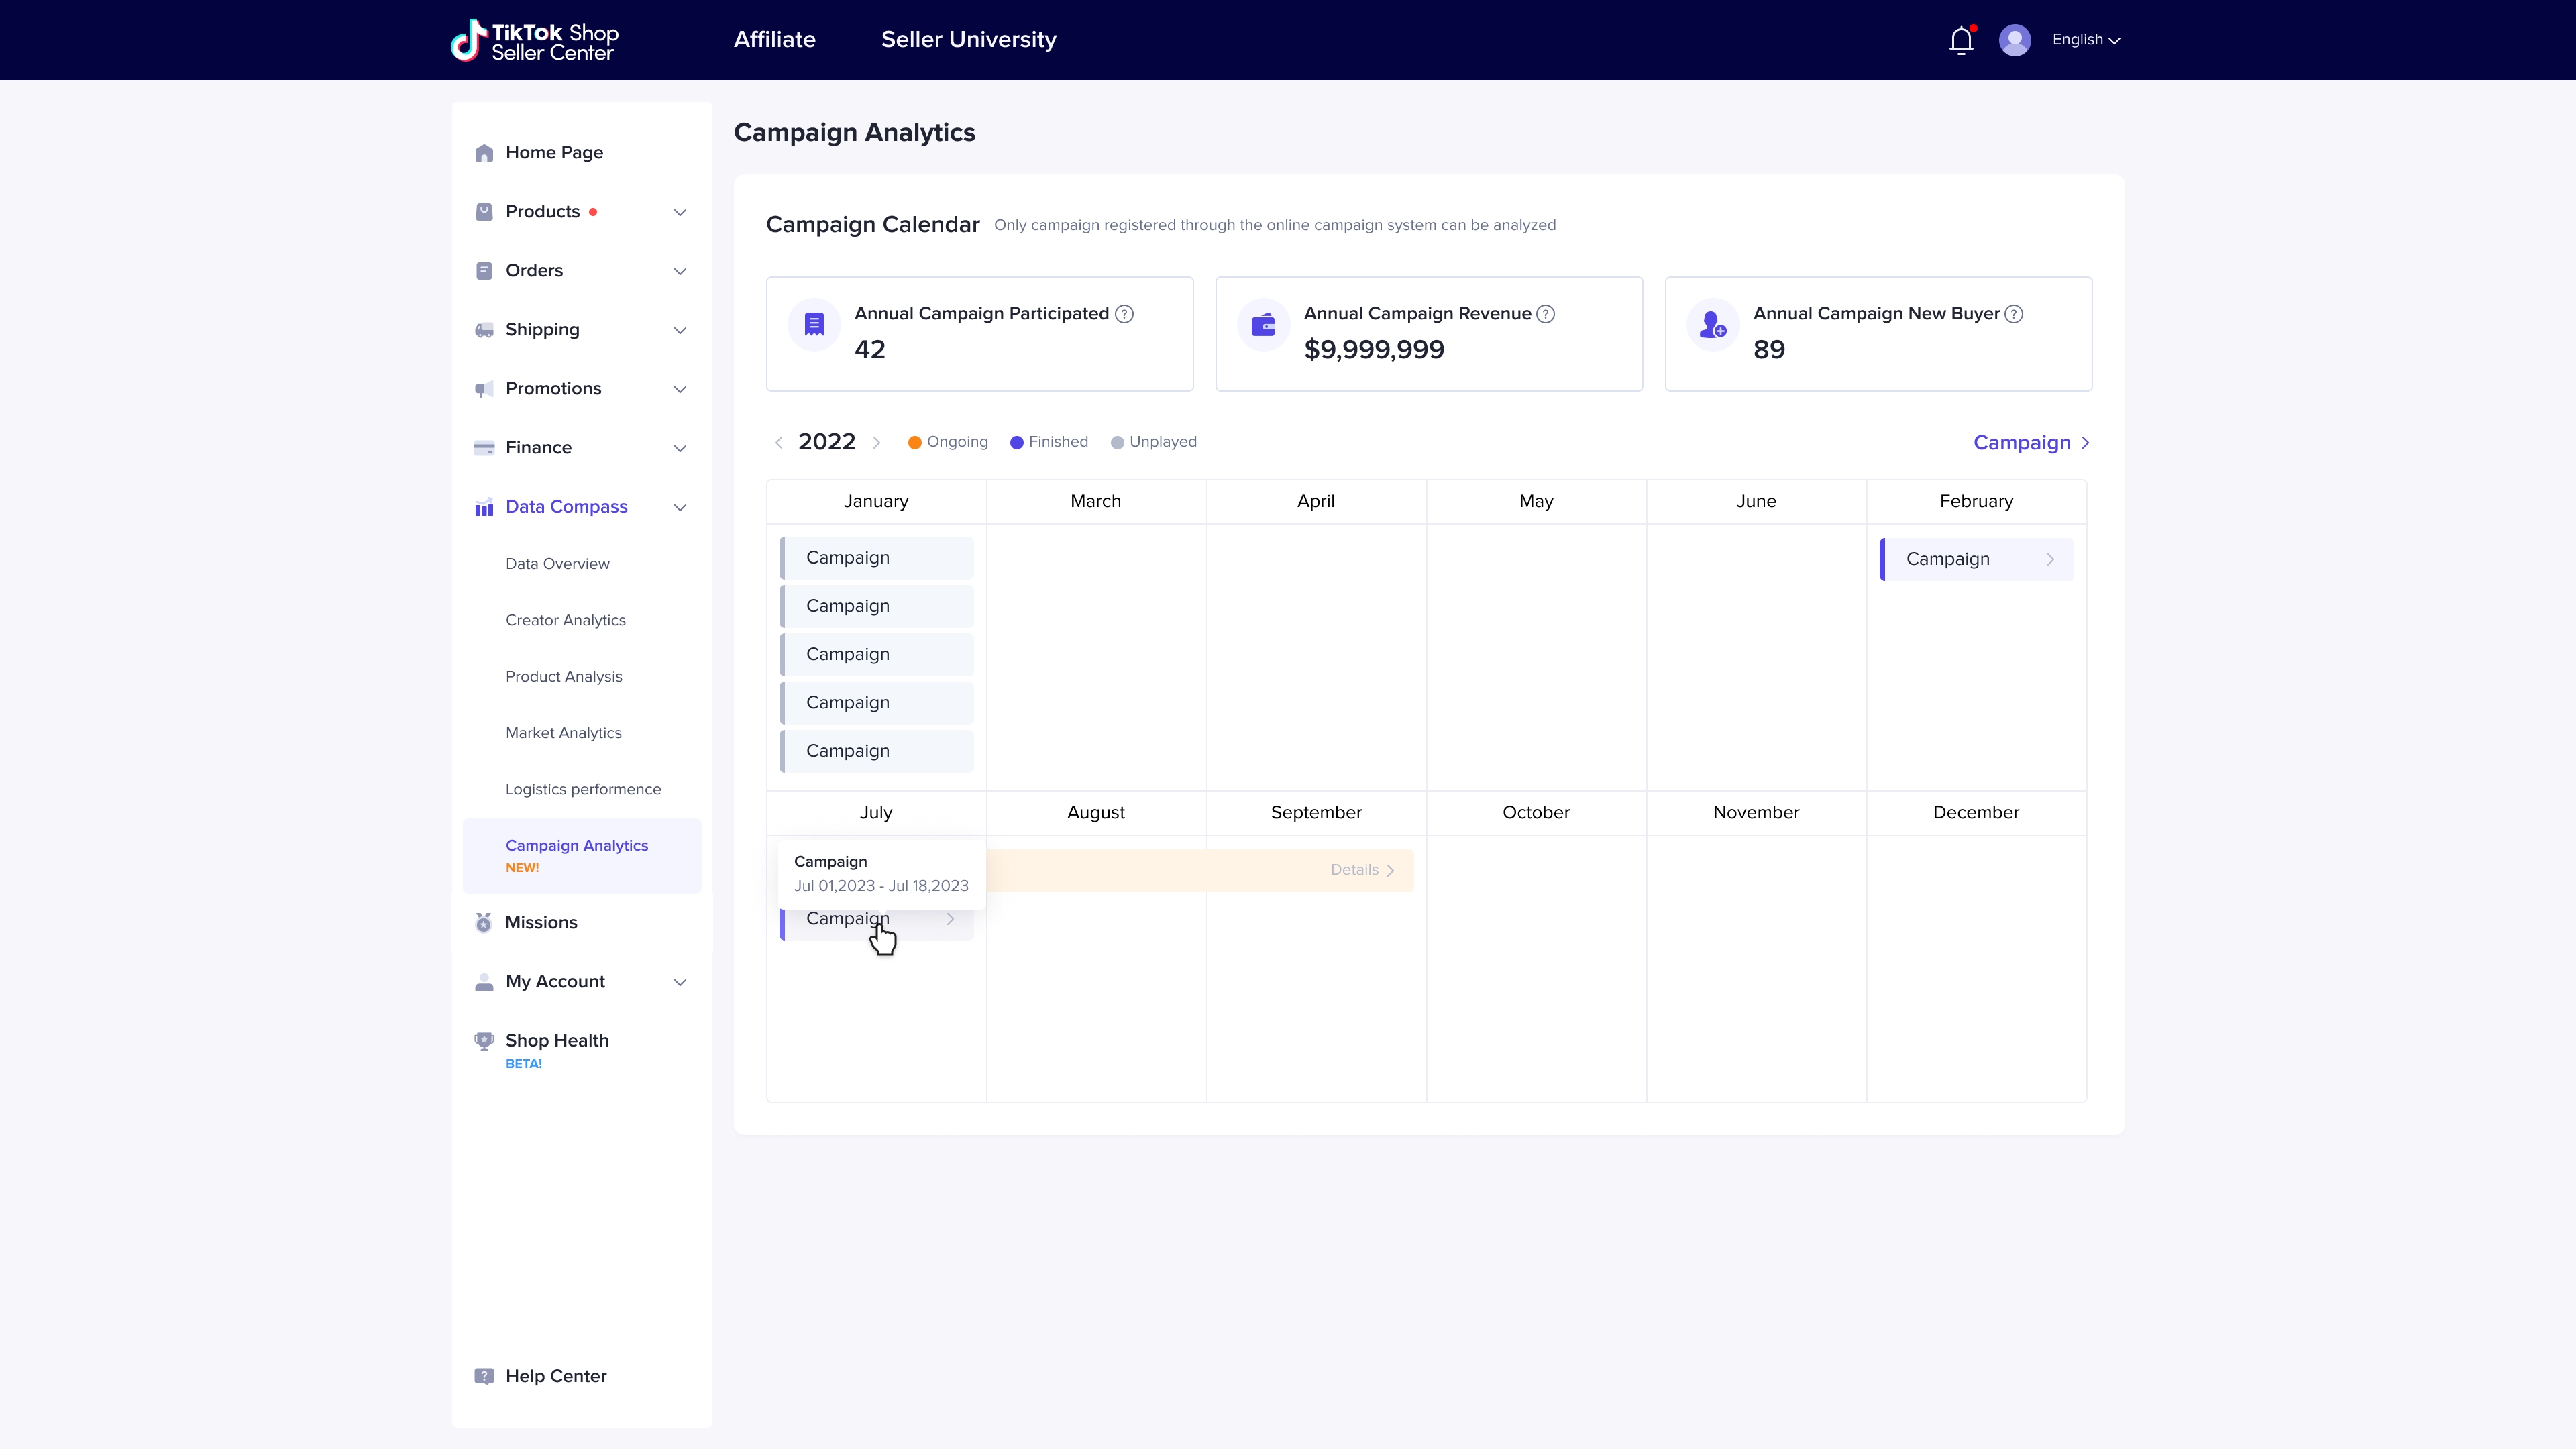

2. How to use your campaign analysis
🌟🌟 Monitor your promotion target
After setting the GMV target you hope to achieve during your campaign, you can check your cumulative GMV and see the performance at a glance on the Promotion Analytics page at any time.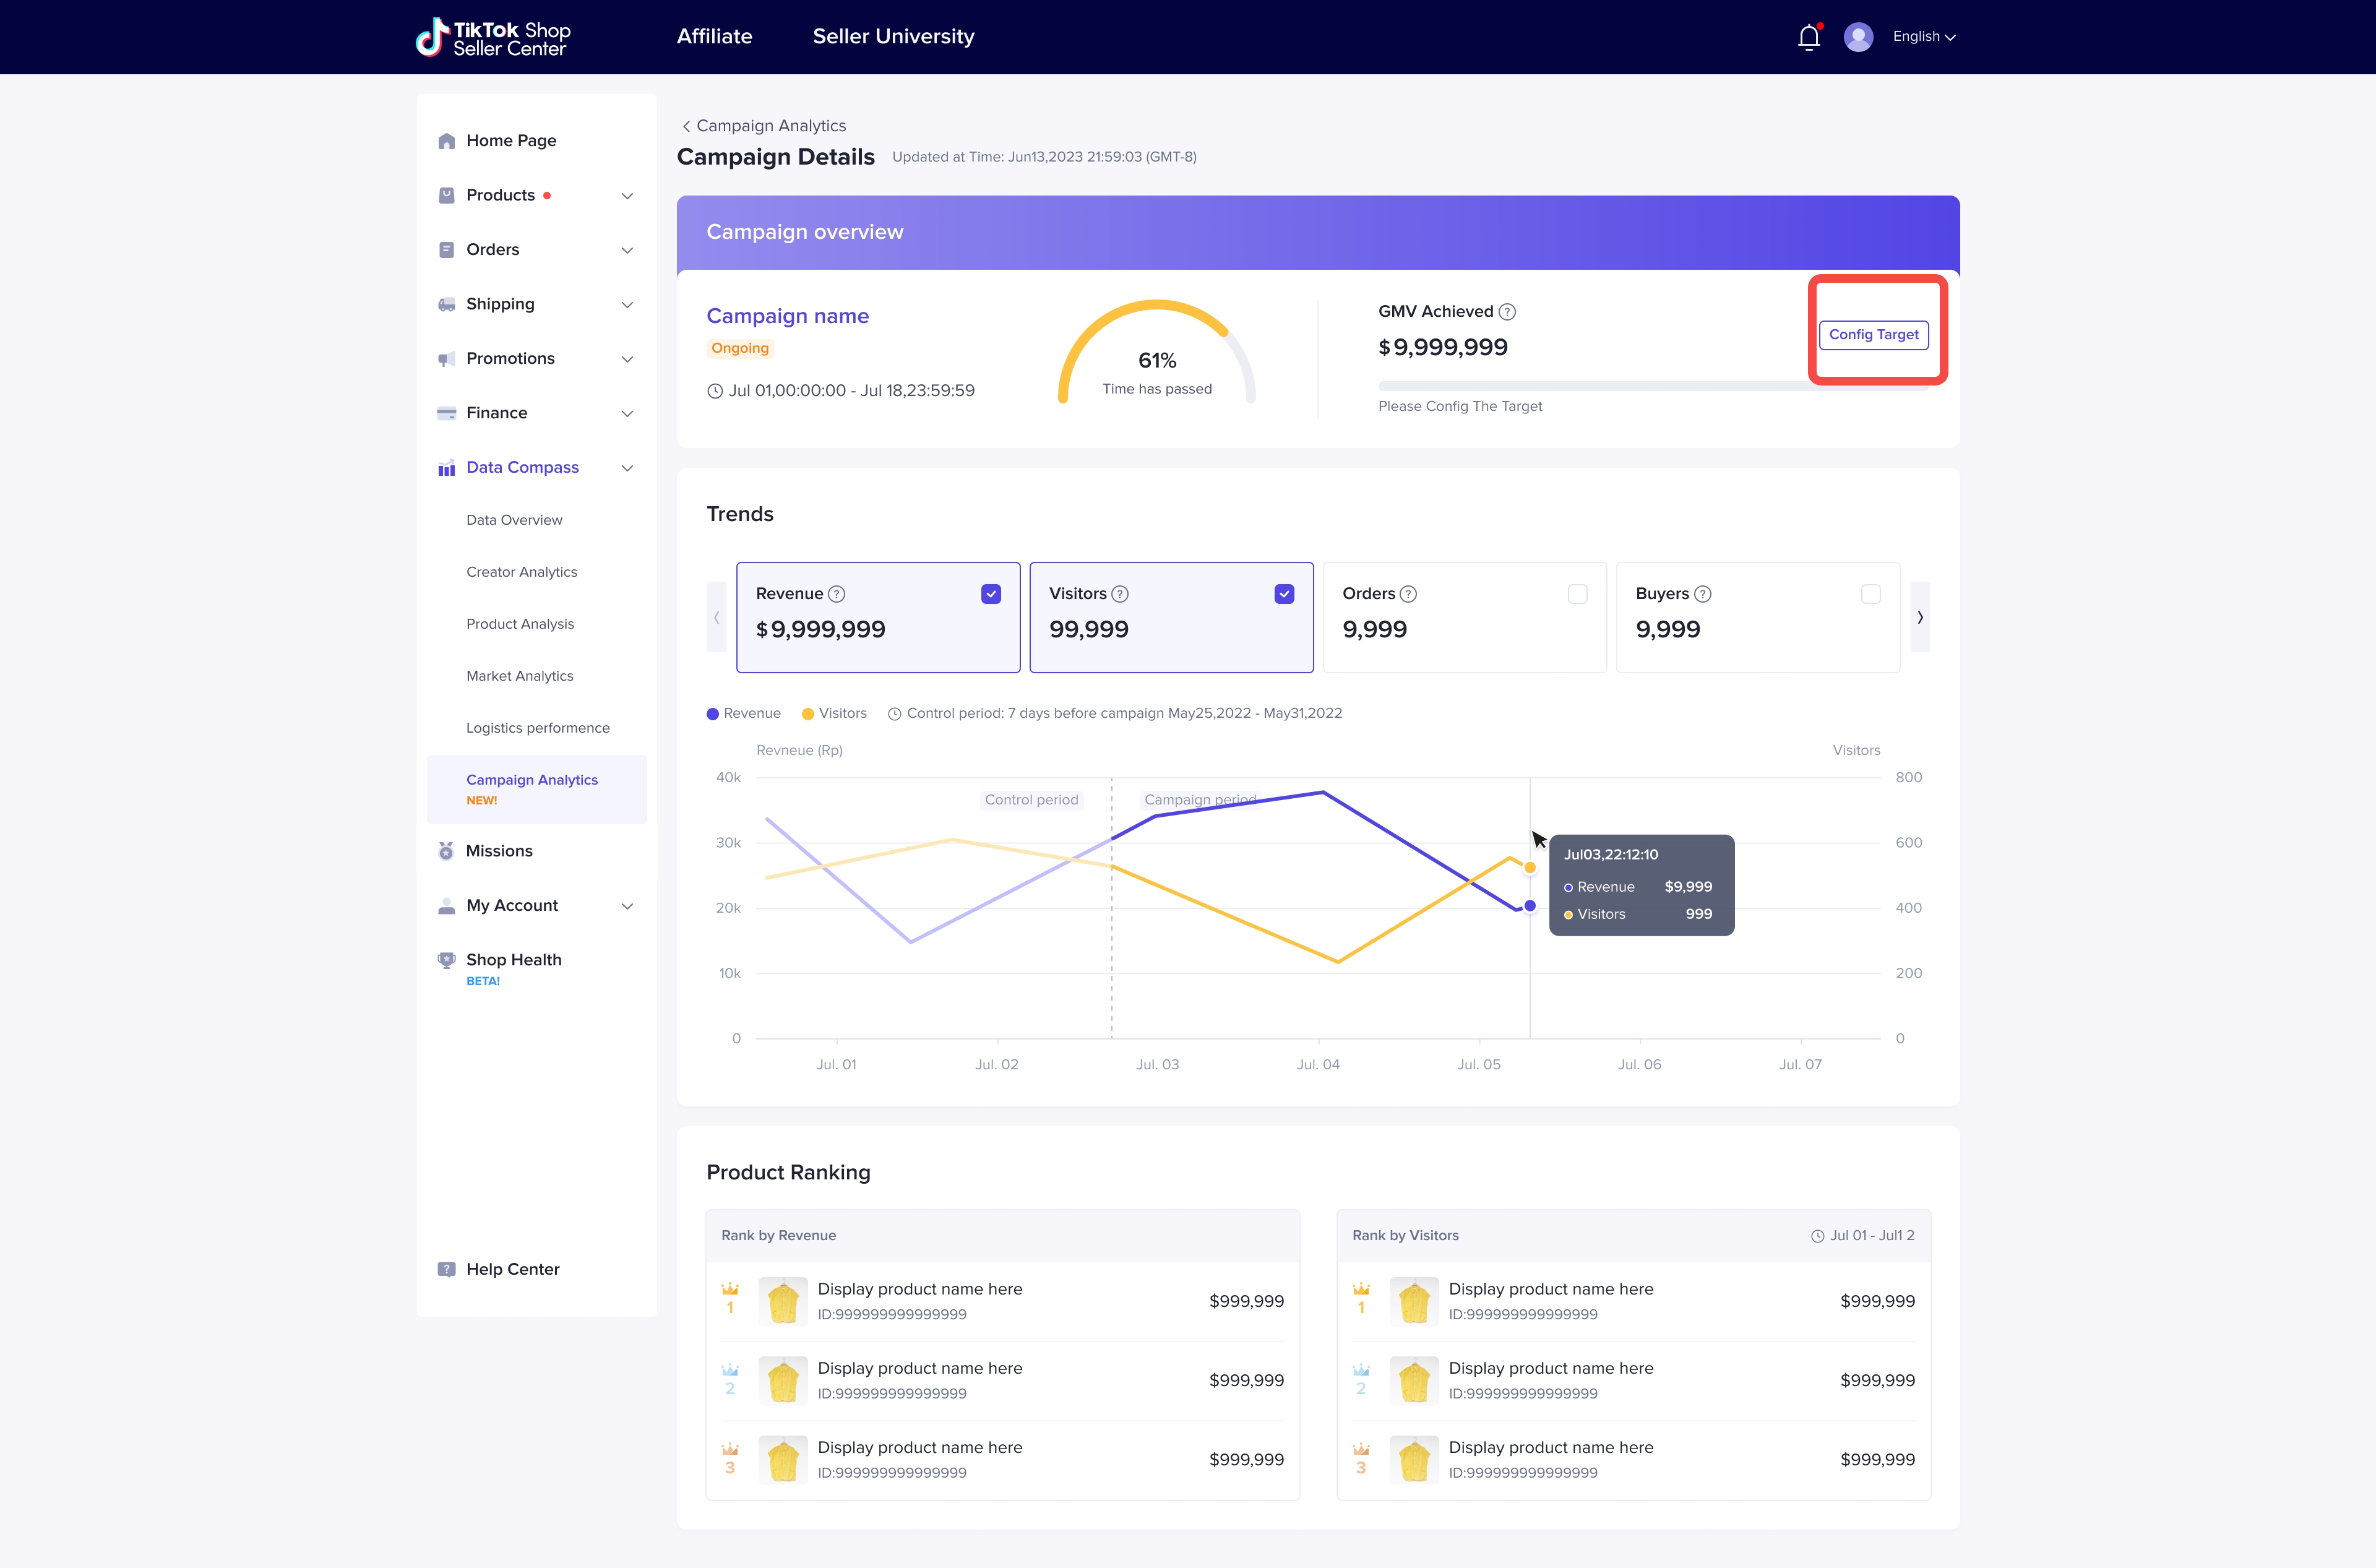
🌟🌟 Compare the difference between sales and daily performance
- Want to know how your store's transactions and traffic perform during your promotion compared with daily performance?

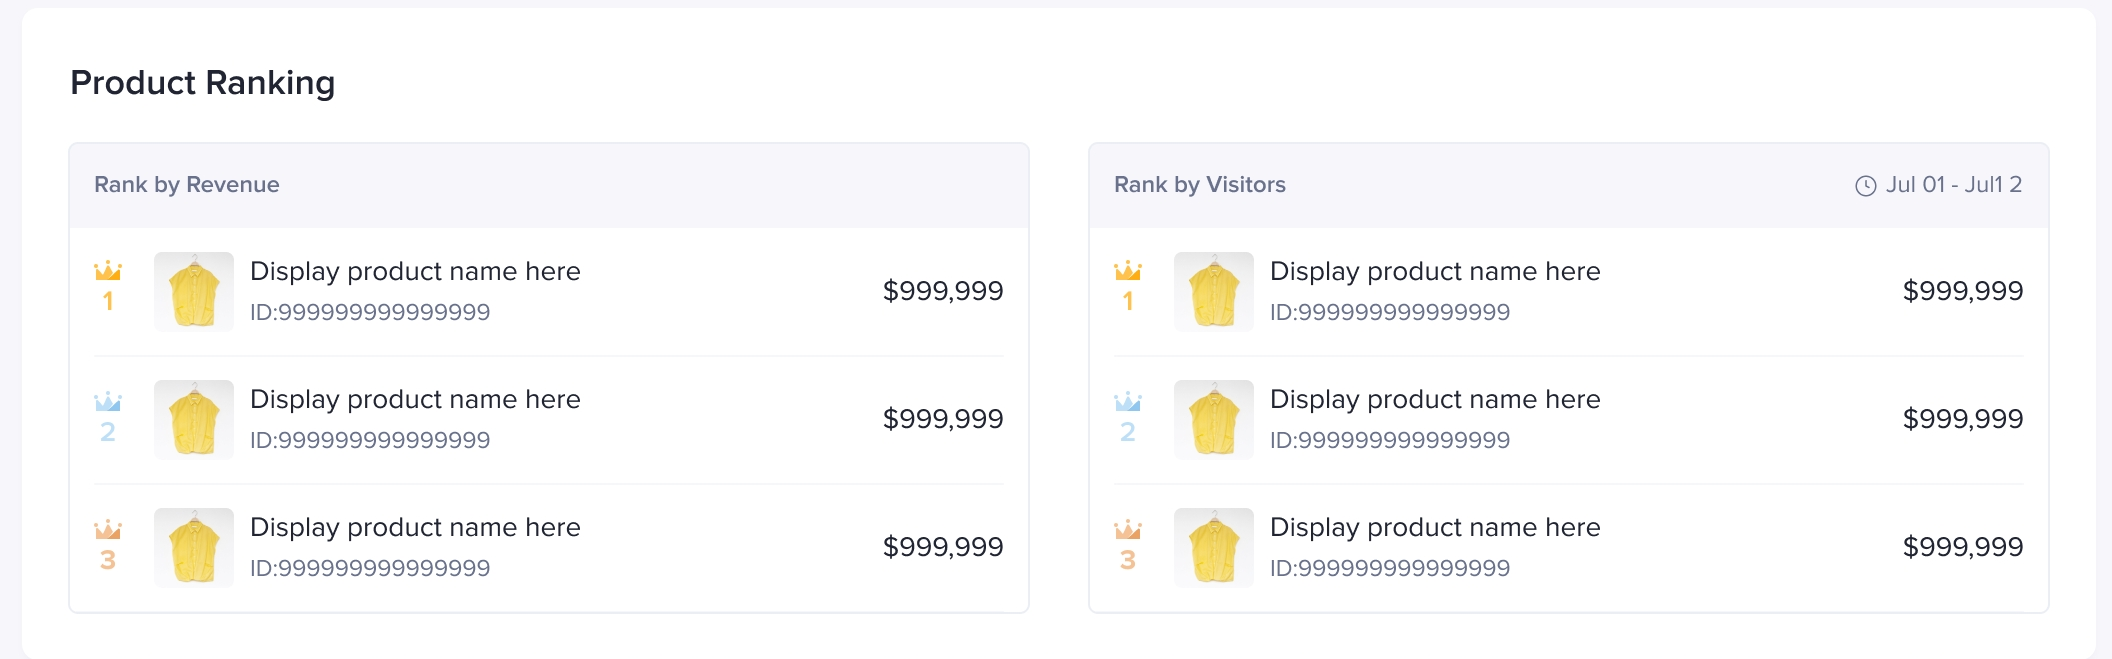
🌟🌟 Understand how your store’s top products performed during your promotion
Promotion analysis provides a ranking of your store's top products, so you can quickly see which participating products are most popular with users and generate the most transactions and traffic.- For hot-selling products, you can improve your focus on them in the LIVE room.
- For products with high traffic but low turnover, you can improve sales by adjusting price, shipping costs, or product details that may contribute to the lower conversion rates.

🌟🌟 Custom-generated campaign report
After your campaign is over, go to the campaign analysis page, where you can customize which indicators you want to include on the campaign report. For example, you can select GMV growth rate/order growth rate as the main indicator and then choose two to four secondary indicators to populate below the main one in order to show the growth multiplier of the store during the campaign period, which can be used for internal staff motivation, campaign results reporting, and marketing communications.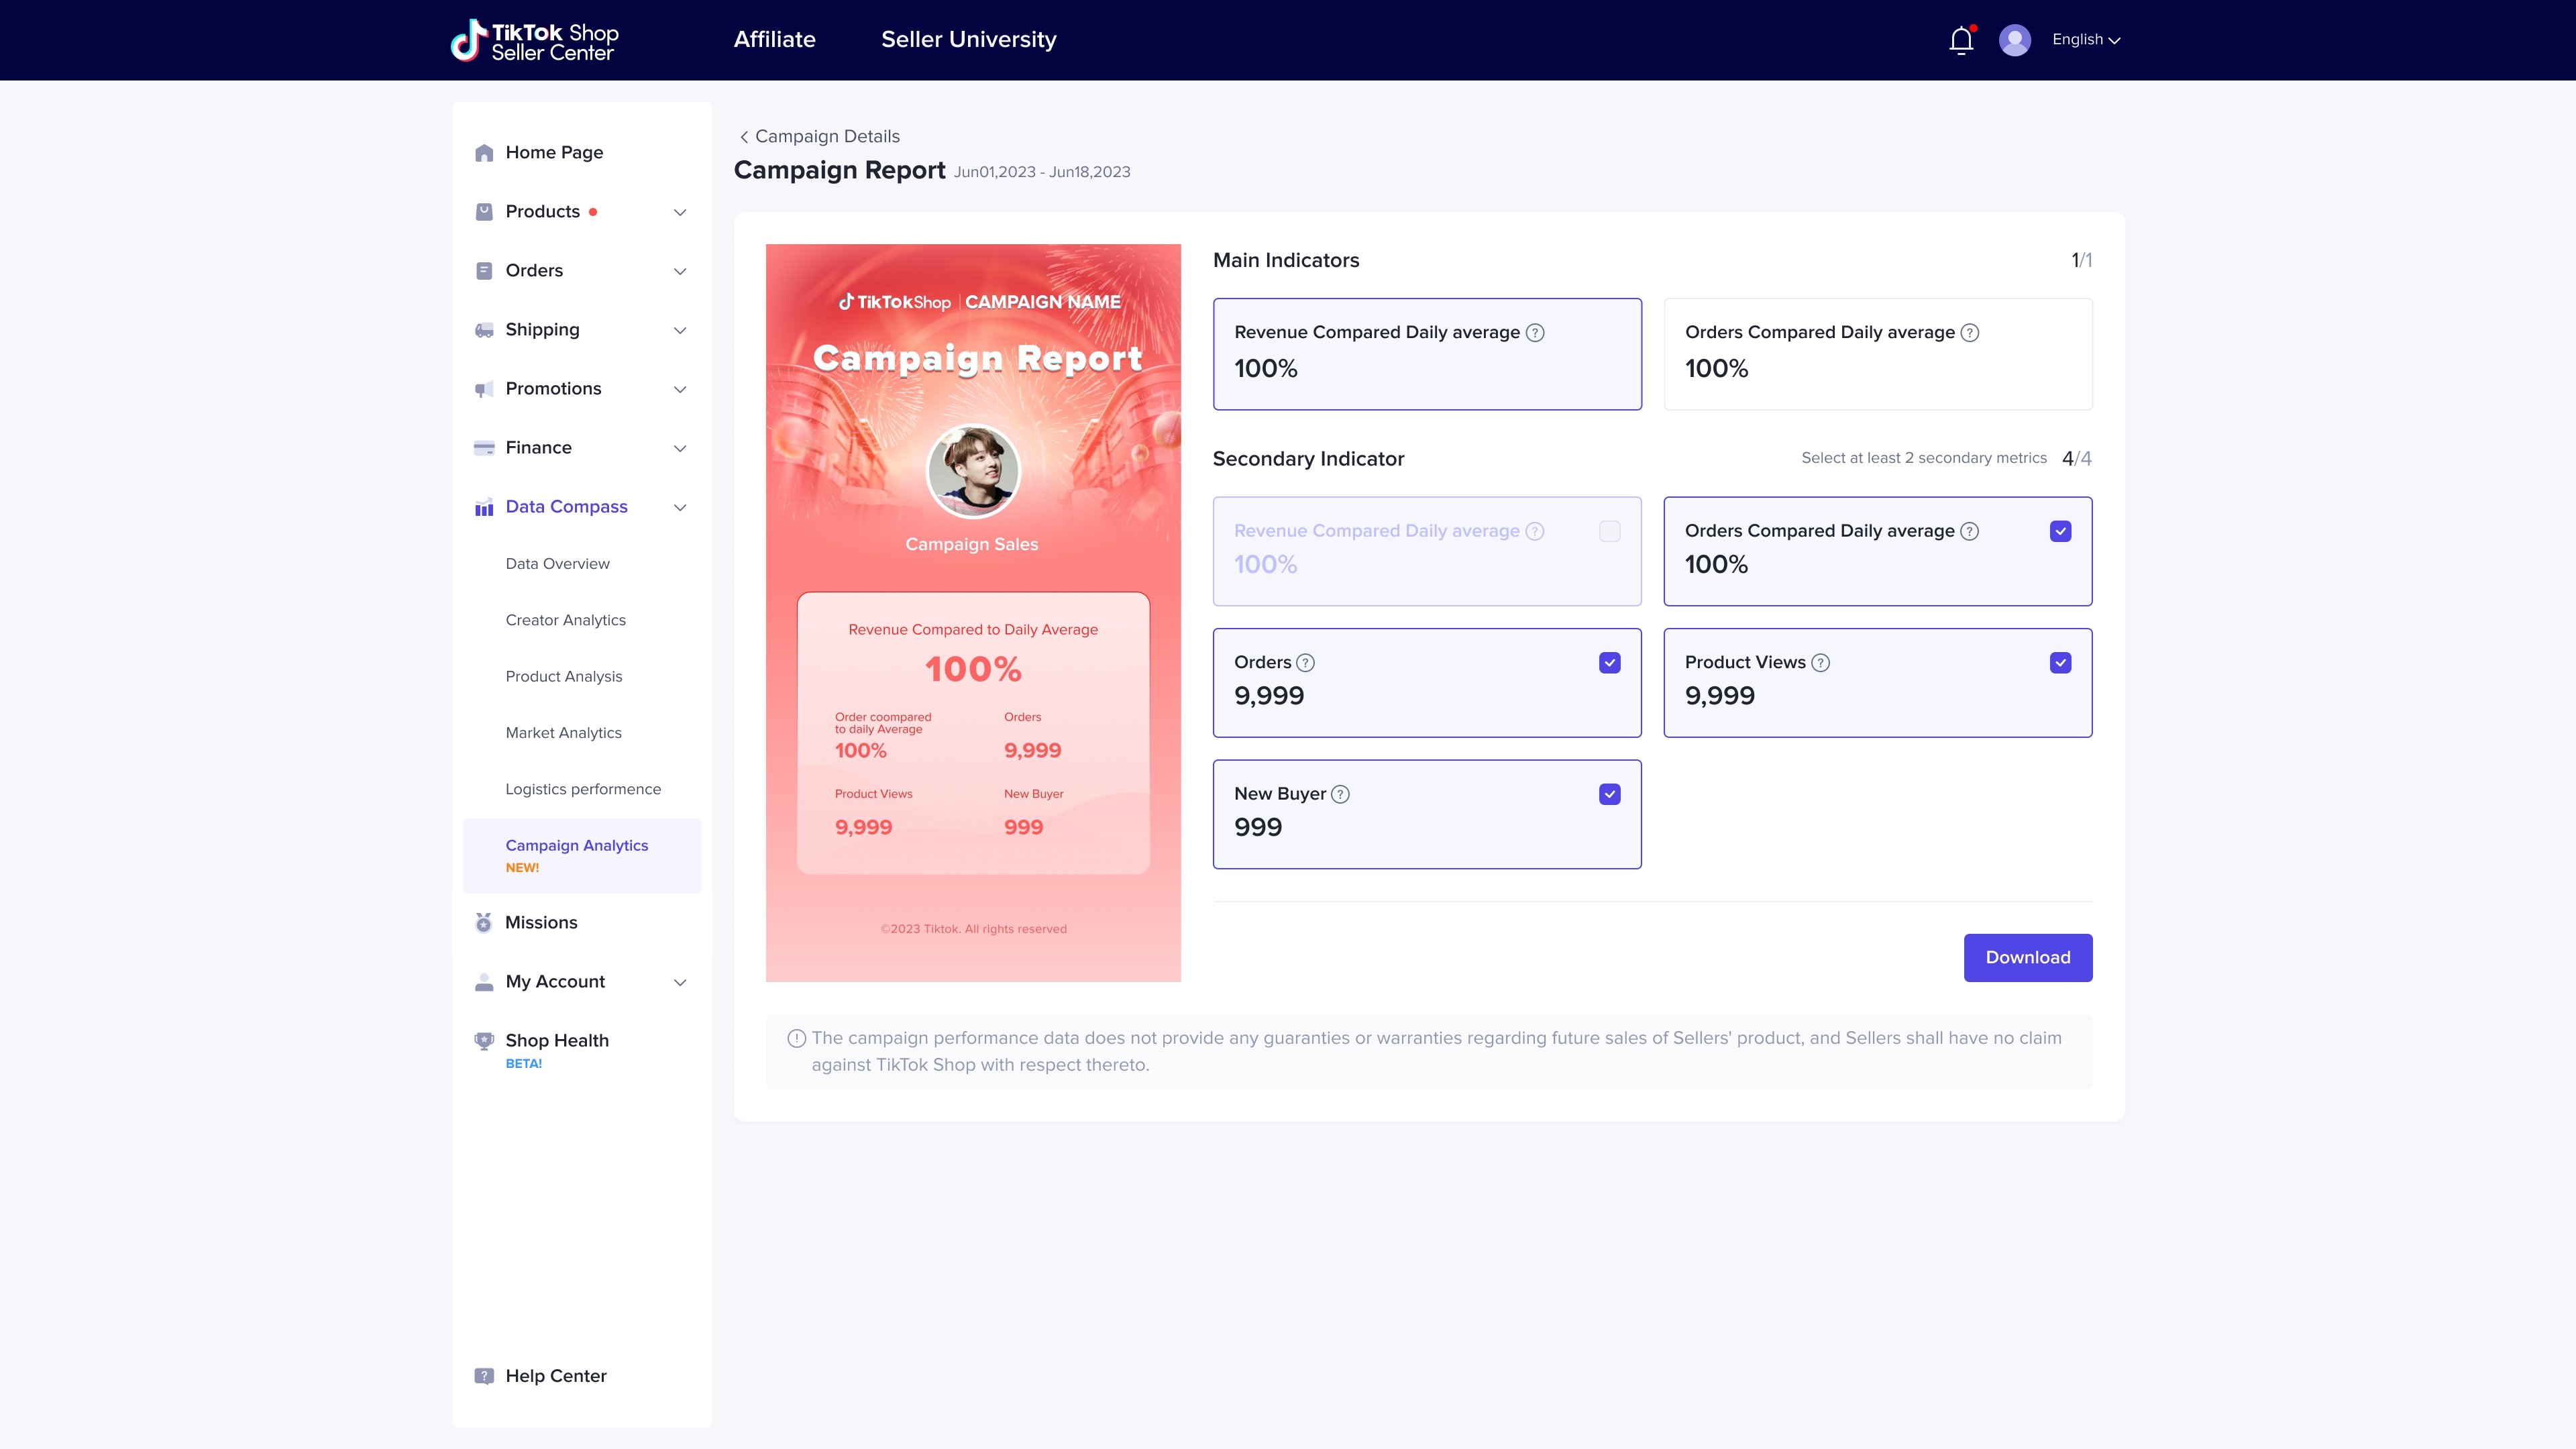
🌟🌟 Review your annual promotion performance
Get a one-page overview of your annual promotion performance on the Promotion Analytics page, which shows cumulative sales and the number of activities you participated in during the year.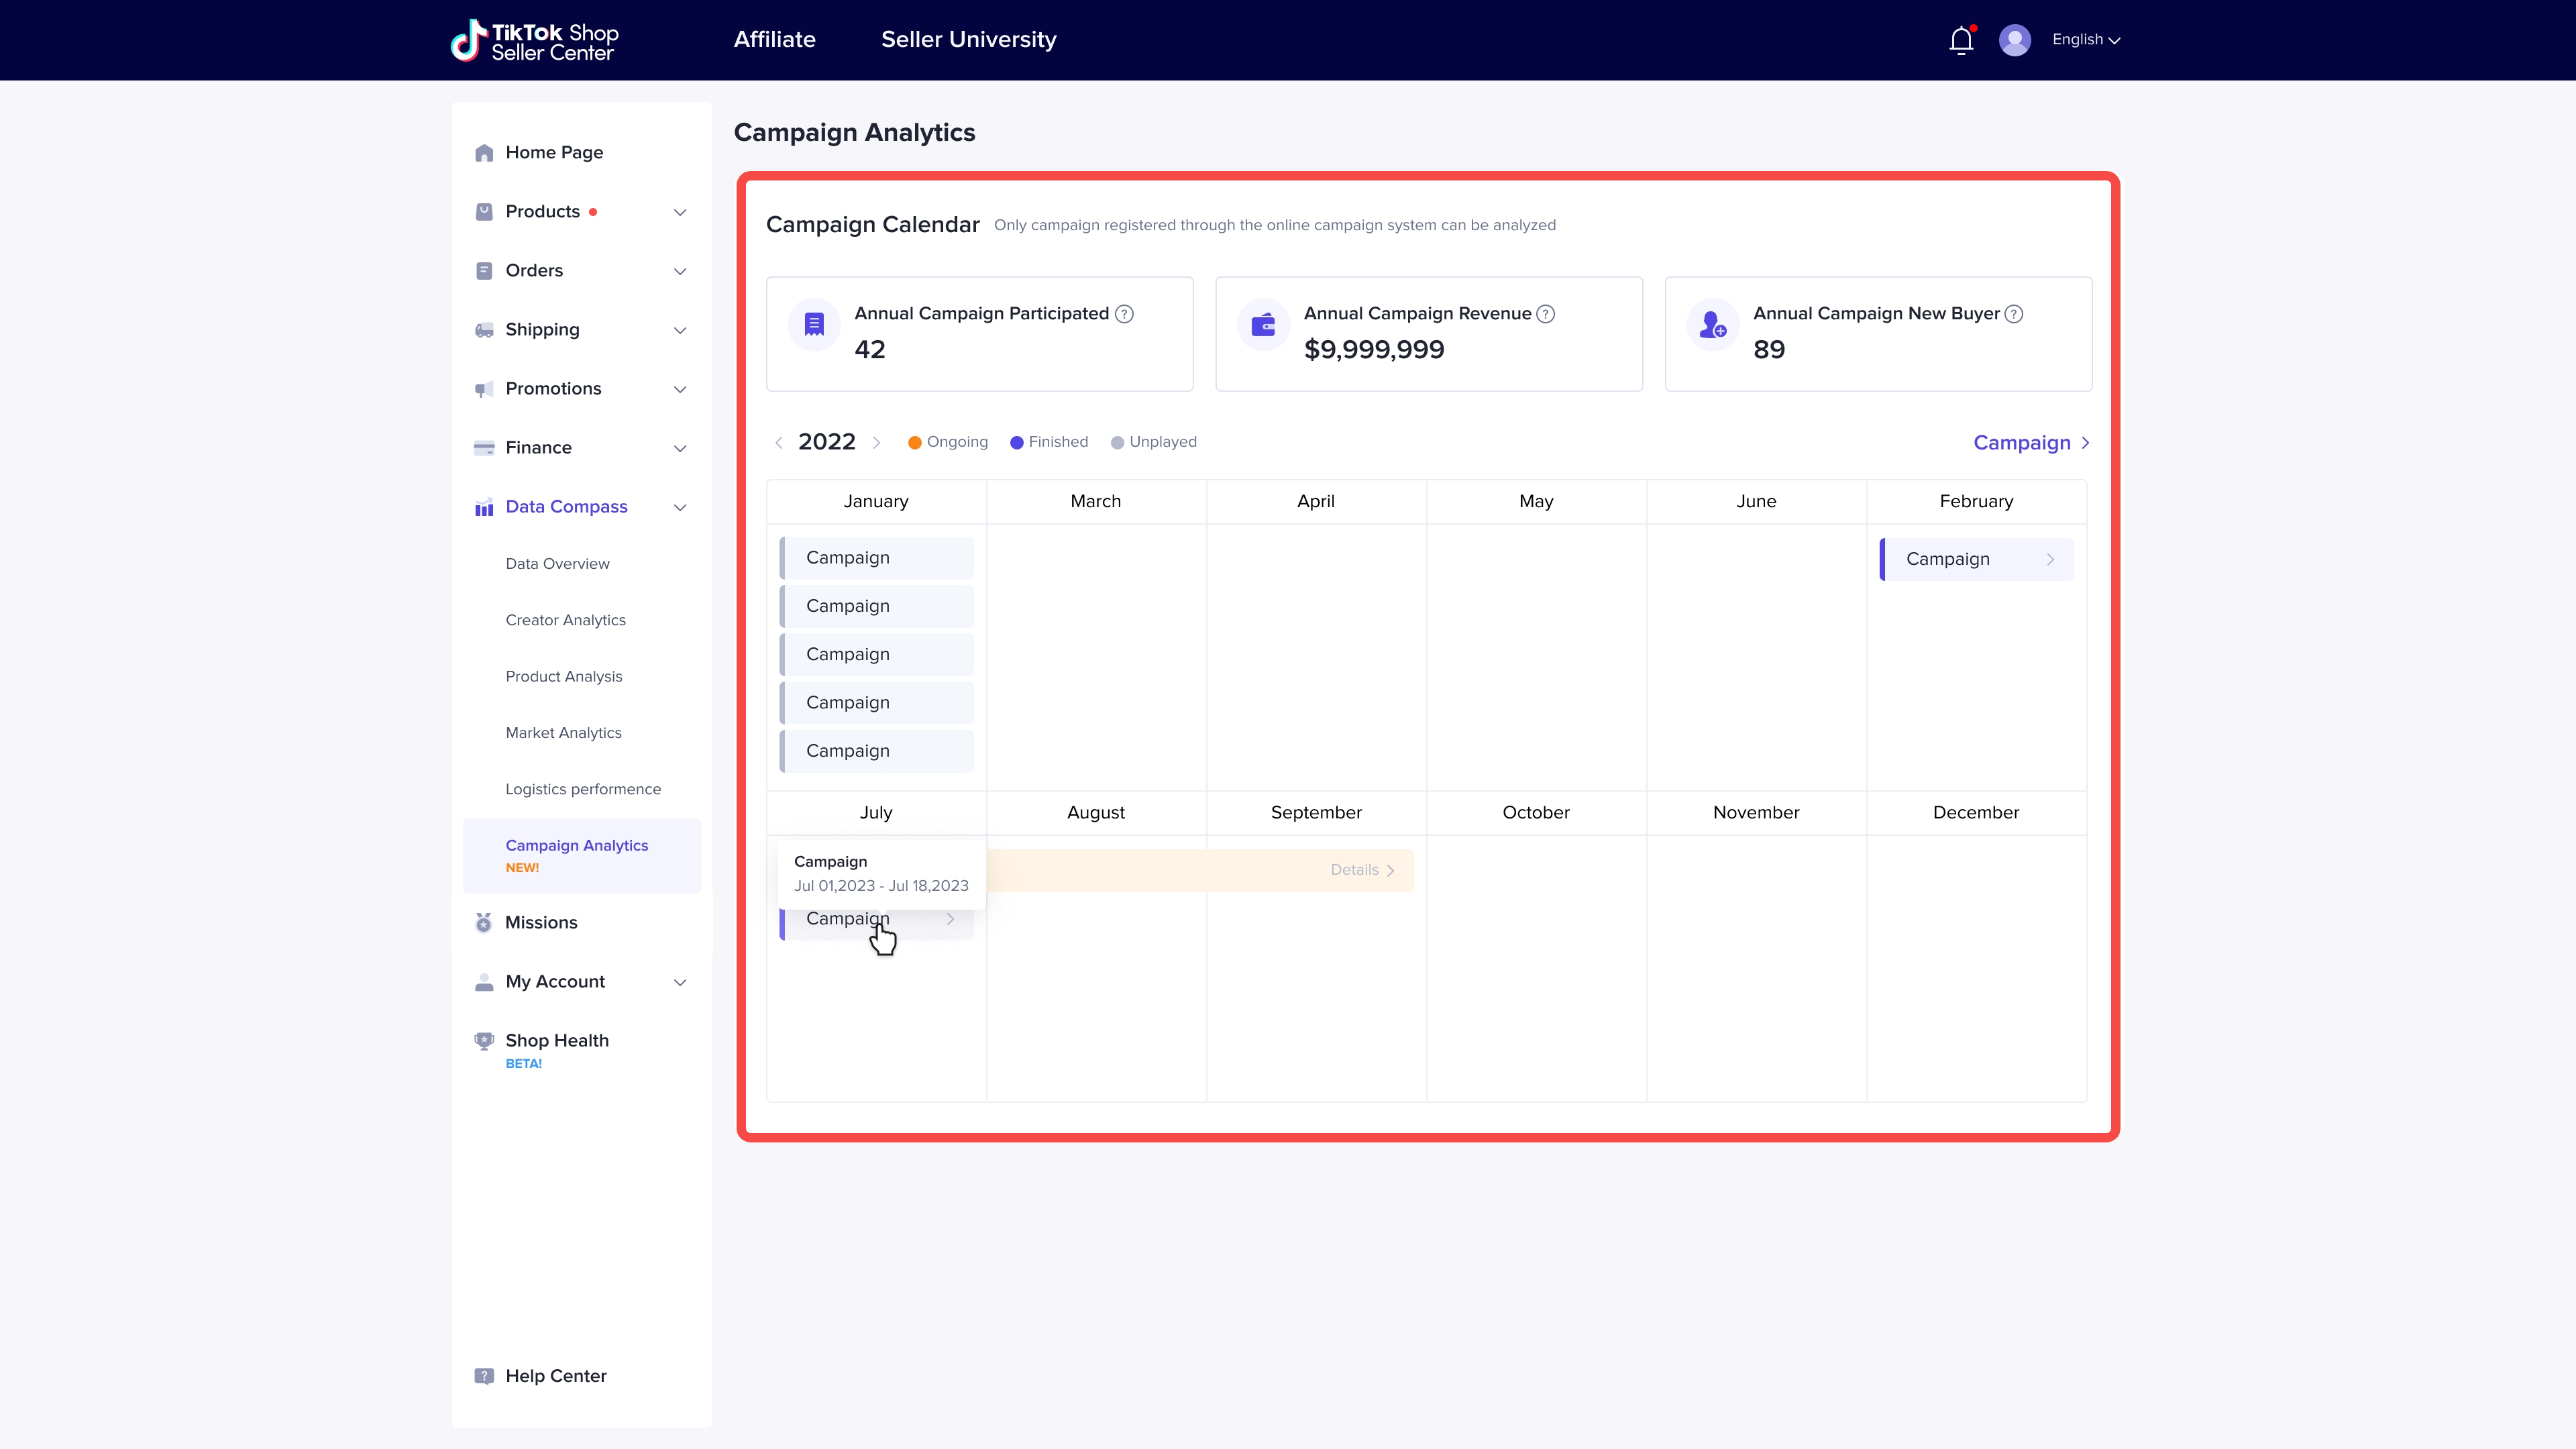
Detailed analysis indicators of your campaign
Detail introduction | Product display (test account, virtual data, subject to product) |
Event Calendar.
|  |
Core indicators
|  |
Product ranking
|  |
Campaign Report
|  |