

Shop Tab & Search Analytics
Summary
What is the Shop Tab and how can sellers optimize their performance on TikTok Shop?
- The Shop Tab facilitates product discovery through search functionalities and provides insights for improving business performance.
- Sellers can optimize performance by exploring product opportunities, creating promotions, and driving traffic to improve sales and store performance.
What are the key metrics available in the Shop Tab Analytics, and how can they be used?
- Key metrics include GMV, Items Sold, Impressions, and Avg. Daily Customers, which can be customized by time period.
- These metrics help sellers understand their performance and can be exported as an XLS for further analysis.
How can sellers leverage the Product Recommendations feature on TikTok Shop?
- The Product Recommendations feature helps in product discovery, brand awareness, and increasing conversions.
- Sellers can optimize products for recommendations by improving image quality and ensuring sufficient stock to meet requirements.
What insights can sellers gain from the Shop Page Performance analysis?
- The analysis provides metrics like GMV, Orders, Items Sold, and Conversion Rate to understand traffic and conversion performance.
- Sellers can identify top-selling products and analyze customer preferences to boost revenue by catering to these preferences.
How can sellers improve traffic and sales through the Shop Tab?
- Sellers can enhance product exposure by using attractive images, clear titles, simplified descriptions, and competitive pricing.
- Adding vouchers and optimizing product listings can also effectively increase traffic and sales.
Access Shop Tab & Search Analytics here: https://seller-us.tiktok.com/compass/shop-tab
The Shop Tab is the cornerstone of TikTok Shop, facilitating product discovery through user-friendly search functionalities.Where to View Shop Tab & search
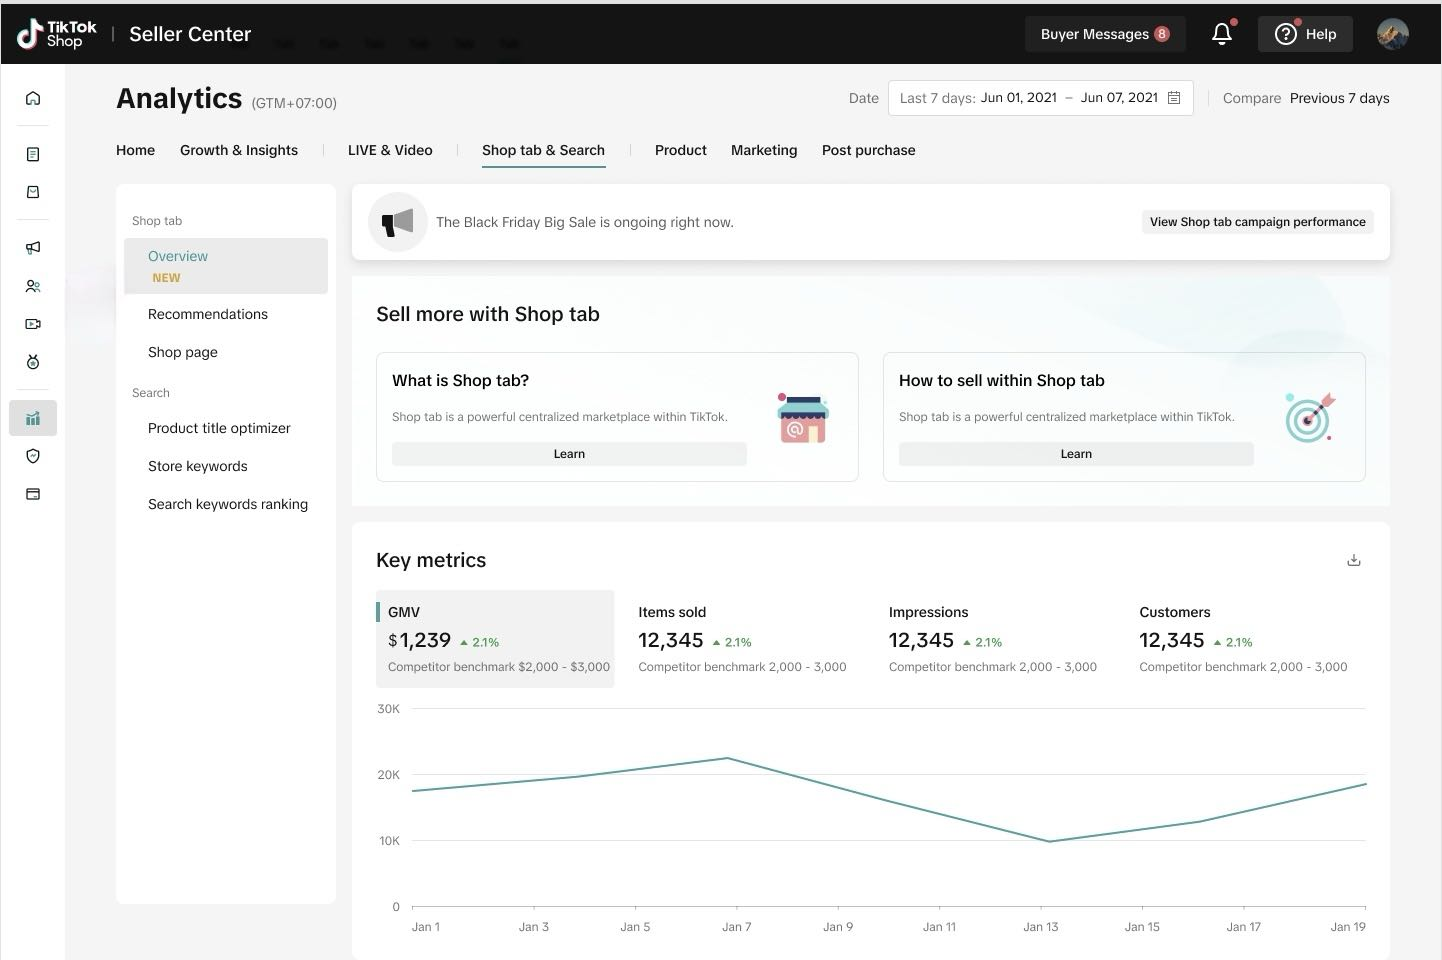
Shop Tab Overview
Learn about Shop Tab
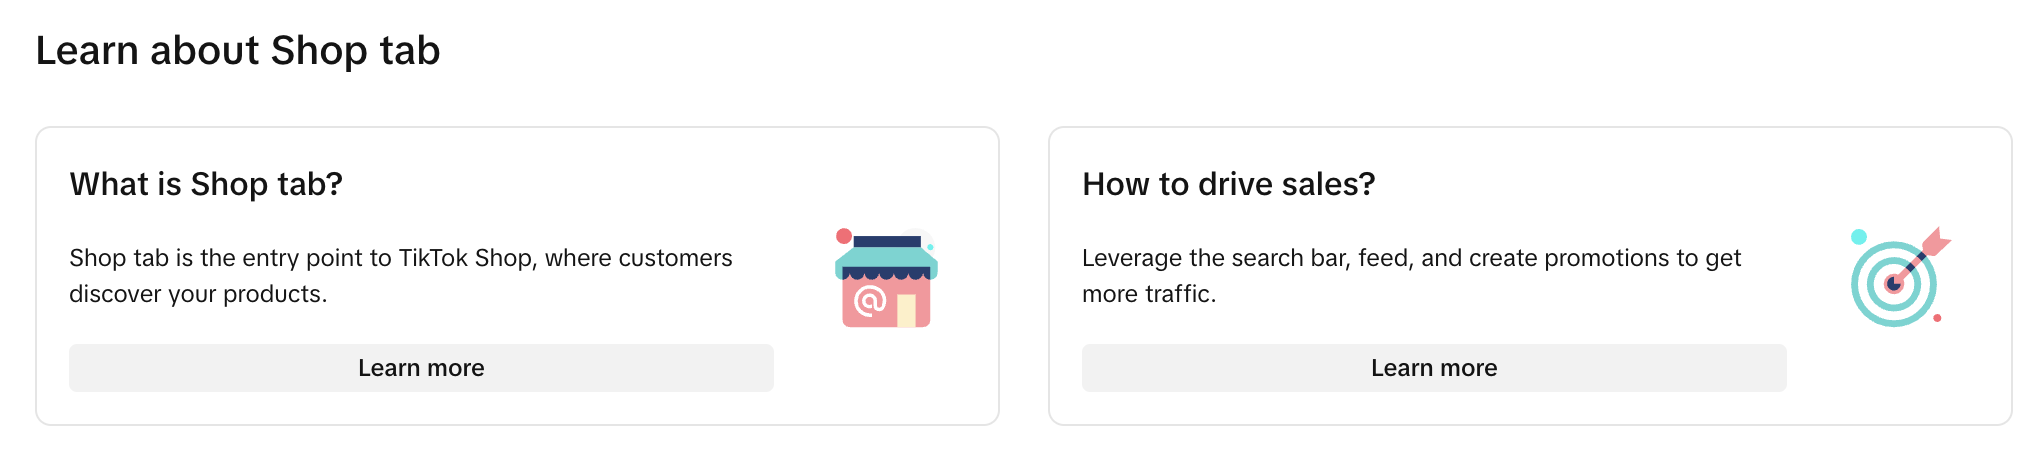
- What is Shop Tab?
- How to drive Sales?
Key metrics
Understand your TikTok Shop performance specifically through the Shop Tab. You can customize the time period that you want to view.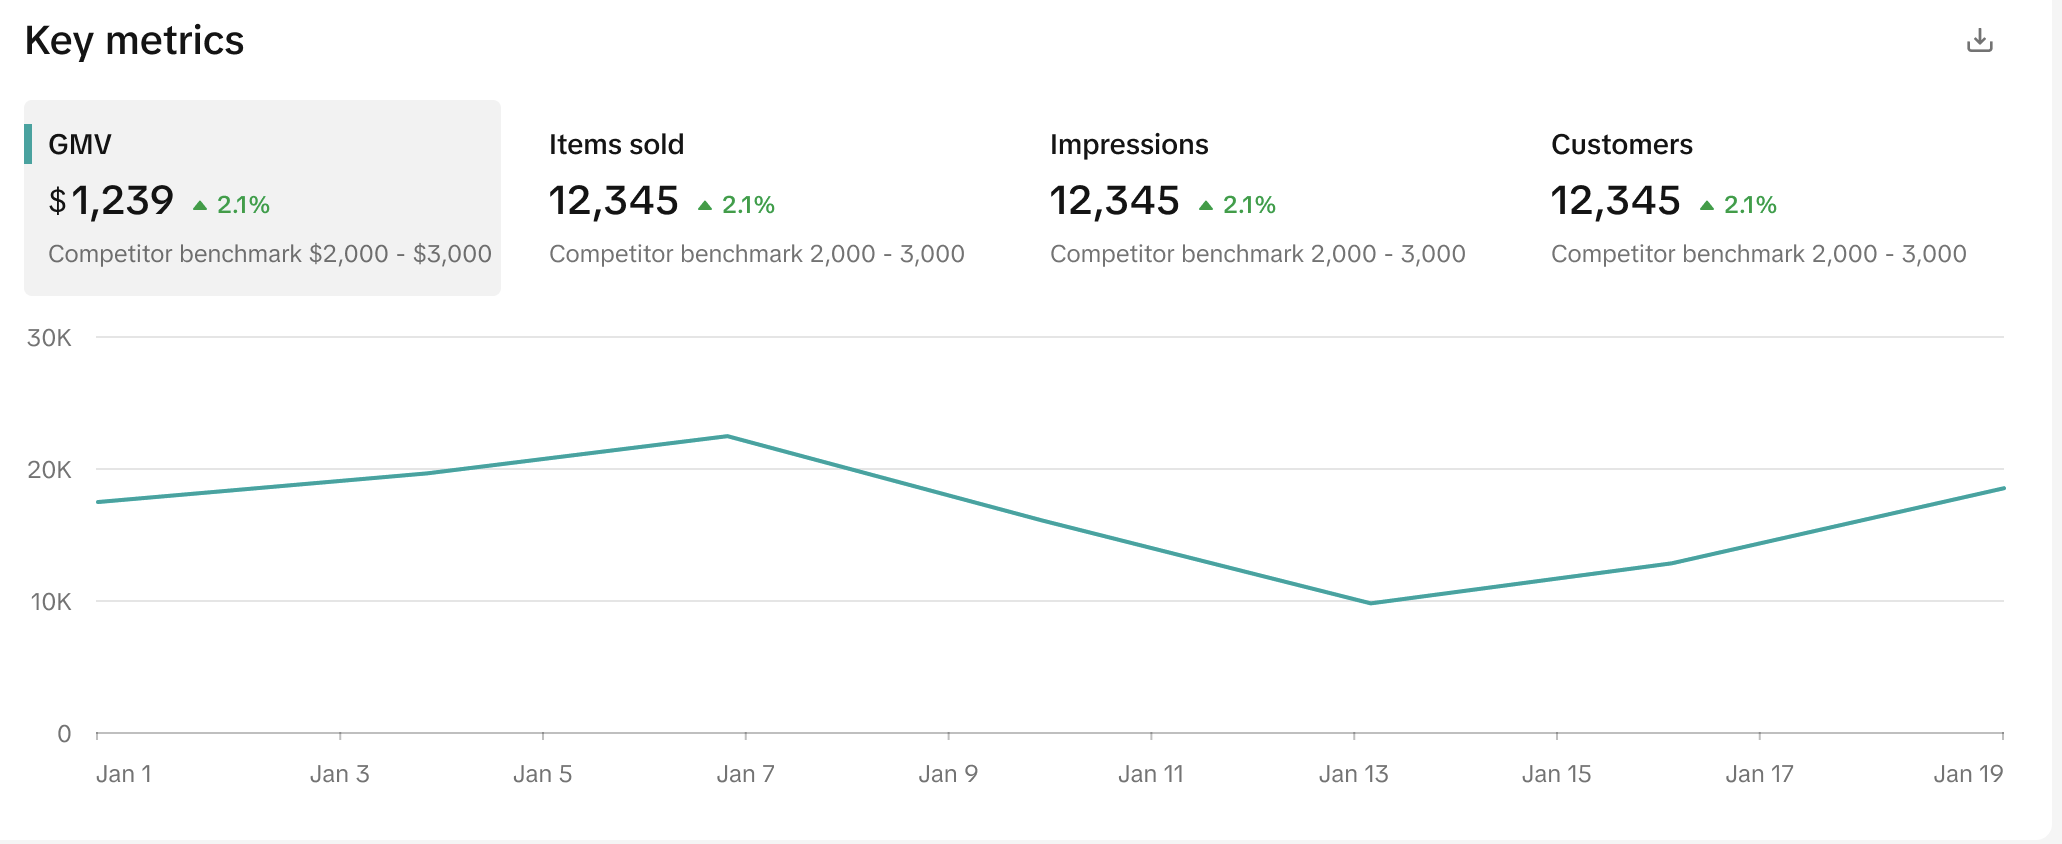
- GMV: The total amount paid for orders from the Shop Tab, including returns and refunds.
- Items Sold: The total number of individual items sold from the Shop Tab. (Example: If a customer buys 3 units of SKU A and 2 units of SKU B, the items sold would be 5.)
- Impressions: The total number of times products in Shop Tab were displayed to viewers.
- Avg. Daily customers: The average number of customers per day. Total number of customers divided by the number of days.
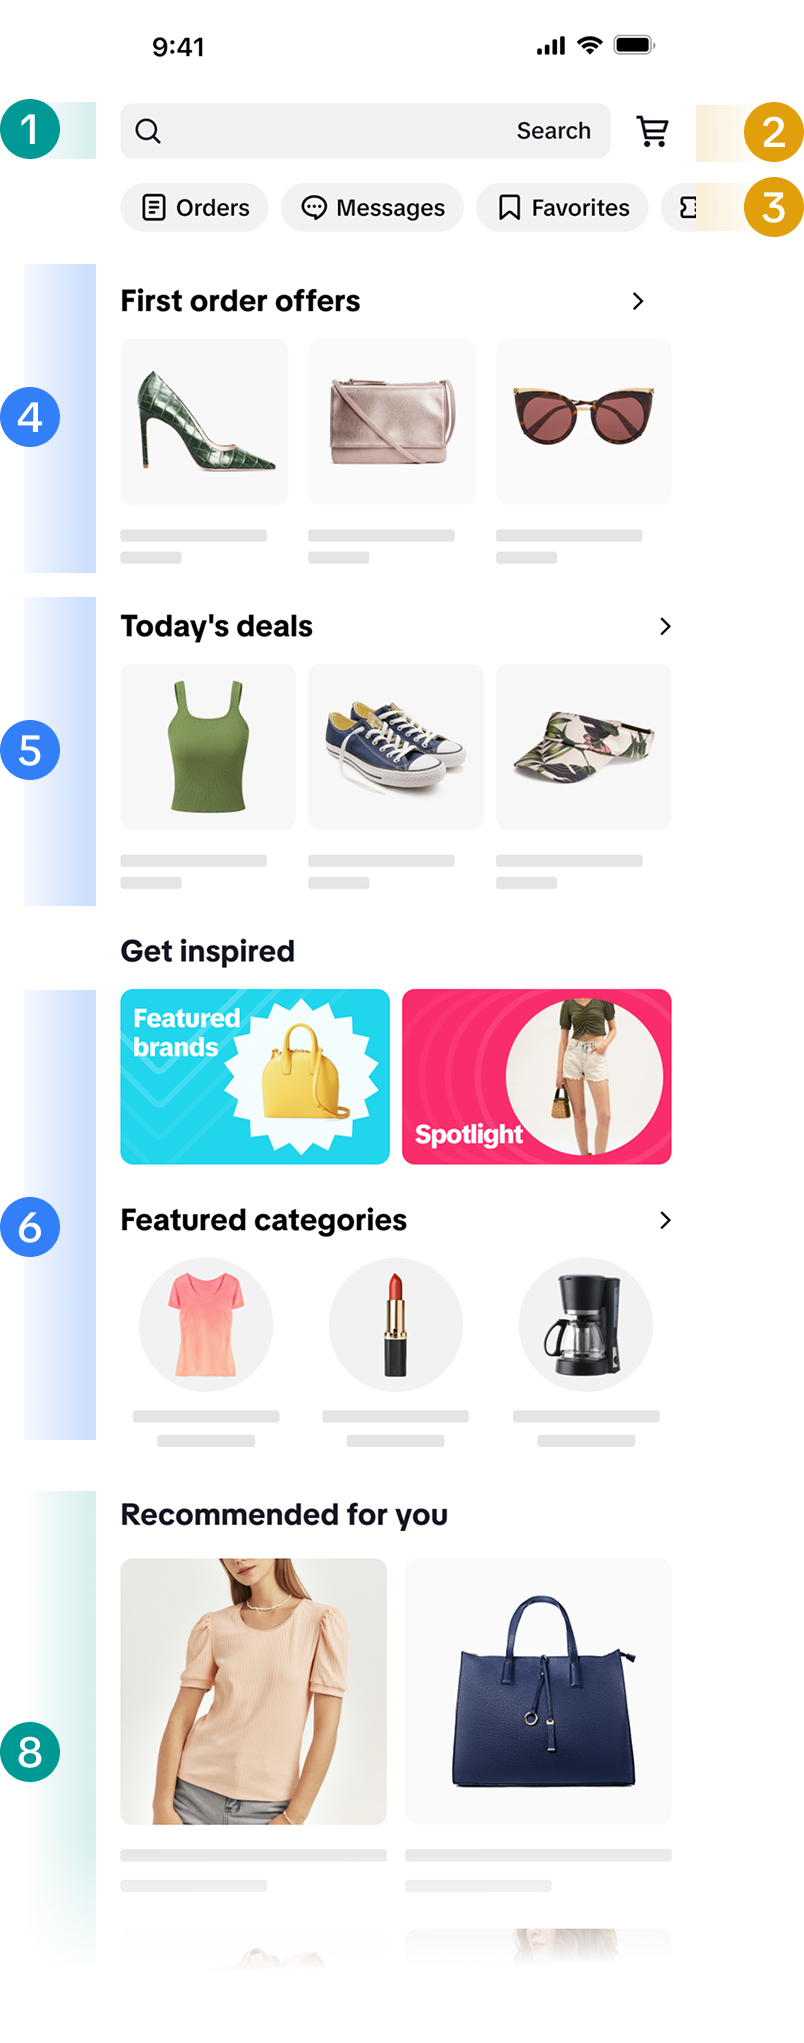
Shop Tab breakdown
The Shop Tab breakdown section highlights how Shop Tab GMV is further broken down by its components. Shop Tab components are the main components of Shop Tab (Search and feed, Promotion Channels, and other shopping tools) even if other sources may contribute to your traffic and GMV.The components of Shop Tab are as follows:
- Search and feed:
- (1) Search: The search bar where customers can search and discover products
- (8) Feed: The "Recommended for you" feed with products recommended based on TikTok's algorithm.
- Promotion channels:
- (4) Clearance: Get featured under "Clearance" by offering discounts on slow-moving stock
- (5) Today's deals: Get featured in "Today's deals" by registering for Deal Discovery
- Other promotions: Other promotions like Brand channel, campaigns, and more, that add to your overall traffic
- Other shopping tools:
- (2) Other shopping tools: Where customers add items before checkout
- (3) Favorites: Where customers save and view products that they like for future purchases
- (3) Orders: Where customers view their order details
- Shop page: Your online shop from where customers can see all your products
Recommendations
Recommendations overview
Understand your TikTok Shop performance through the Product Recommendation feature. You can customize the time period that you want to view.- Recommended products per day: The daily count (minimum and maximum number) of recommended products in the selected time period. Due to fluctuations, the number of recommended products can vary from day to day.
- GMV: The total amount paid for orders placed directly from recommended products, excluding any discounts.
- Impressions: Each time a product link appears in a Recommendations touchpoint, it counts as 1 impression. Viewers can click these links to visit your product listings.
- Orders: The total number of paid SKU orders placed directly from recommended products.
- Customers: The total number of customers who placed orders directly from recommended products, including customers who made returns or refunds.
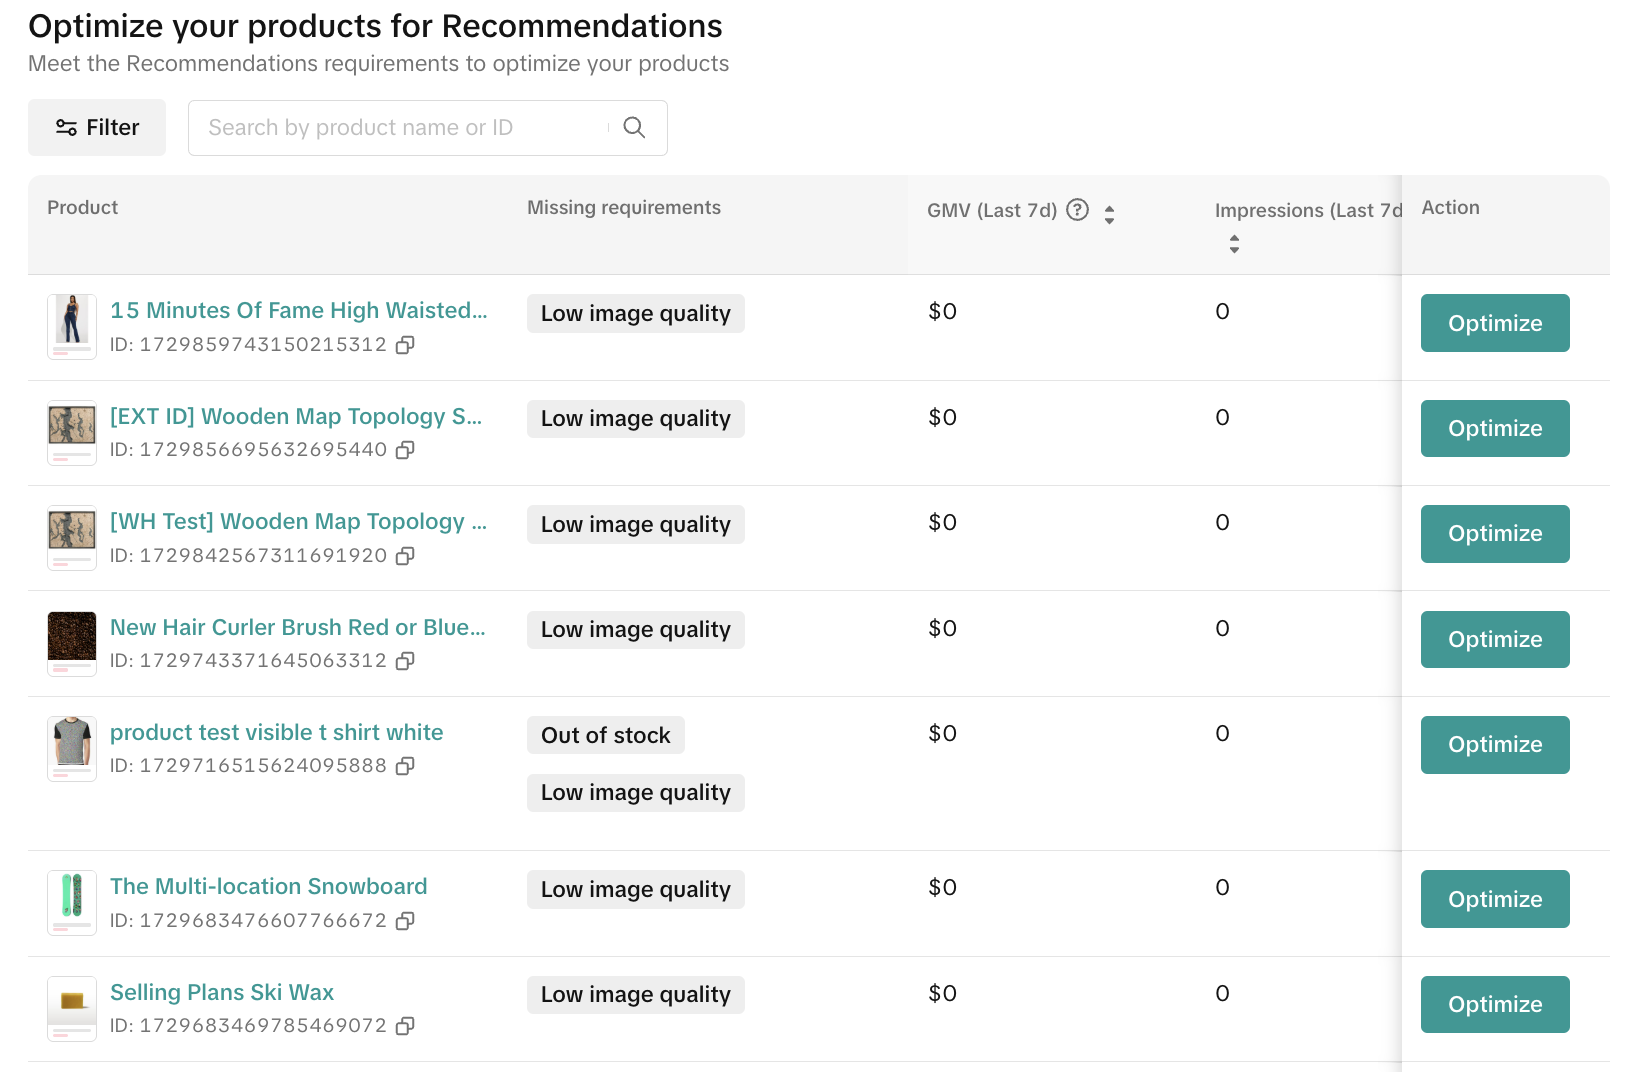
Optimize your products for Recommendations
Review your products and see actionable steps to optimize them and get featured in recommendation touchpoints, which will increase visibility.Clicking on "Optimize" by any product will list what needs to be remedied before the product can be included in the Recommendations feature. Requirements can vary from increasing your product image quality to ensuring you have sufficient stock.
Shop page
Considering the shop page is an important way to attract customers and improve conversion, we built the Shop Page Performance analysis to help you better understand the business performance of your shop page and optimize the shop design to help achieve your business goal.
Overview
In the overview section, check out the 4 key metrics that reflect the traffic and conversion performance on your shop page:- GMV
- Orders
- Items sold
- Conversion rate (The percentage of unique page views that result in sales of your products)
Traffic
Analyze the conversion gaps by the transaction funnel data from shop page views to unique shop page views, and shop page product buyers.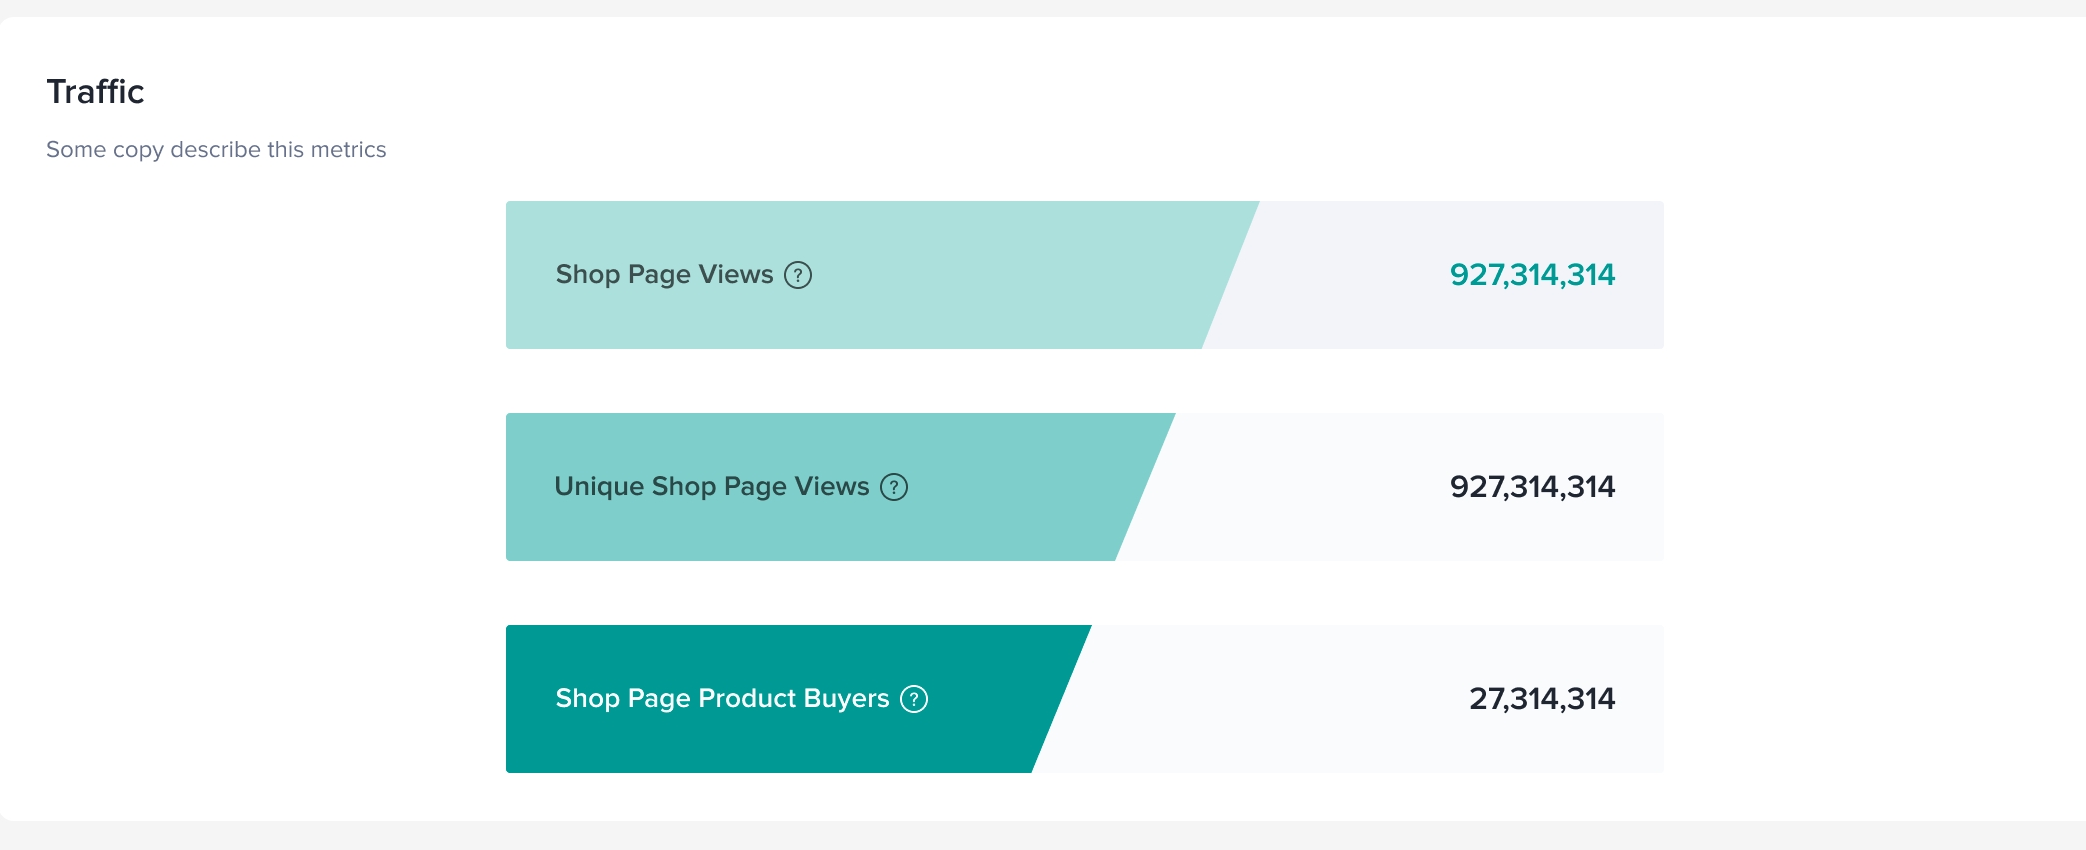
Traffic Sources
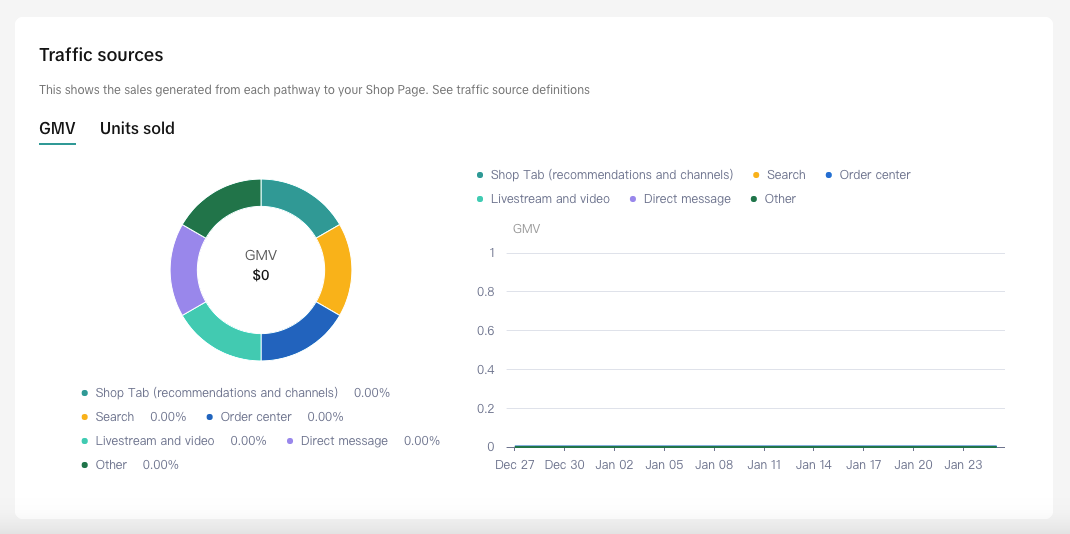
- In the traffic sources section, check out the pie chart of the GMV or units sold to breakdown by different traffic sources, including Shop Tab(recommendations and channels), Search, Order center, Livestream and video, Direct message and other channels.
- Hover to the pie chart, you are able to see the detailed data of the specific source including GMV, units sold, impressions and PV.
- Track the daily trends of each traffic source with the right side trend lines.
FAQs
- How are revenues calculated through Shop Tab?
- How can I improve my traffic through Shop Tab?
- Where can I view Affiliate Data?
- What are the channels that direct users to a Shop page?
You may also be interested in

Guide to VoC (Voice of Customer) & VoC Case Study
Guide to Voice of Customer (VoC) Why Use Voice of Customer (VoC)? Voice of Customer (VoC) is a p…
![[Feature Guide] Seller Analytics | Product Traffic Analysis](https://p16-oec-university-ttp-sign.tiktokcdn-us.com/tos-useast5-i-fsvlofm1vi-tx/6a1d691e79ba4966b3f8aaba16fd700c~tplv-fsvlofm1vi-image.png?lk3s=5d1a069b&x-expires=2093029303&x-signature=oSv0YEMXdLSqaLkR4o%2FocWri3YU%3D&render=1778306958952)
[Feature Guide] Seller Analytics | Product Traffic Analysis
Background During previous research and interviews, we frequently received requests from merchants f…

How Does Product Card Diagnosis Work? - Enhance Competitiven…
Overview The Product Card Diagnosis feature is an effective way to analyze if a product card is perf…

How Does Product Card Diagnosis Work? - Content Operations
Overview The Product Card Diagnosis feature is an effective way to analyze if a product card is perf…

Cancellation & Return Data Analytics User Manual
Access this feature here. The Cancellations and Returns performance tab has been launched on Data An…