

Cancellation & Return Data Analytics User Manual
Summary
What insights can sellers gain from the Cancellation & Return performance tab on TikTok Shop?
- Sellers can monitor quantities of cancelled and returned items, and refunds, providing a clear view of post-transaction issues.
- They can identify responsibilities and reasons for cancellations and returns, whether caused by Seller, Buyer, or Shipping.
How can sellers use the Cancellation & Return dashboard effectively?
- Select a time period and categories to view cancelled and returned items, and refunds across different transaction stages.
- Analyze responsibility and detailed reasons for cancellations and returns to identify major issues and improve services.
What specific features help sellers identify problematic products on TikTok Shop?
- The dashboard displays a detailed product list for each cancellation and return reason, helping sellers pinpoint products with more issues.
- Sellers can take action to improve post-transaction services based on insights from the product list.
Access this feature here
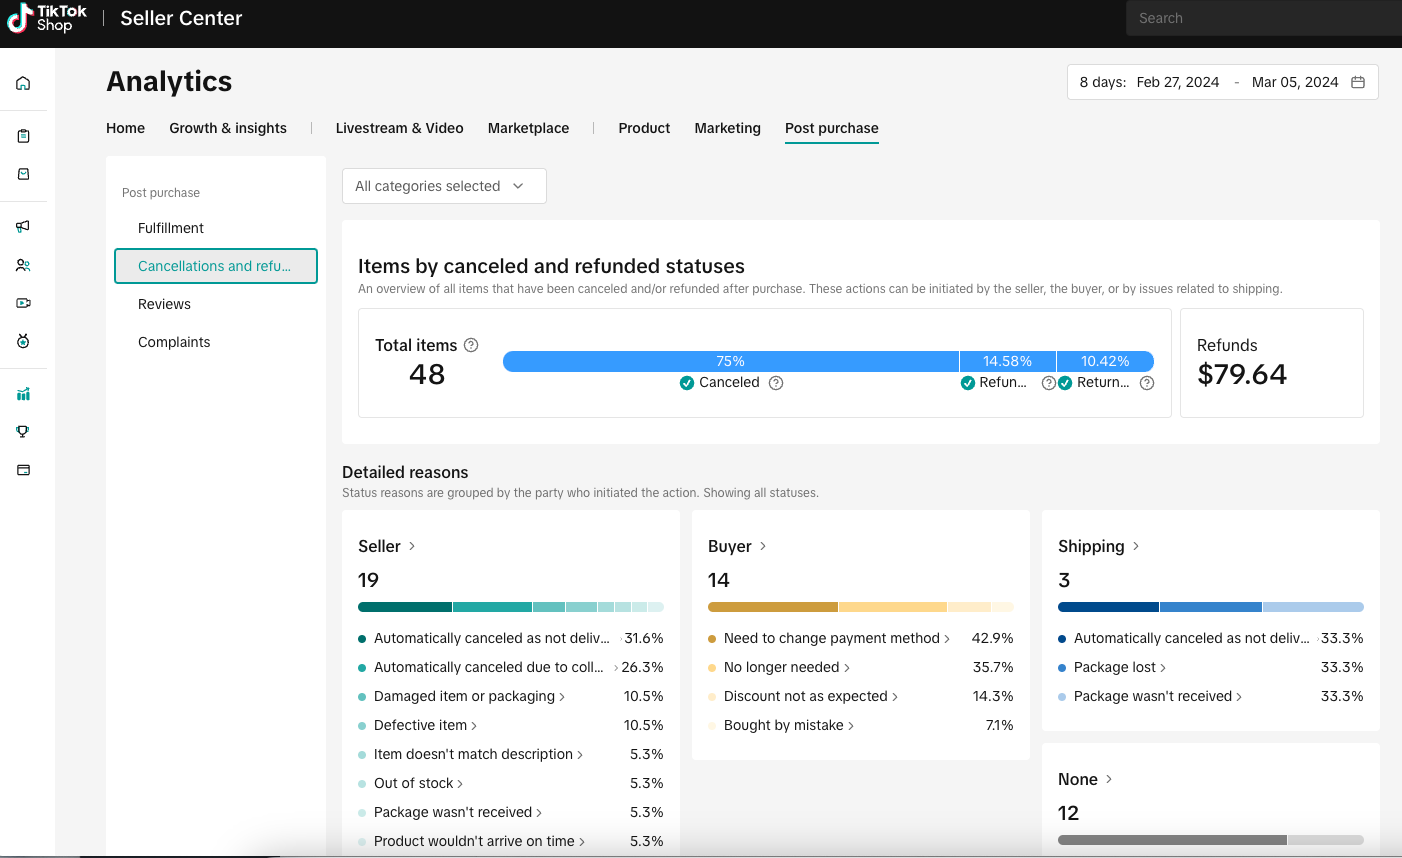
.The Cancellations and Returns performance tab has been launched on Data Analytics-Post purchase Analytics. Here you can:
- Monitor your shop's quantities of “Cancelled & returned items”
- Learn the main “Responsibility & detailed Reasons” for cancellations and returns in your shop
- Check which products have the most cancellations and returns
- Break down the “Responsibility & detailed Reasons” by different post-transaction periods of time, and view the detailed product list for each reason
What can I learn from Cancellation & Return performance?
🔥Monitor your Cancellation & Return records and contributions
This feature gives you a clear view of the cancellation and return distribution of the sold item, including item quantities and refunds.🔥Know more about the cause of the major issues
You can also identify the responsibilities of the cancellations and refunds in each stage, whether they’re caused by Seller, Buyer or Shipping. And you can view the reasons and contribution rate of the cancellations and refunds to identify the major issues.🔥View the main issue products that need improvement
With the detailed product list displayed for each reason, it's easy for you to identify which products have more issues and then take action to improve post-transaction services.How to use the Cancellation & Return dashboard
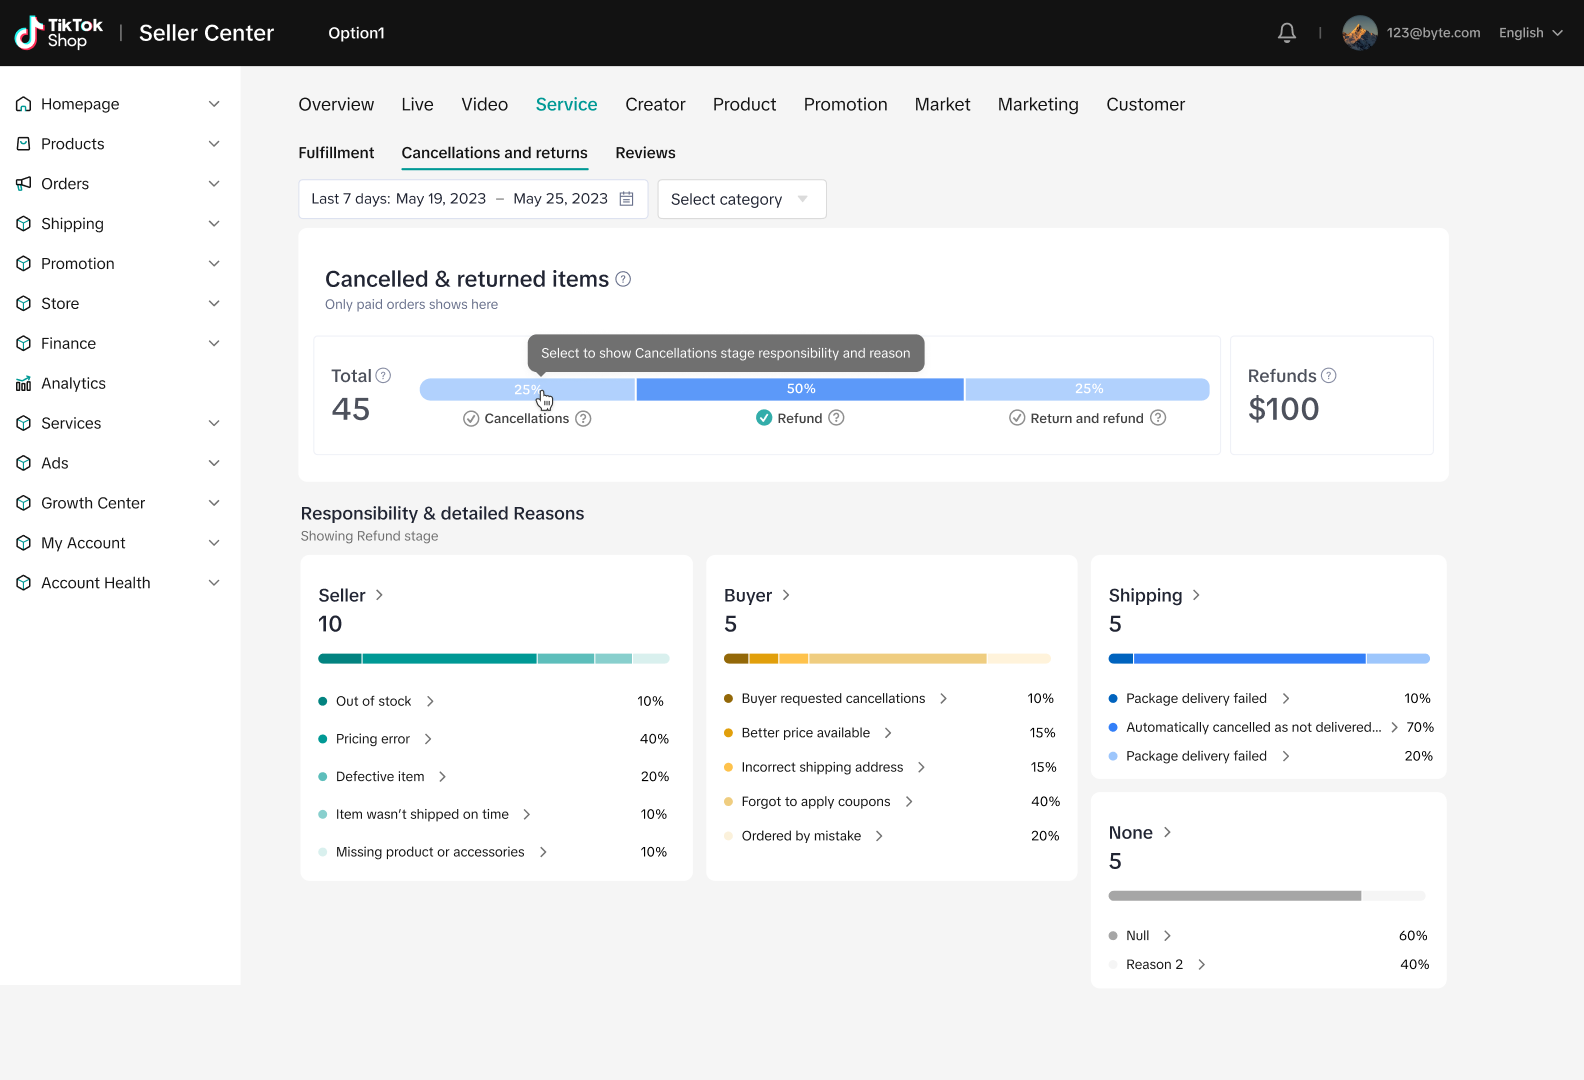
Select the time period and categories that you want to check, and then you will see:Cancelled & returned items:
- View the number of cancelled and returned items and refunds.
- Cancellations: the stage between "order paid" and "ready to ship" (shipping label is printed)
- Refund: the stage between "ready to ship" and "delivered"
- Return and Refund: after the order is delivered, the buyer has 30 days to return and obtain a refund.
- The middle of each stage in the bar chart shows the share of the total Cancelled & returned items
Hover on the "?" icon to see the definitions.
Responsibility and detailed reasons:
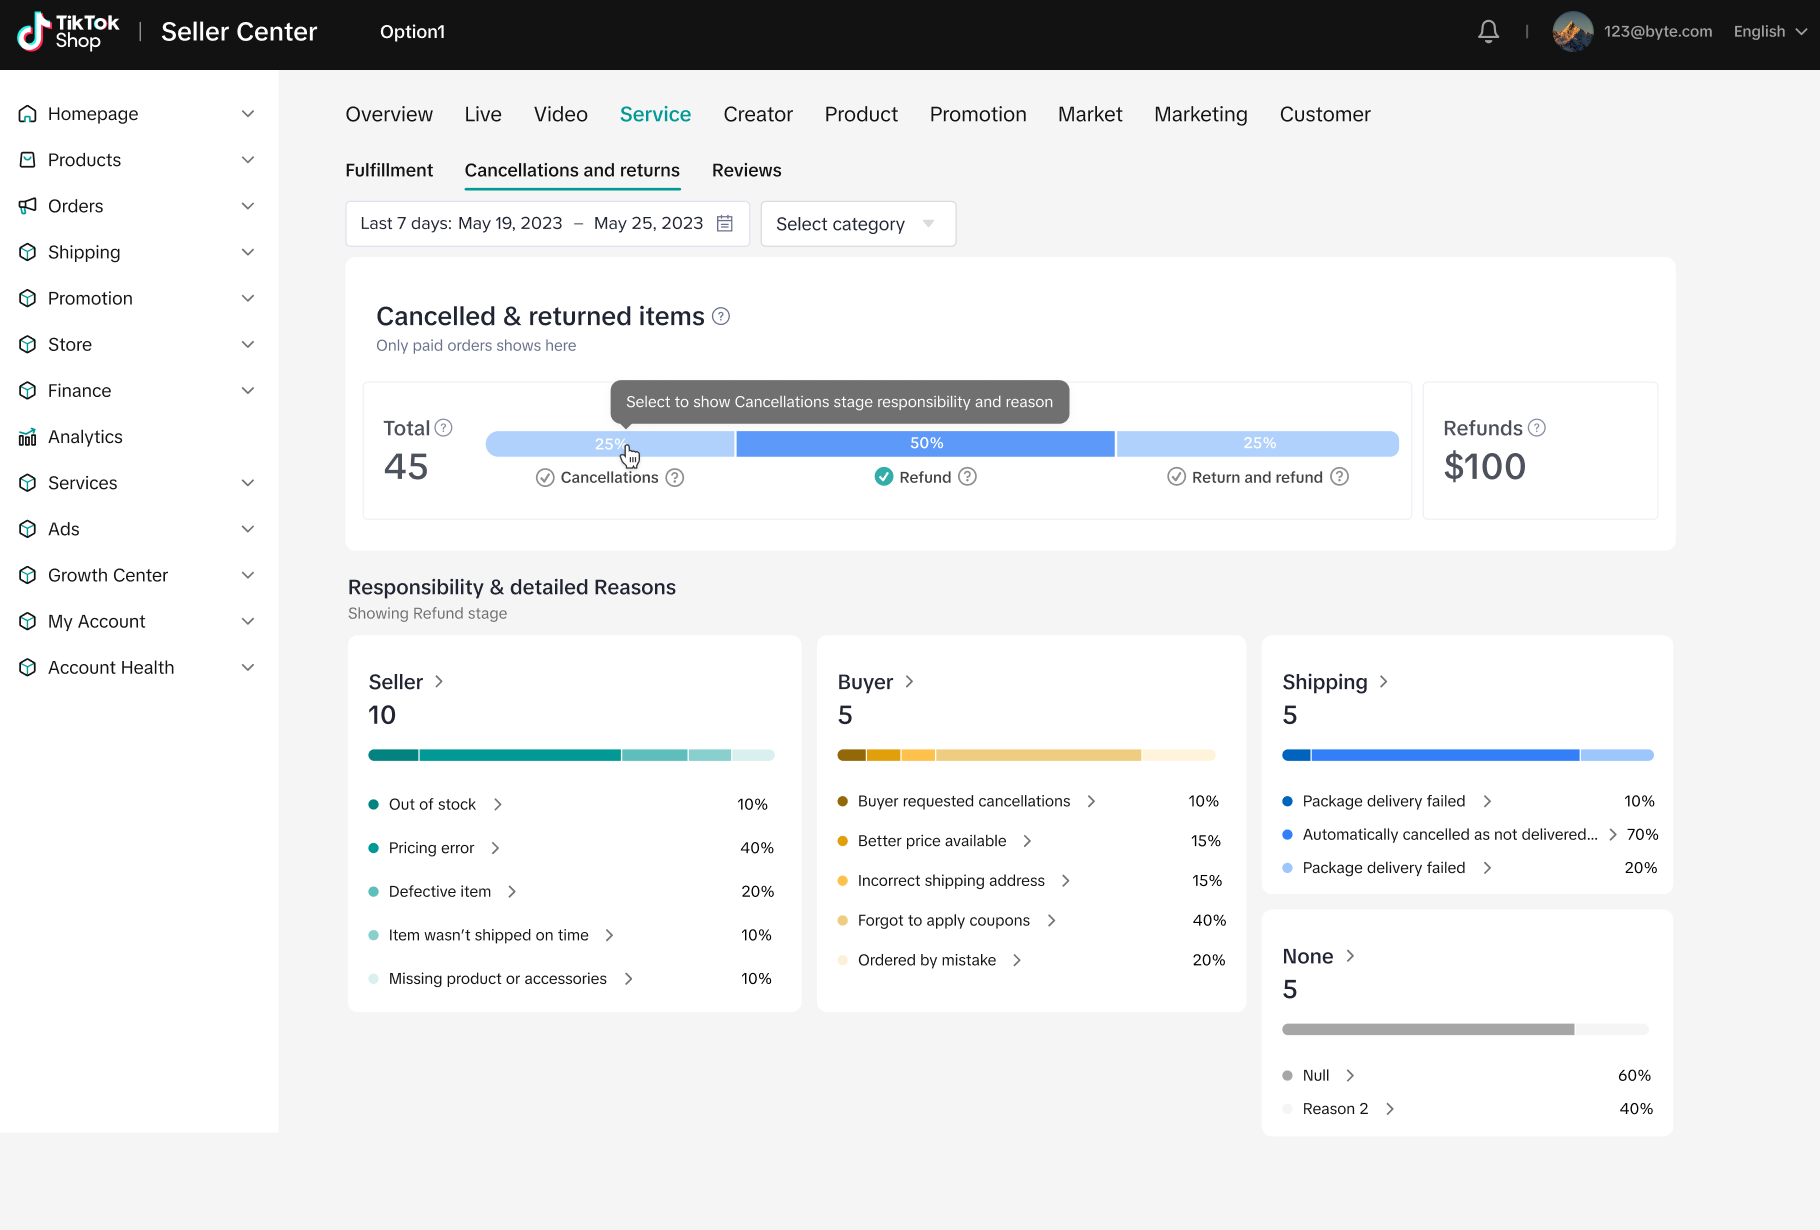
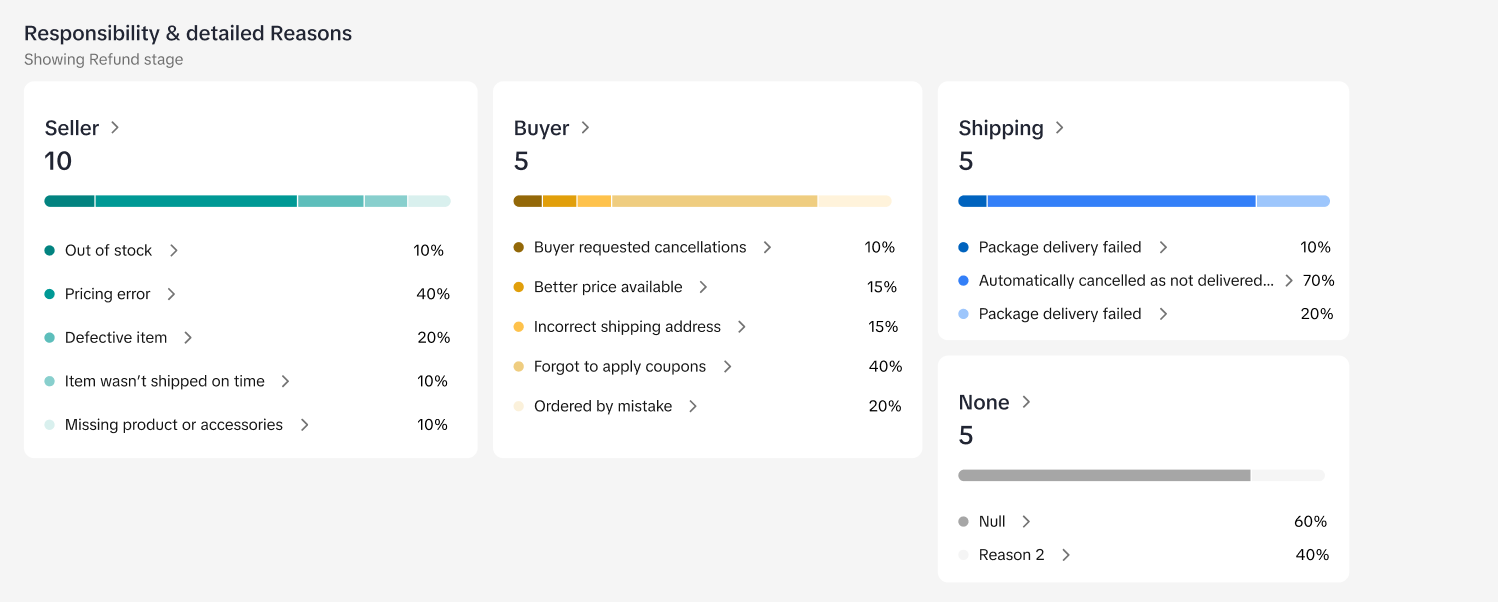
You can click to select and deep dive into the responsibility and reasons for the specific stage of the whole cancel and return flow.After selecting, you can view the cancel and return reasons and contributions under the responsibility role at each stage. Responsibility role refers to who is at fault for the cancellation and return of the item – by Seller, Buyer or Shipping. You can also view the reasons and contribution rate of the cancellations and refunds to identify the major issues.
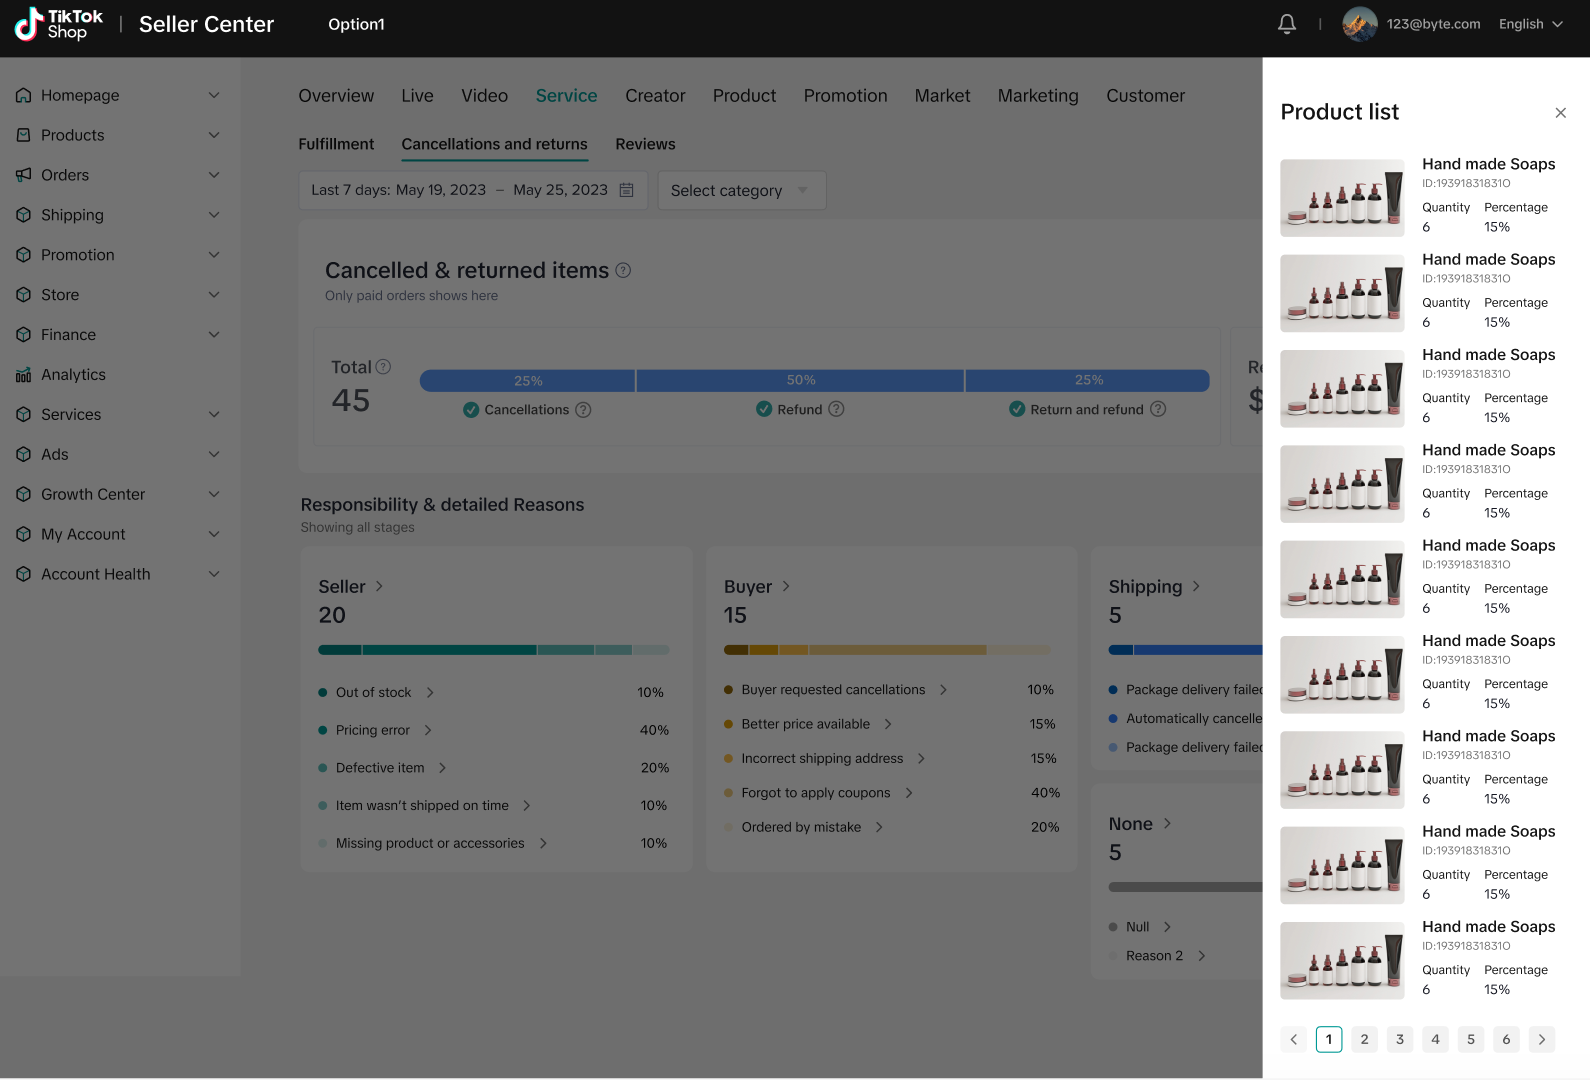
Product list
When you click on the Cancelled & returned responsibility or reasons in each progress bar chart, the related product list will appear on the right side of the page, including product name, product id, cancel return items, and the share of each. You can identify which products have more issues and then take action to improve the post-transaction services of your shop.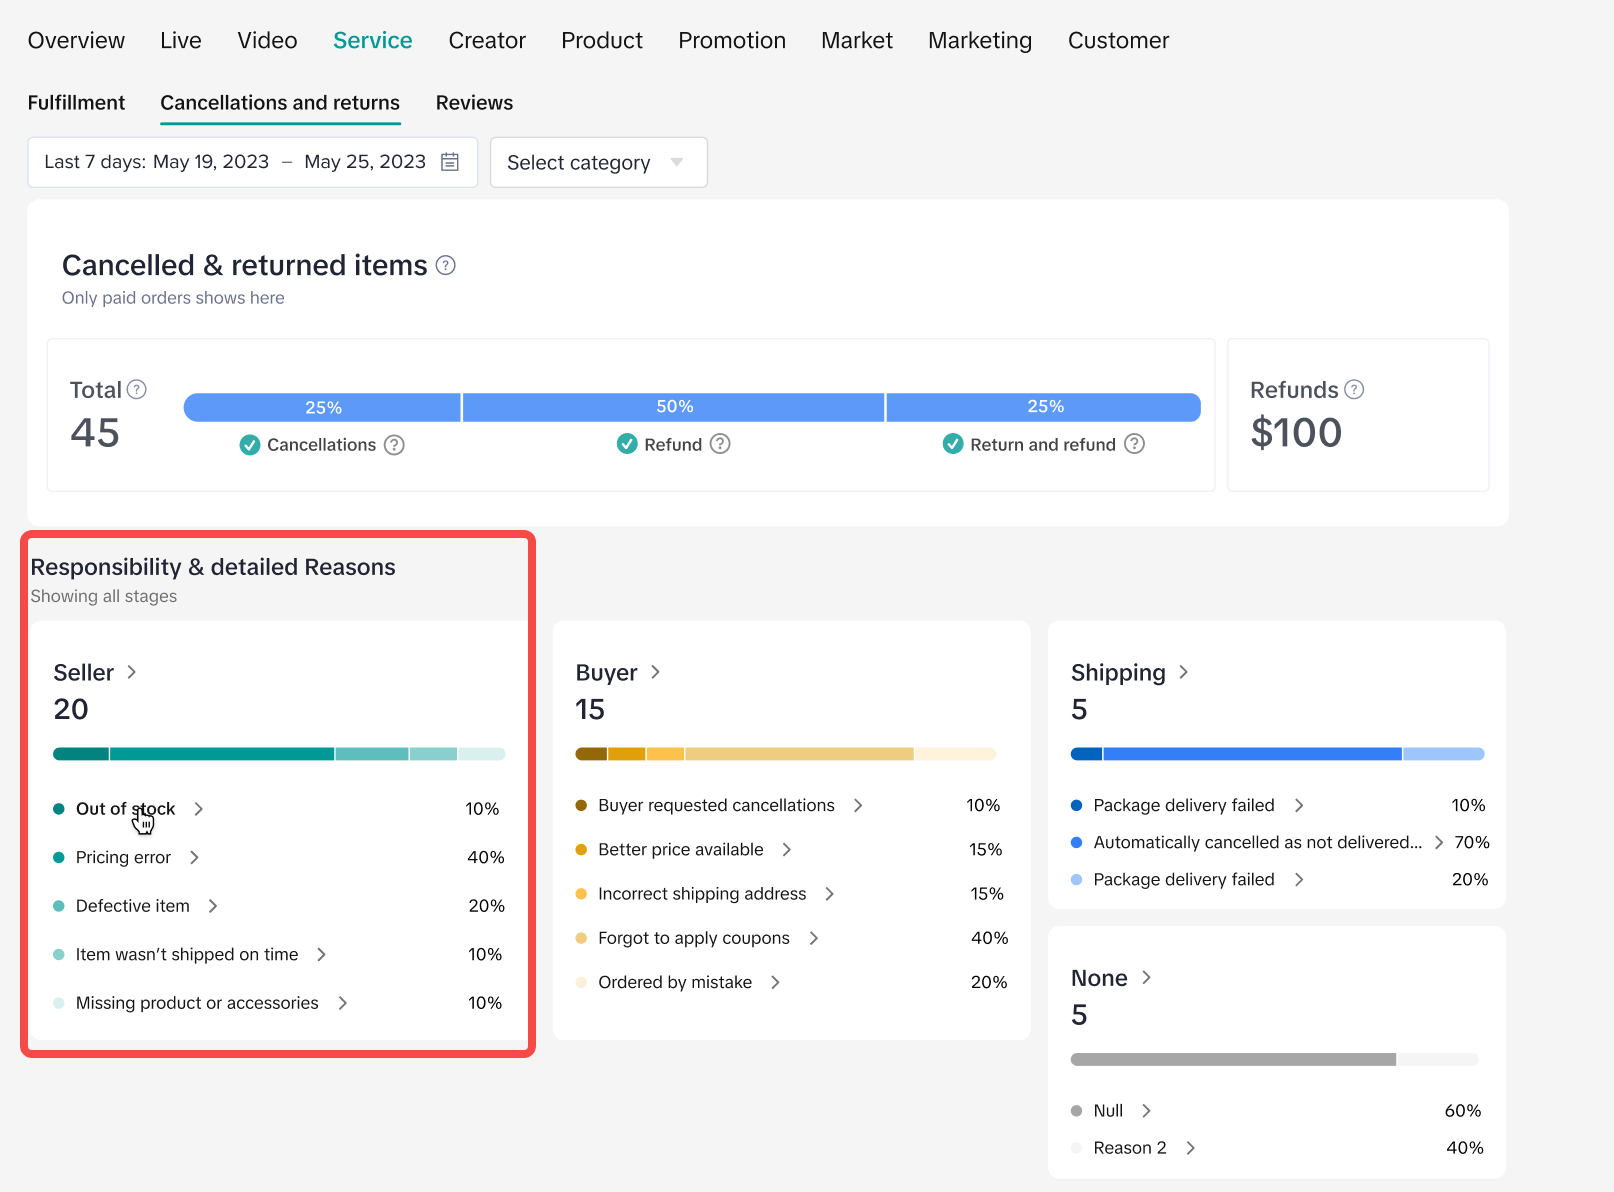
You may also be interested in
How to Leverage Complaints Analytics
The Complaints performance tab has been launched on Data Analytics - Post purchase Analytics. Here…

Guide to VoC (Voice of Customer) & VoC Case Study
Guide to Voice of Customer (VoC) Why Use Voice of Customer (VoC)? Voice of Customer (VoC) is a p…
![[Feature Guide] Seller Analytics | Product Traffic Analysis](https://p16-oec-university-ttp-sign.tiktokcdn-us.com/tos-useast5-i-fsvlofm1vi-tx/6a1d691e79ba4966b3f8aaba16fd700c~tplv-fsvlofm1vi-image.png?lk3s=5d1a069b&x-expires=2093029303&x-signature=oSv0YEMXdLSqaLkR4o%2FocWri3YU%3D&render=1778306958952)
[Feature Guide] Seller Analytics | Product Traffic Analysis
Background During previous research and interviews, we frequently received requests from merchants f…

How Does Product Card Diagnosis Work? - Enhance Competitiven…
Overview The Product Card Diagnosis feature is an effective way to analyze if a product card is perf…

How Does Product Card Diagnosis Work? - Content Operations
Overview The Product Card Diagnosis feature is an effective way to analyze if a product card is perf…

Shop Tab & Search Analytics
Access Shop Tab & Search Analytics here: https://seller-us.tiktok.com/compass/shop-tab The Shop Tab…

Sales Metrics Breakdown Logic Upgrade
What did we launch? We updated and unified the sales-metric attribution logic. This change ensures a…

Navigation Revamp Feature Relocation Guide
❓ What changed in Seller Analytics navigation The Seller Analytics navigation has been reorganized t…

Off-site Performance Analysis
Off-site Performance Analysis Report Overview Important Note: At this stage, the automated offsite p…
How to navigate Shop analytics in Seller Center
About the New Shop Analytics In previous versions, sellers often encountered challenges such as key…