How to Leverage Complaints Analytics
Summary
What is the purpose of the Complaints performance tab in TikTok Shop’s Data Analytics?
- It allows sellers to monitor complaint numbers and their distribution by complaint type, helping identify buyer dissatisfaction and areas needing improvement in their shop’s orders.
How can sellers use the Complaints dashboard to analyze complaints in detail?
- Sellers select time periods and categories to view total SKU orders with complaints, see complaint type contributions via ring charts, and drill down into level 2 and 3 complaint types for granular insights.
How does the product list feature help sellers address complaint issues?
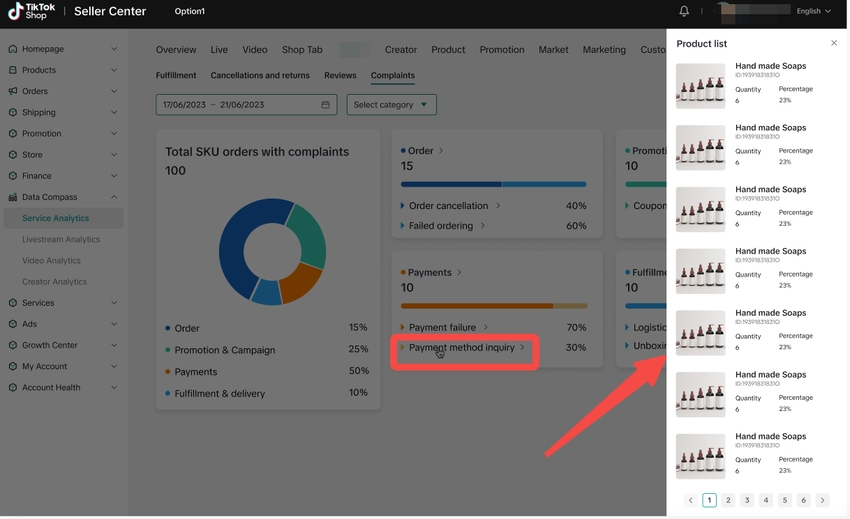
- Clicking complaint types reveals a detailed product list showing product names, IDs, complaint order numbers, and complaint shares, enabling sellers to pinpoint problematic products and take corrective actions.
What are the key complaint categories tracked in the dashboard, and why is this important?
- Categories include Complaint, Fraud & Risk Control, Order, Promotion & Coupon, After Sale, Payments, and Fulfillment & Delivery, helping sellers understand specific complaint sources to improve overall shop performance.
The Complaints performance tab has been launched on Data Analytics - Post purchase Analytics.
Here you can:
Monitor the complaint numbers and contributions in your shop
View the main issue products that need improvement
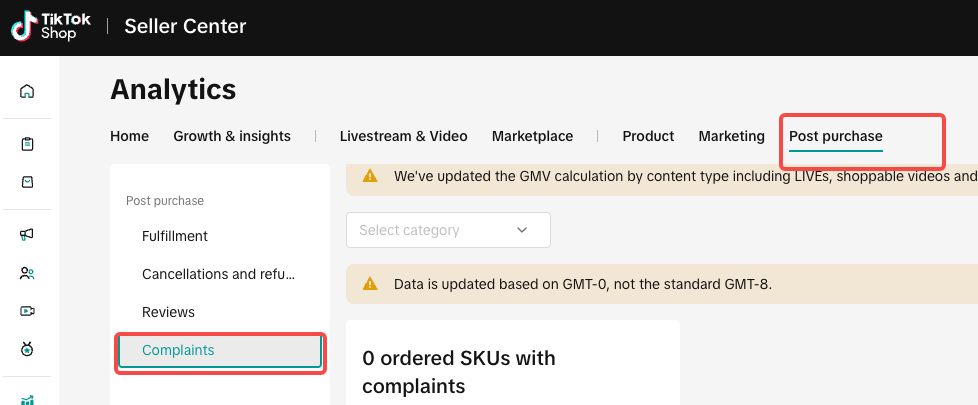
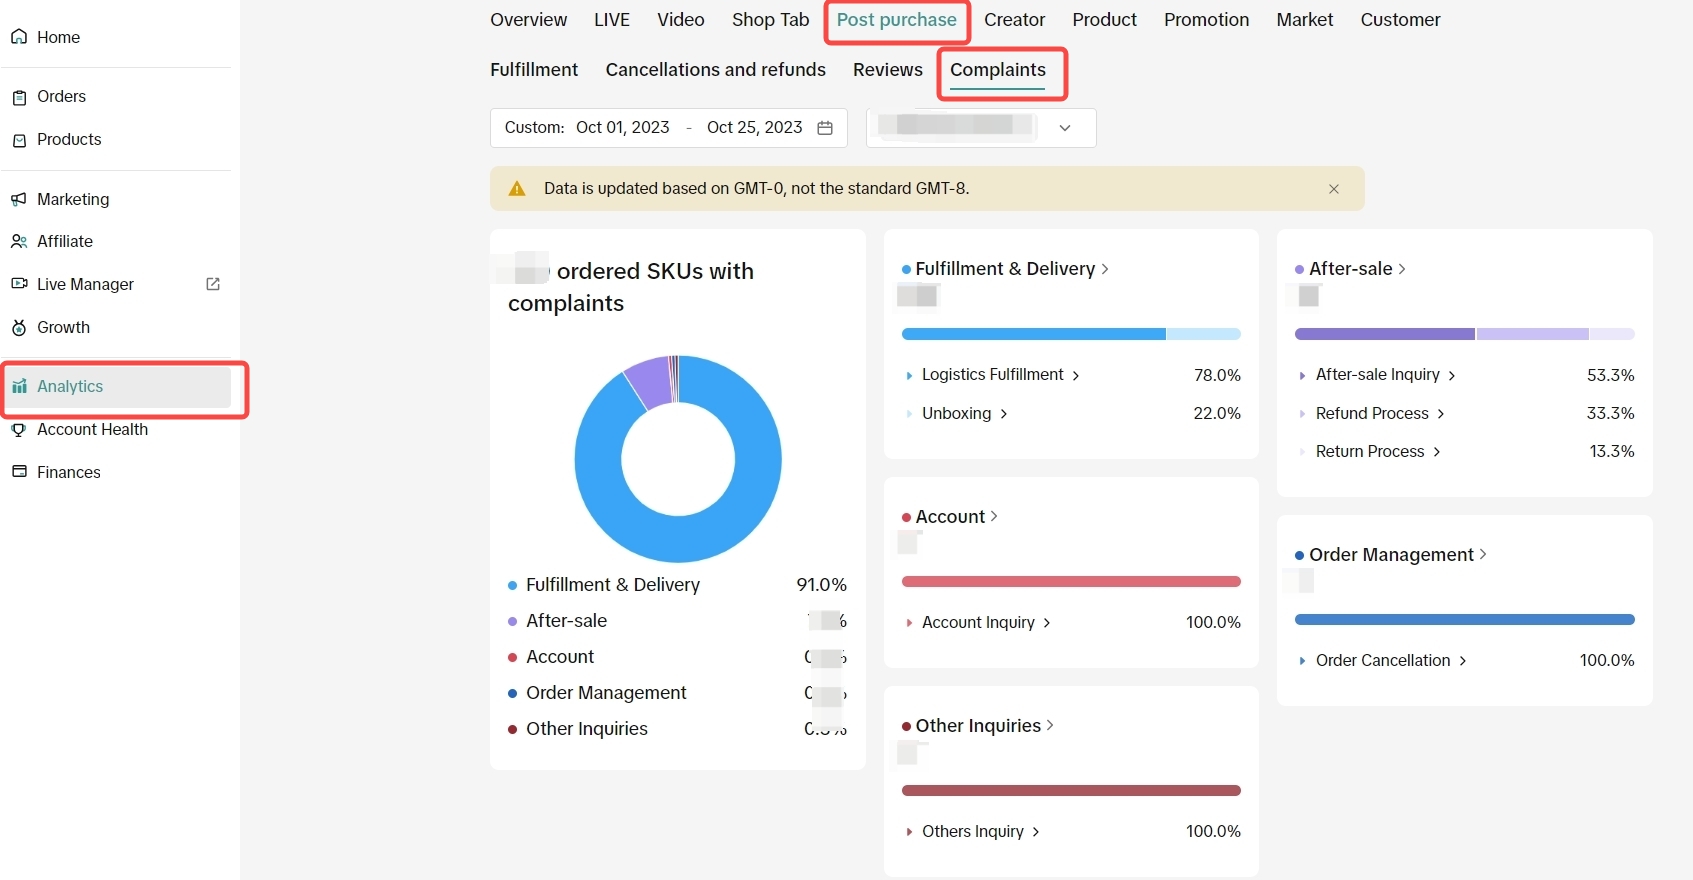
Access this feature here
.
How to use the Complaints dashboard
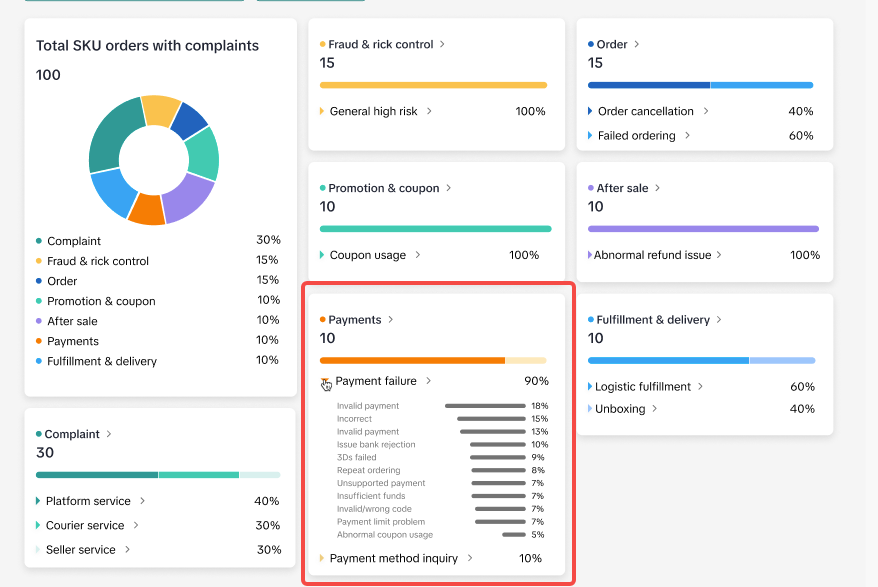
Select the time period and categories that you want to check, and then you will see:- Aggregate complaint numbers and contributions:
- View the total SKU orders with complaints of your shop in the selected category within the selected time range.
- Check the ring chart to see the contributions of level 1 complaint types:
- Complaint
- Fraud & risk control
- Order
- Promotion & coupon
- After sale
- Payments
- Fulfillment & delivery
- Each complaint block provides the absolute SKU orders with the specific type of complaint
Hover on the "?" icon to see the definitions.
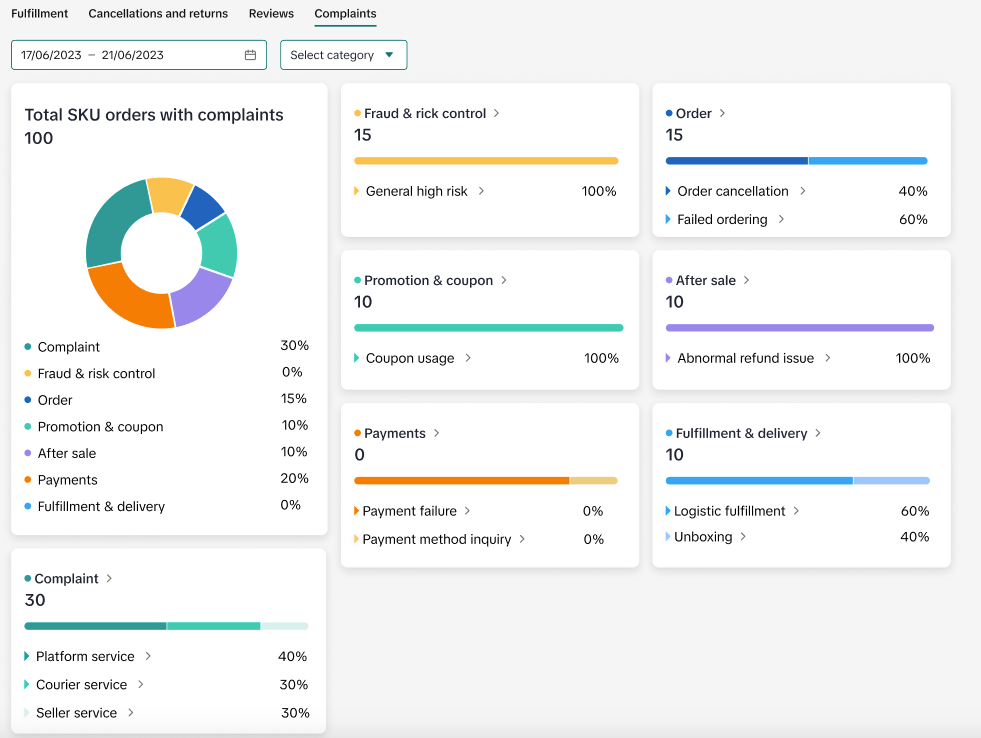
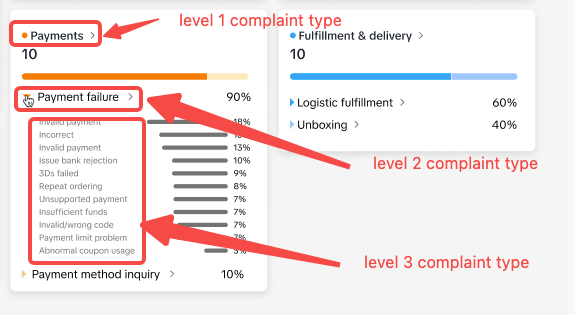
- Drill down by level 2 & 3 complaint types:
Click on the triangle button beside the level 2 complaint name to see the level 3 complaint types and contributions.
- Product list