

How to use LIVE Dashboard to monitor LIVE Performance
Summary
What is the purpose of the unified LIVE dashboard on TikTok Shop?
- The unified LIVE dashboard provides a comprehensive solution for tracking LIVE performance metrics, trends, traffic, conversion, and product-level performance during and after a LIVE session.
- It consolidates essential analytics in one location, helping creators and sellers enhance their LIVE performance.
What are the key features and functionalities of the unified LIVE dashboard?
- Users can monitor high-level financial, traffic, and conversion metrics, customize metrics, and track audience engagement trends in real-time.
- The dashboard offers insights into traffic channels, conversion funnels, audience demographics, product performance, violations, and promotions.
How can creators and sellers access and utilize the unified LIVE dashboard?
- The dashboard is accessible to all TikTok Shop creators/sellers performing Shoppable LIVEs on PC, with real-time insights available through the app.
- Users can access it during an ongoing LIVE via the LIVE Manager on Streamer Desktop or after completion through Livestream Analytics.
What changes have been made from the previous versions of the LIVE dashboard?
- The interface has been simplified for easier navigation between basic and advanced views, retaining all existing data elements.
- Enhancements include more intuitive navigation and robust analysis capabilities, translating previous widgets into new tabs.
How does the dashboard help in addressing violations and managing giveaways during LIVEs?
- Users can view violations, reasons, and system-generated remediations, with options to appeal directly from the dashboard.
- The dashboard tracks giveaway effectiveness and allows users to initiate new giveaways directly from the interface.
High level overview
Are you looking for the solution to tracking your LIVE performance comprehensively, during and after your LIVE. Look no further!Introducing the unified LIVE dashboard on PC that aims to be the one-stop solution for monitoring your LIVE performance. From tracking the status and trends for important LIVE metrics, to understanding traffic and conversion and monitoring product item level performance and violations, the LIVE dashboard will aim to consolidate all your essential LIVE analytics in one location. Read on to learn more on how the dashboard can help you level-up your LIVE performance.
Feature value proposition
At a high level, the market insights functionality gives Creators/Sellers the ability to- Gain high-level overview of all your key LIVE metrics during and after your LIVE completion
- Understand trends and breakdowns related to your LIVE traffic, trends related to user viewing and conversion funnels for your products
- Continue to utilize the LIVE dashboard to understand salient metric trends throughout the LIVE and cross-check trends with key events (such as violations, pins and promotions) to understand key drivers for metric trend deviations.
- Get detailed breakdowns of your product level performance, real-time drilldowns of violations and information for giveaways during and after your LIVE
Salient use cases
The following use cases will be the most relevant for Creators/Sellers using the unified LIVE dashboard on PC.Use Case 1: Track and monitor high level LIVE performance metrics
Objective: Understand performance and discern broad issue areas- Users will be able to view and monitor the high-level financial, traffic and conversion metrics, at one glance, during and after the LIVEs
- Users can customize the metrics they see to provide more tailored visibility of important LIVE performance factors
Use Case 2: Identify and understand trends for your LIVE
Objective: Understand the rhythm of the LIVE in real-time and take action to course correct.- Track the patterns for how your audience is engaging with your LIVE by tracking the trends of engagement indicators throughout your LIVE
- Select specific LIVE metrics to look at variation patterns and understand which metrics need attention or improvement at specific points in the LIVE
- For all of the trend information, users can select specific pre-available time durations/segments to target their trend analysis for periods of interest in the LIVE.
- Cross-check trends with important events during the LIVE to understand how these events are affecting LIVE metric performance.
Use Case 3: Deep-dive into traffic, conversion and demographic patterns
Objective: Understand user profile and associated traffic patterns for your LIVE- Users can explore which traffic channels (paid or organic) are driving audiences to their LIVEs, allowing for better prioritization of traffic targeting strategy
- Keep tracking your conversion funnel from impressions to checkout and understand where there are conversion bottlenecks that need to be addressed.
- Explore your audience profile to identify your audience's composition and tailor your strategy either to appeal to these audiences or target users with lesser engagement.
Use Case 4: Investigate product, violations and promotions information for LIVEs
Objective: Look at product performance to prioritize products effectively and initiate giveaways or address violations to boost LIVE performance.- Users can track key metrics for individual products and take actions to pin products as well as view system-generated scripts for product talking points
- Users can achieve an overview of their violations throughout the LIVE, coupled with reasons for violations, system-generated remediations and action buttons for raising an appeal to contest individual violations, all from the same location
- Track the status of product performance during giveaways to investigate their effectiveness and which products are generating interest. Users can even start a new giveaway directly from this interface as well.
Use Case 5: Replay your LIVE with LIVE broadcast and track comments in real-time
Objective: Track user sentiments and address inquiries in real-time- Watch your LIVE replayed in real-time or watch the entire broadcast after your LIVE and track user comments in real time to understand user sentiments and craft engagement strategy with your audience.
- Trend information is dynamically linked with the broadcast interface, allowing users to click areas on the trend timeline to be navigated to that exact point in the replay.
Access and authorization
All Creators/Sellers on TikTok Shop and creating Shoppable LIVE content will have access to the unified LIVE dashboard. Currently, the functionality will only be available in the PC version but real-time insights during the LIVE will be available through the APP real-time LIVE insights feature.Entrance
During an ongoing LIVE
The unified LIVE dashboard can be accessed during your ongoing LIVE from the LIVE Manager on Streamer Desktop by clicking on the highlighted action button for the dashboard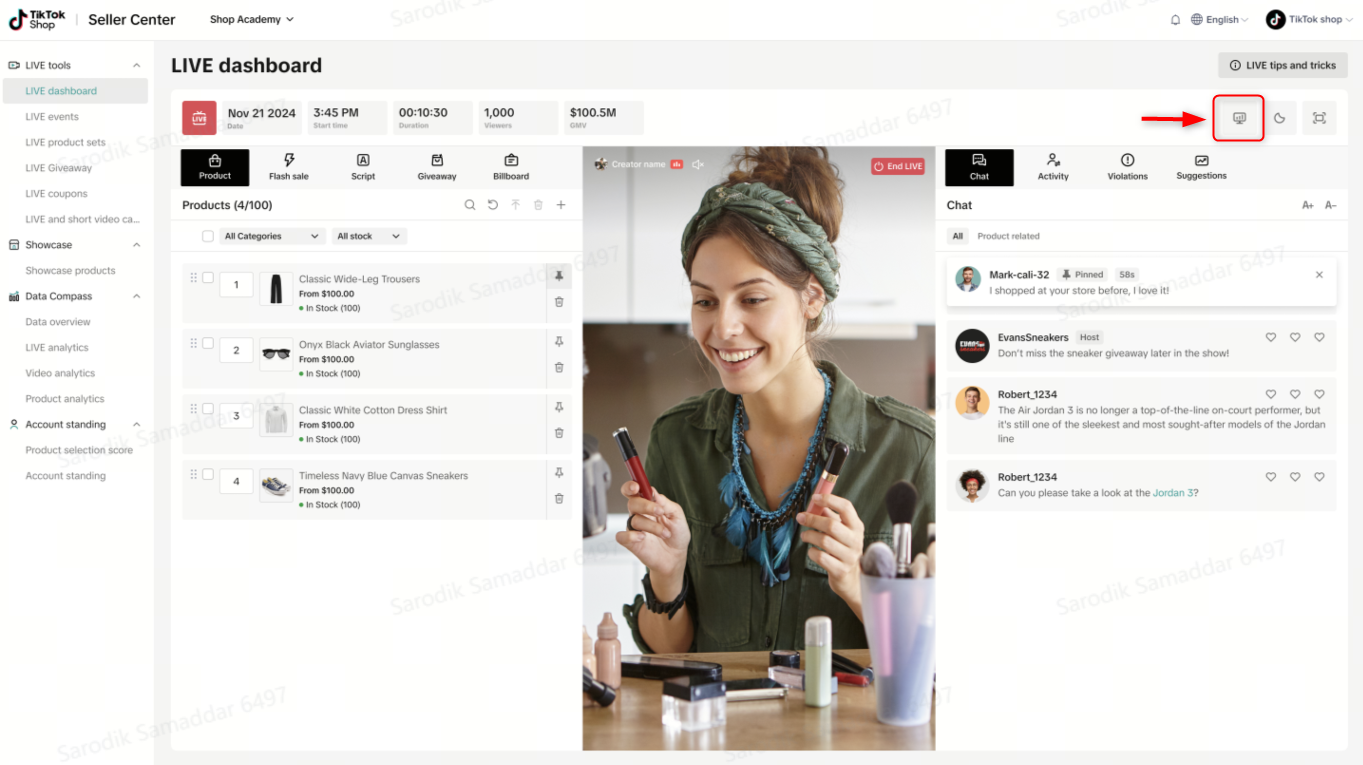
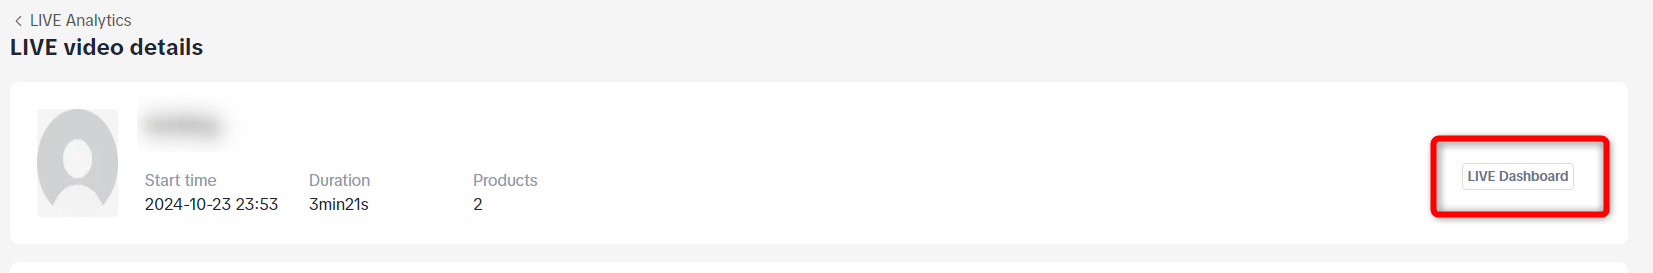
After LIVE completion
After your LIVE is completed, navigate to Livestream Analytics on Streamer desktop and select the individual LIVE room you wish to diagnose. Follow the trail below to be navigated to the unified LIVE dashboard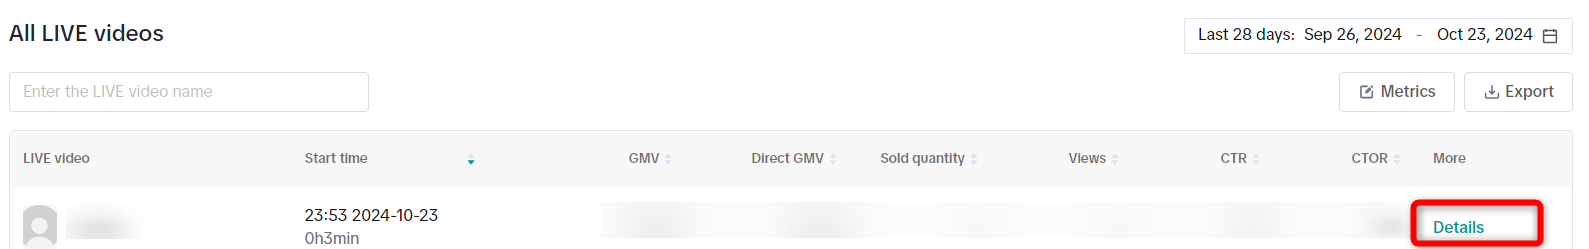
What has changed from the previous versions of the dashboard?
The previous interface of the LIVE dashboard contained two different interfaces - a Basic version for critical metrics and data trends and an advanced version for more detailed trends analysis and product, violation, promotion level information.At present, we have simplified the interface so that users can navigate between these two views very easily and more intuitively. Please be aware that Creators will be able to view all existing data elements from the previous interface in this new iteration of the LIVE dashboard.
| Previous version interface navigation | Current version interface navigation |
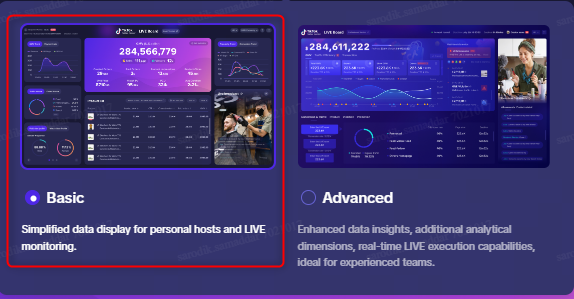 | 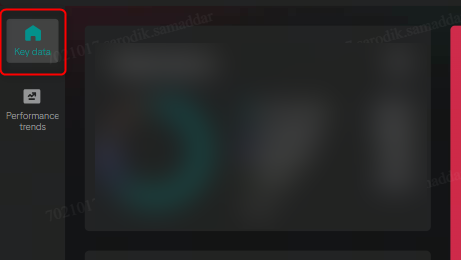 |
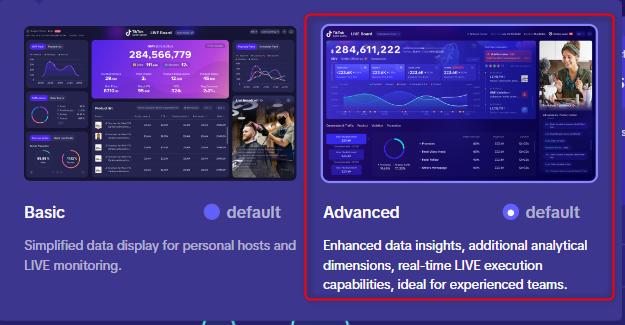 | 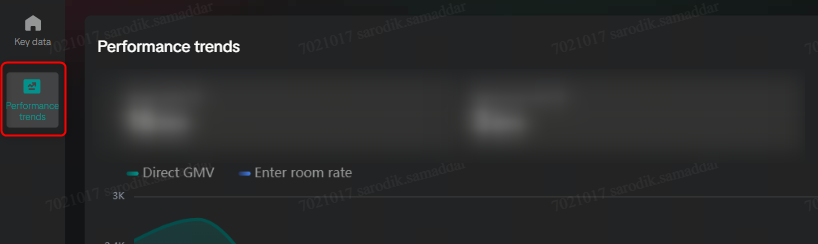 |
Coupled with this interface entrance change, we have also introduced further optimizations and enhancements to make your LIVE room analysis more robust and intuitive. Read on to learn more.
Feature walkthrough
Room level actions
At the top right of the console are a few action buttons. The details of these functionality are detailed below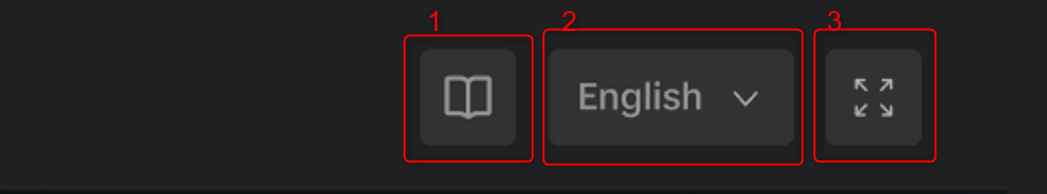
- User Manual: Click on this to navigate to the user manual for the dashboard
- Language: Select the language for the dashboard interface
- Full screen: Enlarge the dashboard to full-screen on your device
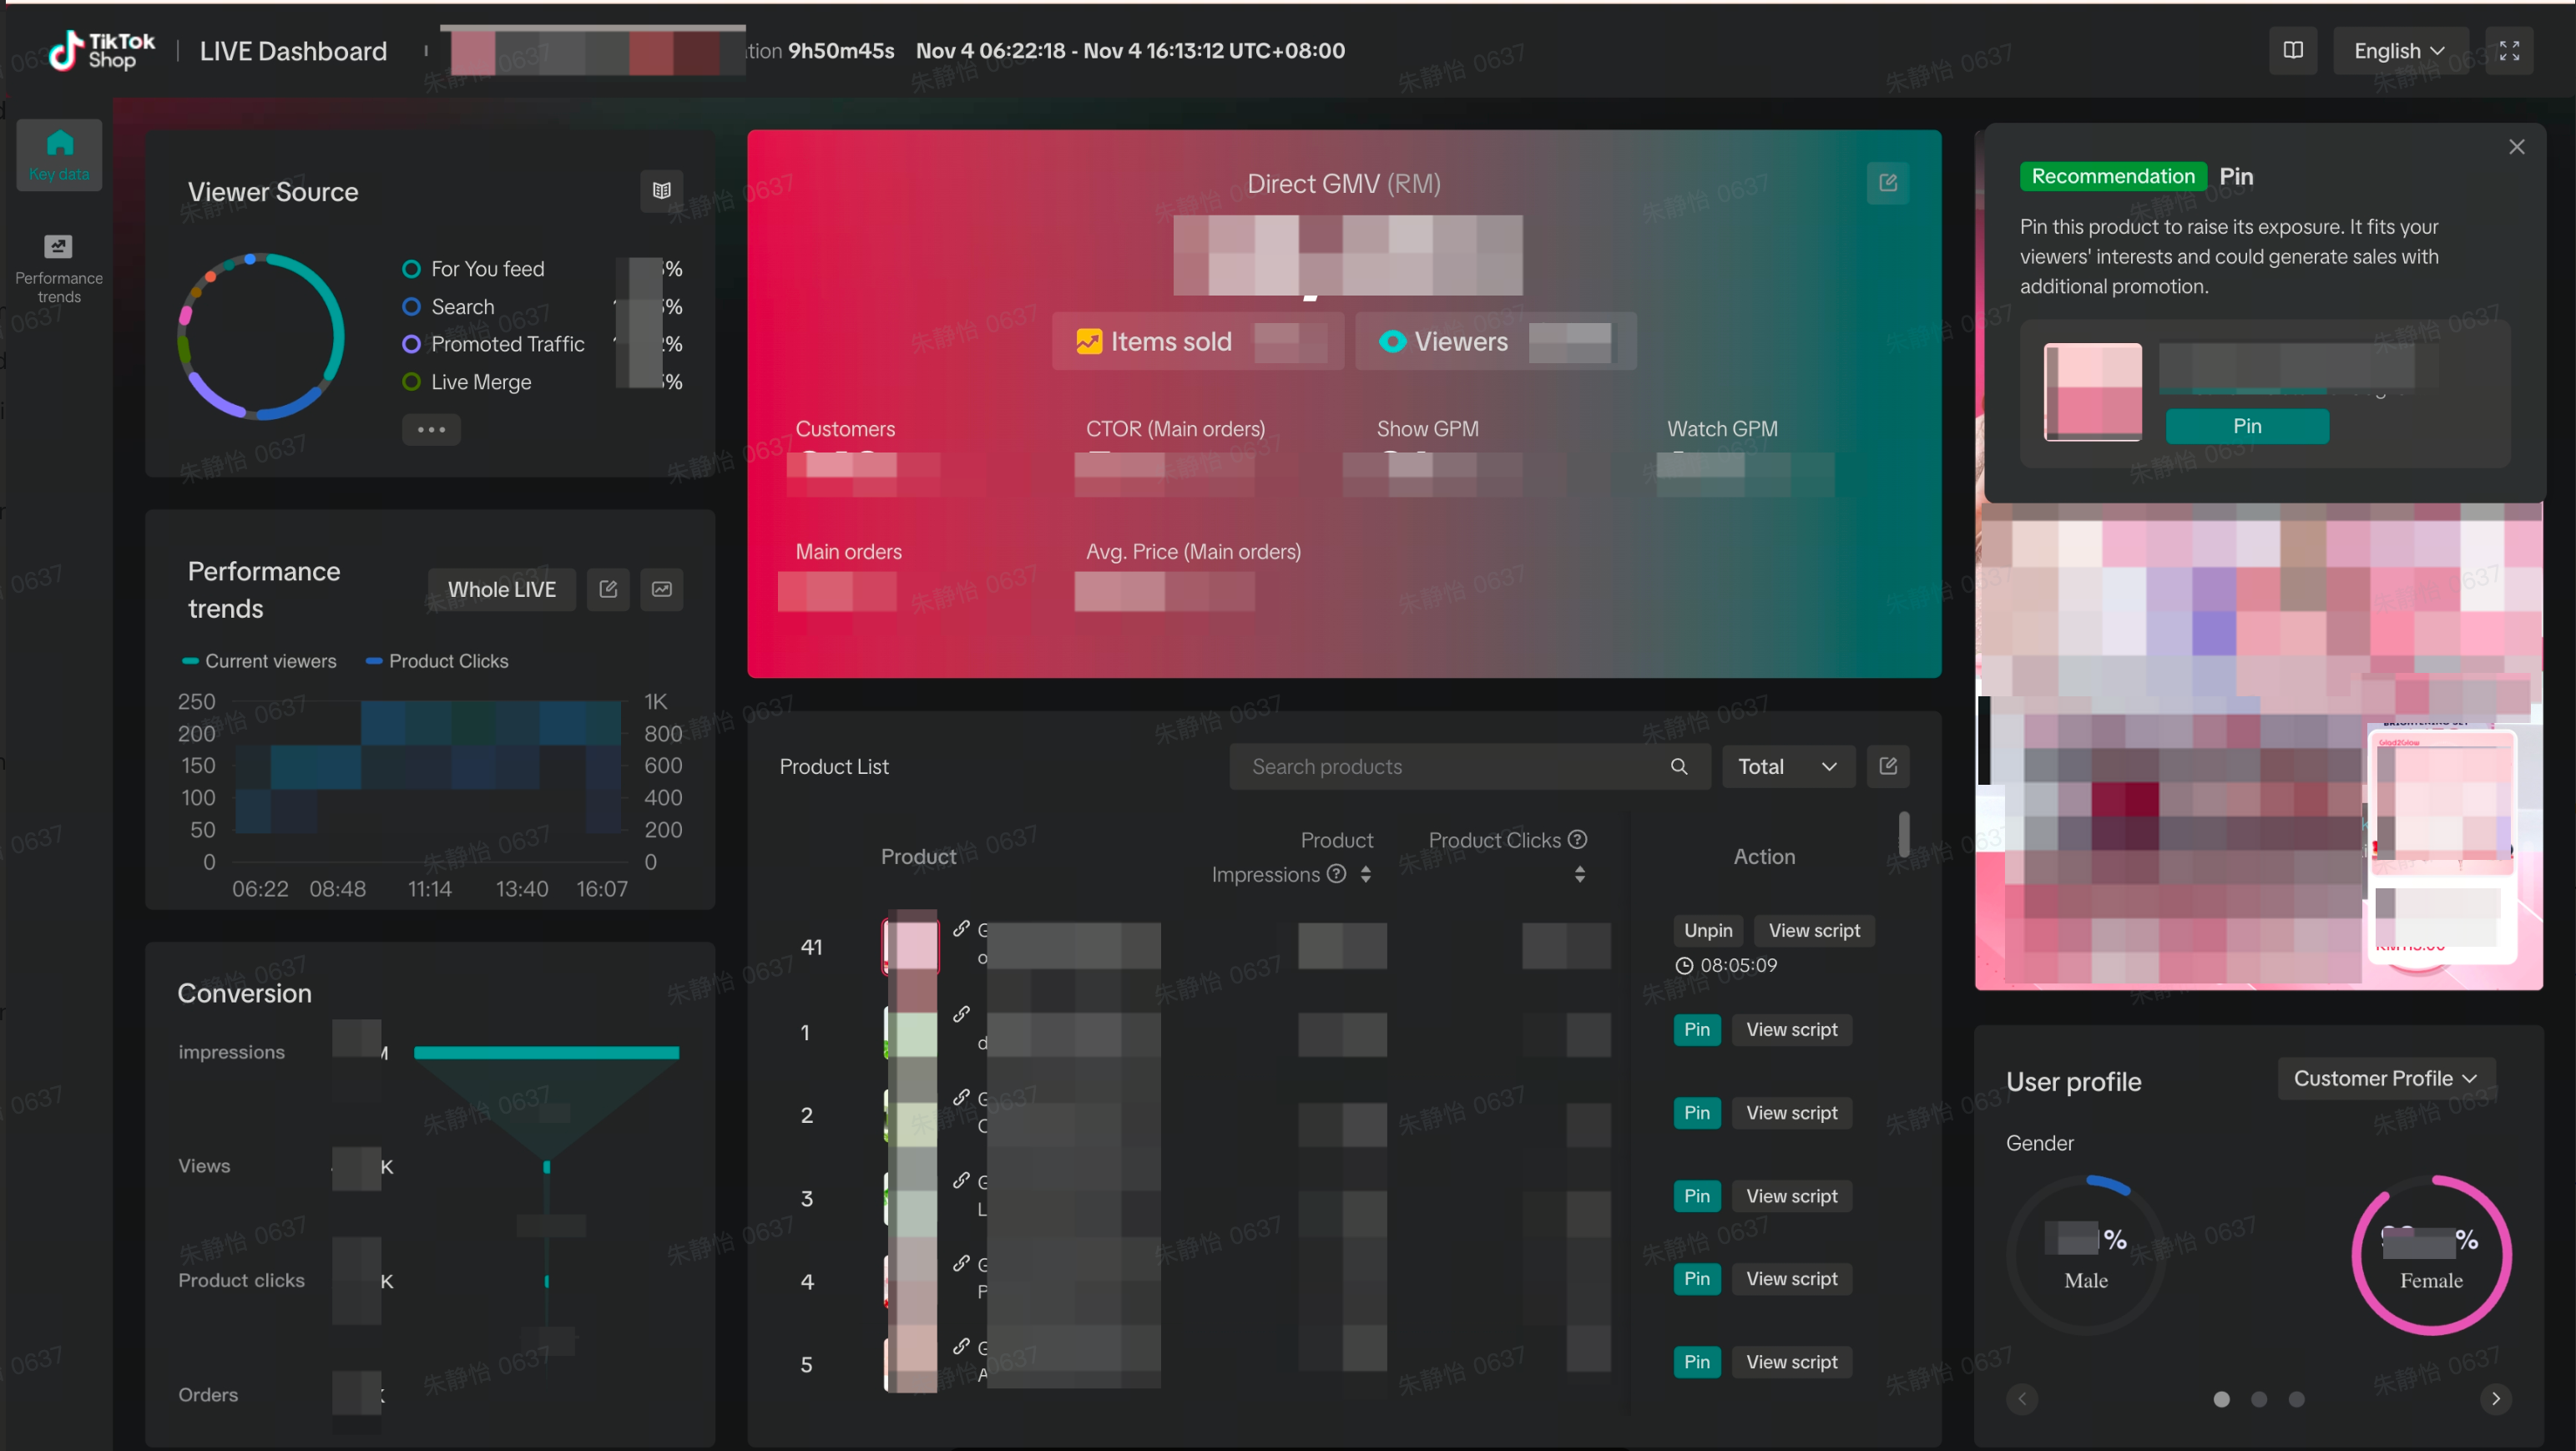
Key data tab
| Functionality/Component | UI interface | Key functionalities/capabilities |
| Overview module | 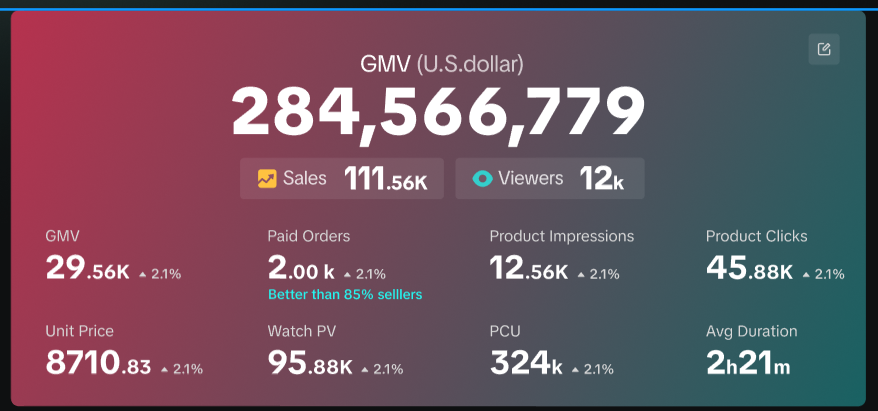  |
|
| Traffic synopsis | 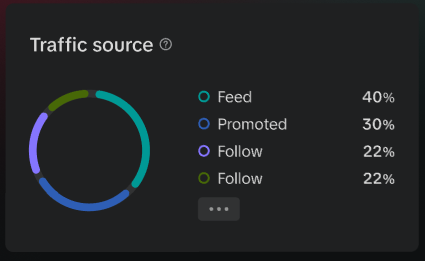 |
|
| View performance trend analysis | 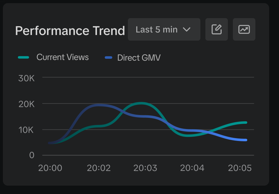 |
|
| Conversion analysis | 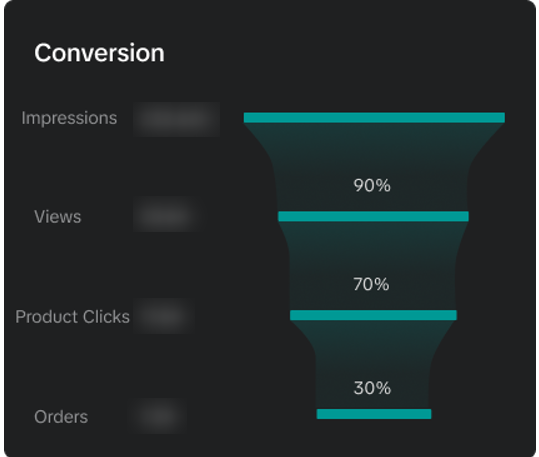 |
|
| Product detail module | 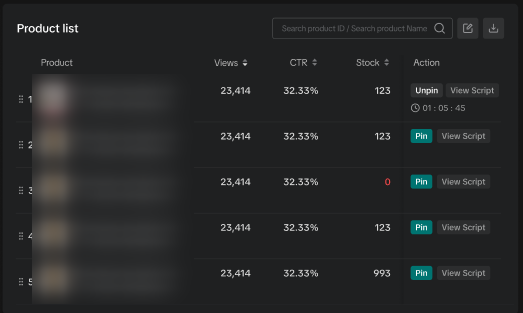 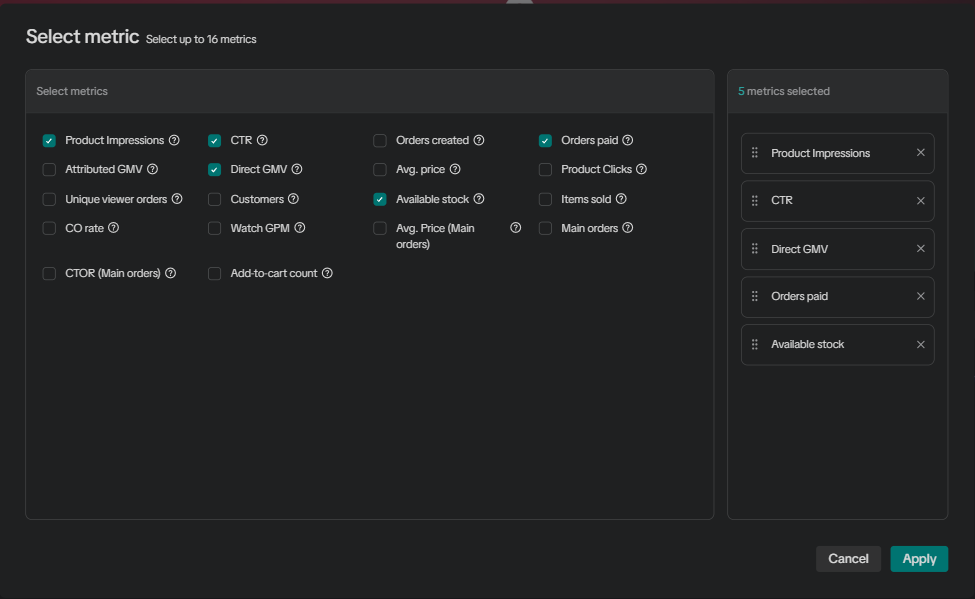 |
|
| Real time recommendations | 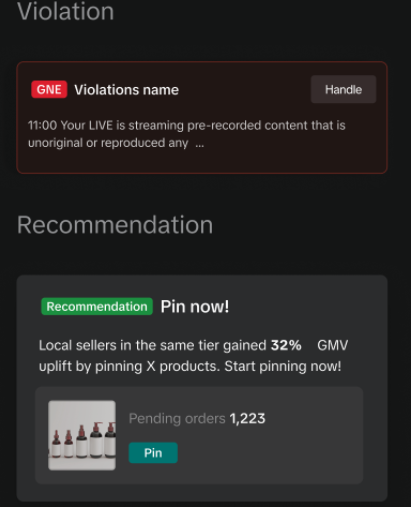 |
|
| LIVE broadcast | 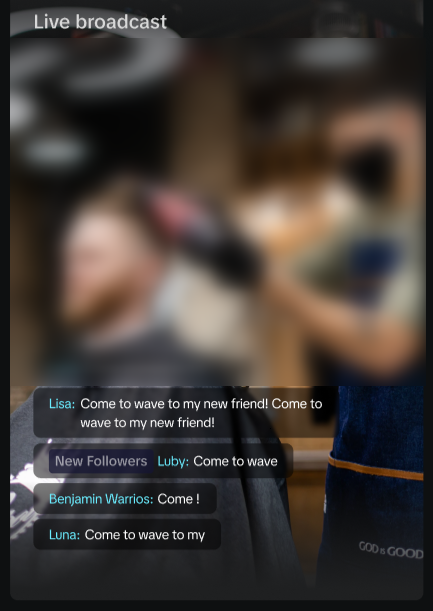 |
|
| User profile breakdown | 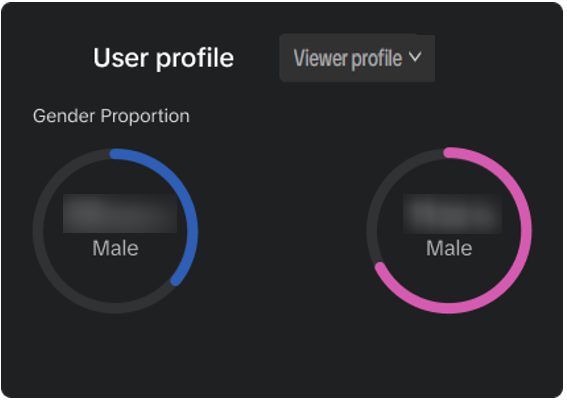 |
|
Performance trends tab
| Functionality/Component | UI interface | Key functionalities/capabilities |
| Trend master view | 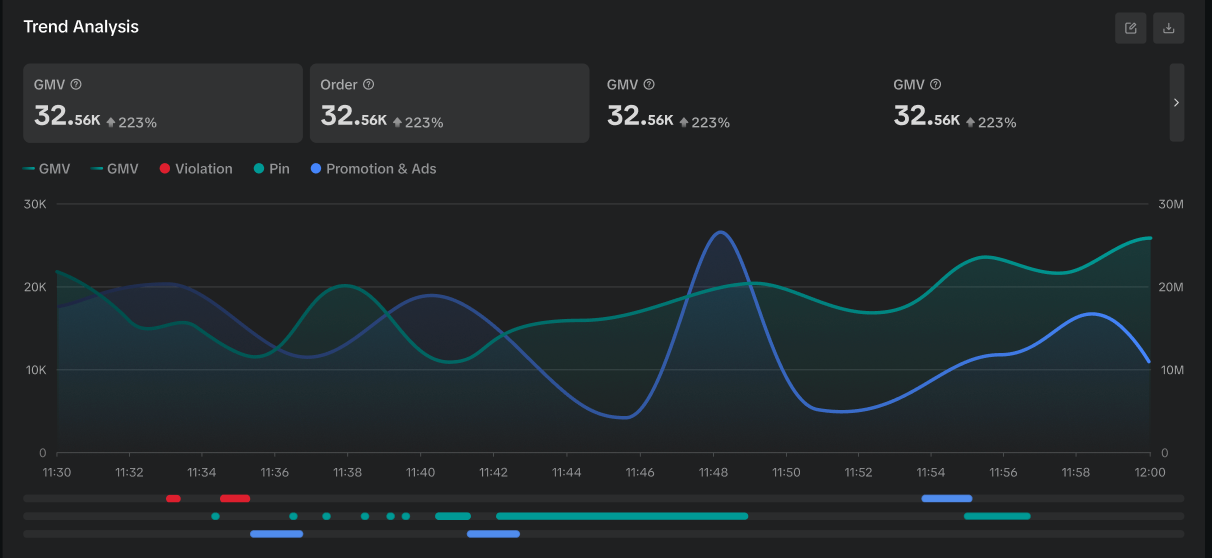 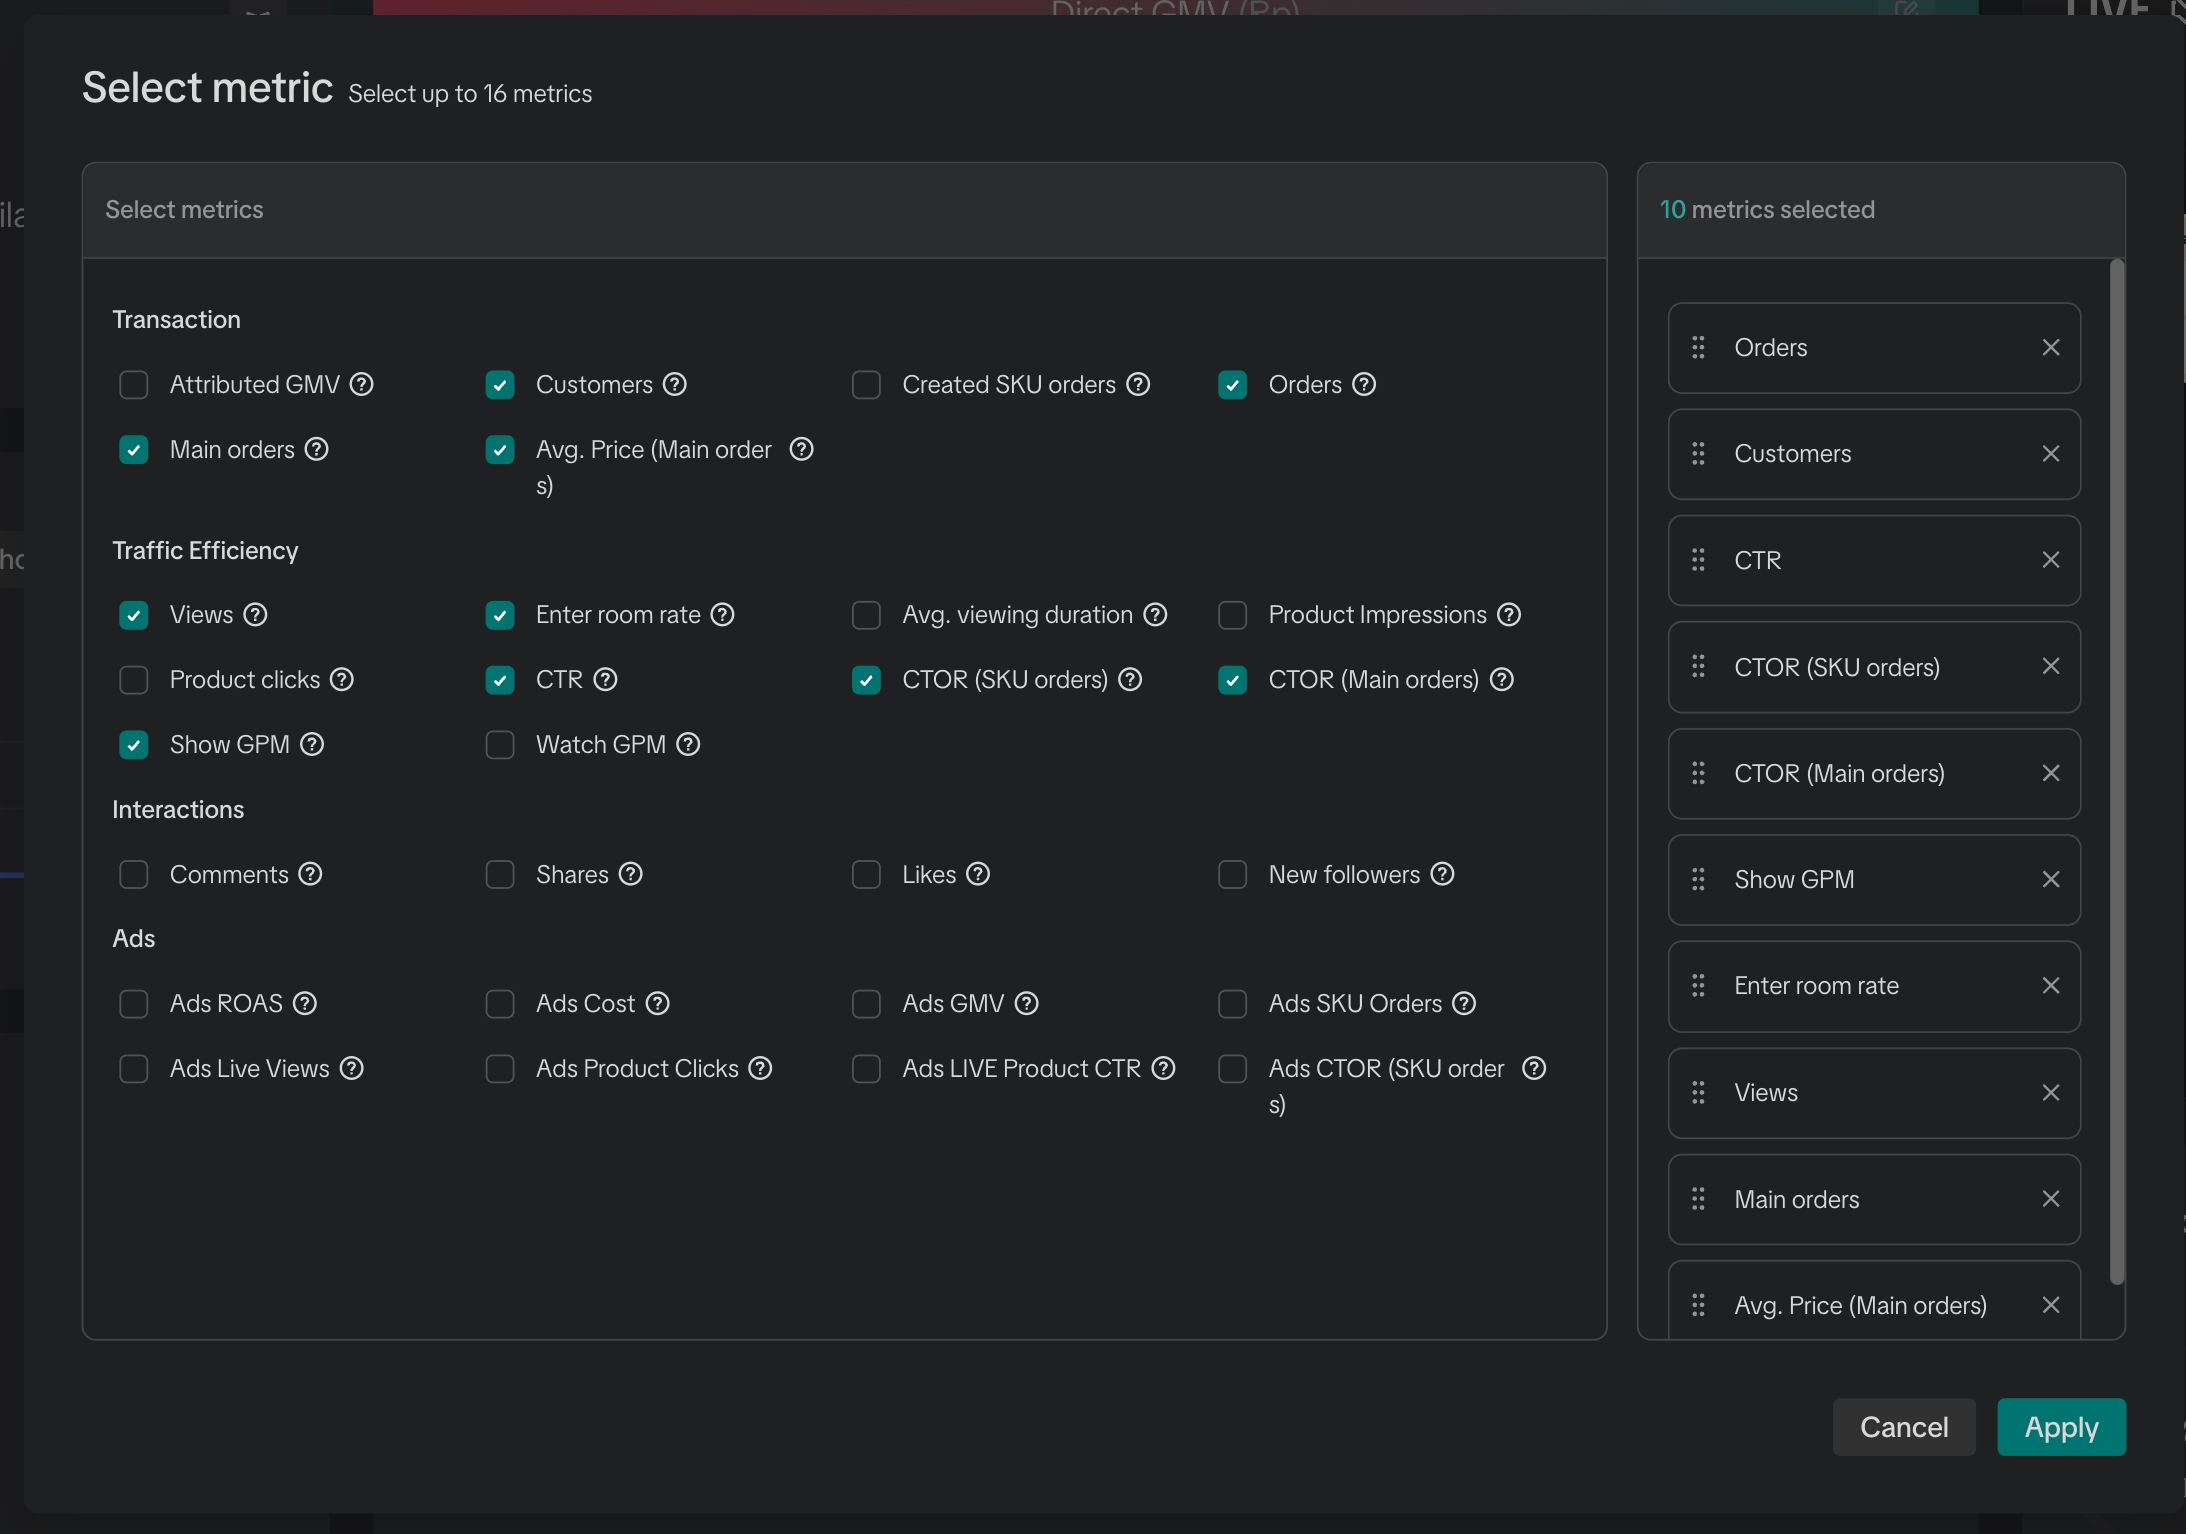 |
|
| Product information | 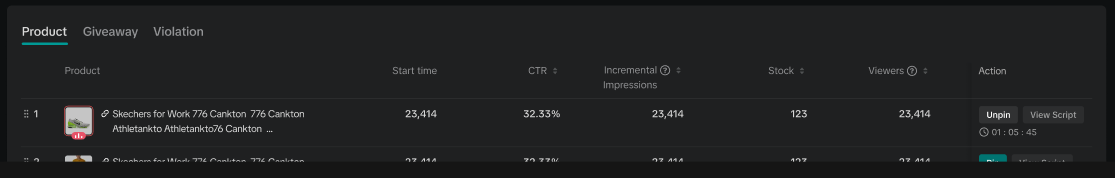 |
|
| Violation information | 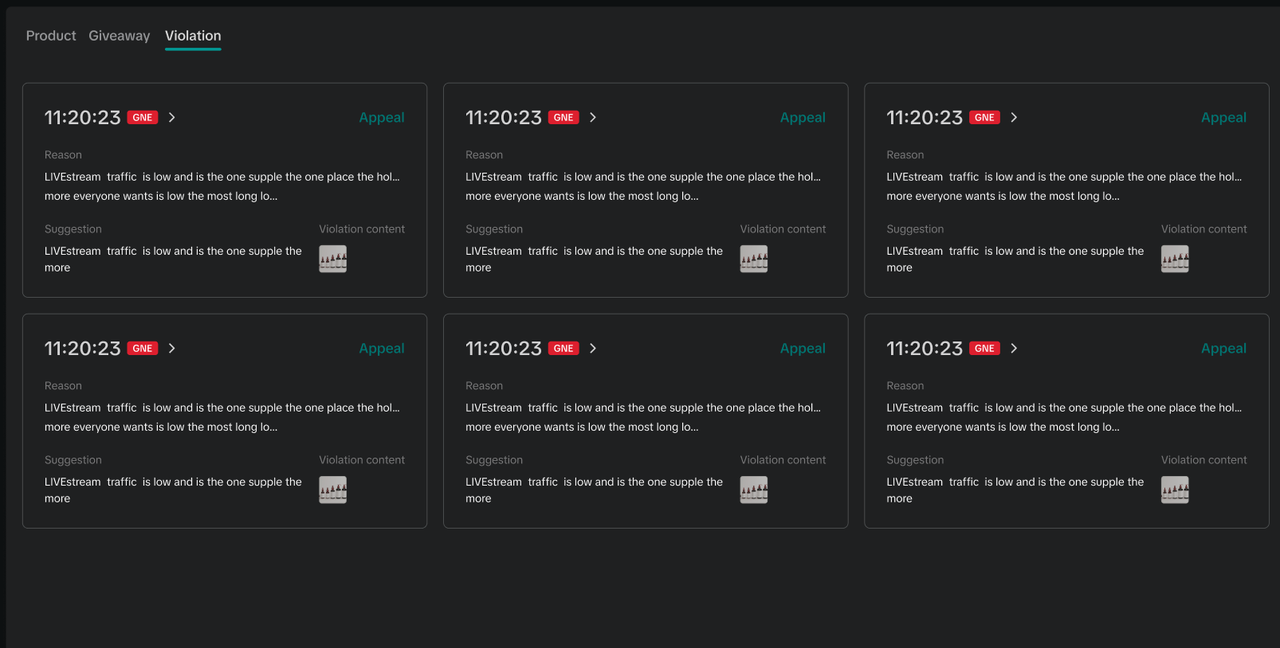 |
|
| Giveaways | 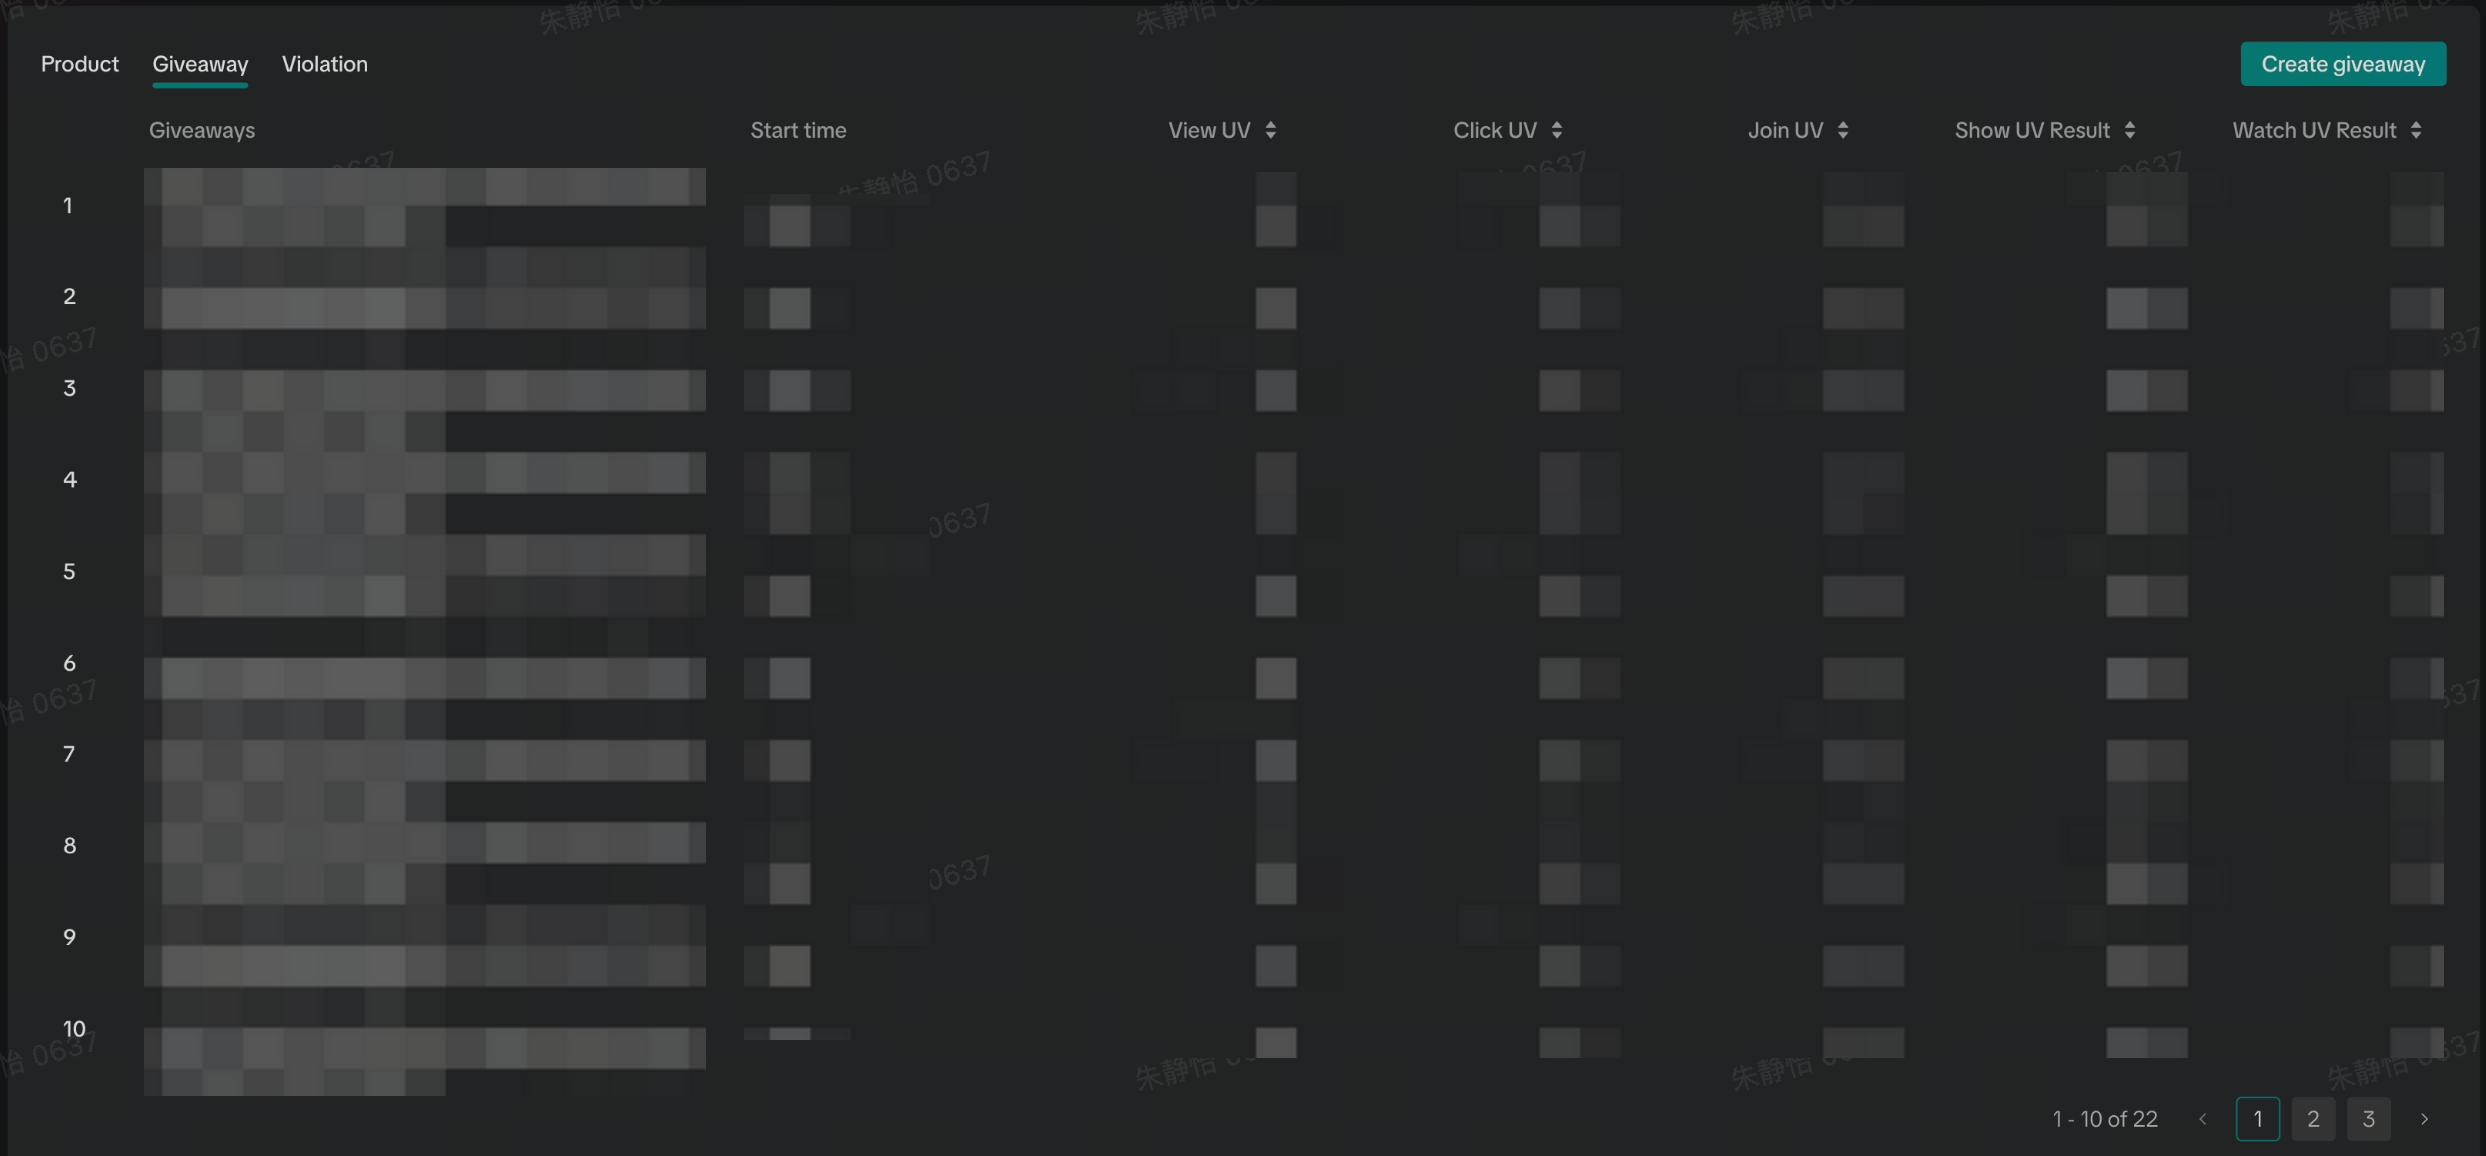 |
|
| LIVE broadcast |  |
|
Frequently Asked Questions (FAQs)
Do I need any special access or permissions to access this unified LIVE dashboard? Any TikTok Shop Creator/Seller performing Shoppable LIVEs will be able to access this functionality without the need for any special access permissions.What interface (PC/APP) will this functionality be available on? In this phase of the launch, the unified LIVE dashboard will only be available on the PC version but users will be able to leverage real-time analytics, during the LIVE, from the in-APP data insights.
What will happen to the old LIVE dashboard interface on PC? After the launch of the unified LIVE dashboard, the existing interface will be replaced for all users with the new functionality.
PreviousAnalyzing your Livestream dataNext Diagnose your LIVE performance with Suggested LIVE Improvements

