

Analyzing your Livestream data
Summary
What are the key benefits of using TikTok Shop’s livestream analytics for sellers?
- Sellers gain minute-by-minute performance data, insights on product pin impact, and viewer-to-buyer conversion drivers to optimize livestream effectiveness and revenue.
- They can download detailed product data and analyze audience demographics to better tailor products and marketing strategies.
How can sellers use livestream analytics to improve their livestream content and sales performance?
- By replaying livestreams, sellers can identify trends in transactions, audience engagement, follower growth, and product clicks to understand what drives sales.
- Analyzing the conversion funnel helps pinpoint where potential buyers drop off, enabling targeted improvements in the livestream flow and content.
What specific data and features does the LIVE Analytics dashboard provide to sellers?
- The dashboard offers customizable metrics on transactions, traffic, products, and engagement, with options to filter livestreams up to a year and export data for offline analysis.
- Detailed views include content-audience behavior relationships, product sales timing, viewer conversion funnels, and demographic profiles of viewers and buyers.
How does understanding audience composition through livestream analytics benefit sellers on TikTok Shop?
- Sellers can see viewer and buyer demographics such as age, gender, region, and purchasing power, helping them align product offerings with audience preferences.
- This insight supports more effective targeting and product selection to increase conversion rates and overall livestream success.
This article introduces highlights and key features of livestream analytics. From this article, you will learn how to understand and use your livestream data.

Analyze the data and see how it changes over time throughout your livestream.
Analyze the correlation of these metrics with what happened and what was said during the livestream.
Check at which stage in the funnel you lose your potential buyers to see where you need to improve.
You'll also see how trends differ for ad traffic (paid traffic) and organic traffic (free traffic).
Identify products with the highest revenue or best conversion potential.
Benefits
- See a minute-by-minute performance breakdown of your livestreams and know what drove the most impact.
- See the impact pinning products have on your bottom-line revenue, and look for fluctuations.
- Gain insight into the key drivers that led a viewer to purchase to ensure better livestreaming performance.
- Download all your product data to analyze the performance and optimize future livestreams.
- Gain insight into your livestream viewers.
Use livestream analytics
Replay livestreams and look for trends
Play the livestream back to analyze when transactions happen, the number of people who entered and left and at which point of your livestream, audience engagement, follower growth, product clicks, and orders.Analyze the data and see how it changes over time throughout your livestream.
Analyze the correlation of these metrics with what happened and what was said during the livestream.
Analyze the conversion funnel and traffic of your livestream
Understand how viewers are converted to buyers at each stage of the user journey: from initial livestream impressions to entering the livestream, having an initial product impression, clicking the product, and purchasing.Check at which stage in the funnel you lose your potential buyers to see where you need to improve.
You'll also see how trends differ for ad traffic (paid traffic) and organic traffic (free traffic).
Download and analyze product data
You can download impression, click, transaction and conversion data for products added to your livestreams to analyse how each product performs.Identify products with the highest revenue or best conversion potential.
Analyze your audience
Check the composition of your viewers and buyers by age, gender, region, and purchasing power as well as category and product preferences. This helps you better match your products/categories with your viewers and buyers.Key features
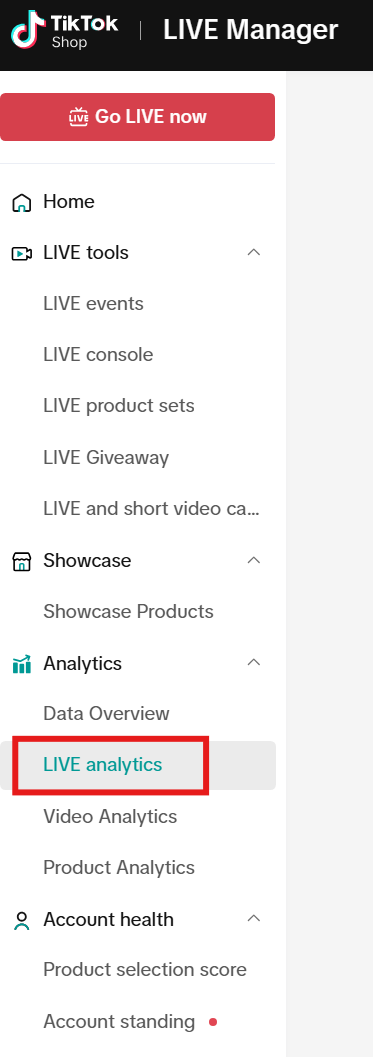
| The LIVE Analytics page provides an overview of the transaction, traffic, products, and engagement data for all livestreams. It also displays livestreams held today and in the past. You can view ongoing livestreams. At the top is Key metrics. In the middle is where you can see today's LIVEs. Let's dive into the All LIVE streams. | 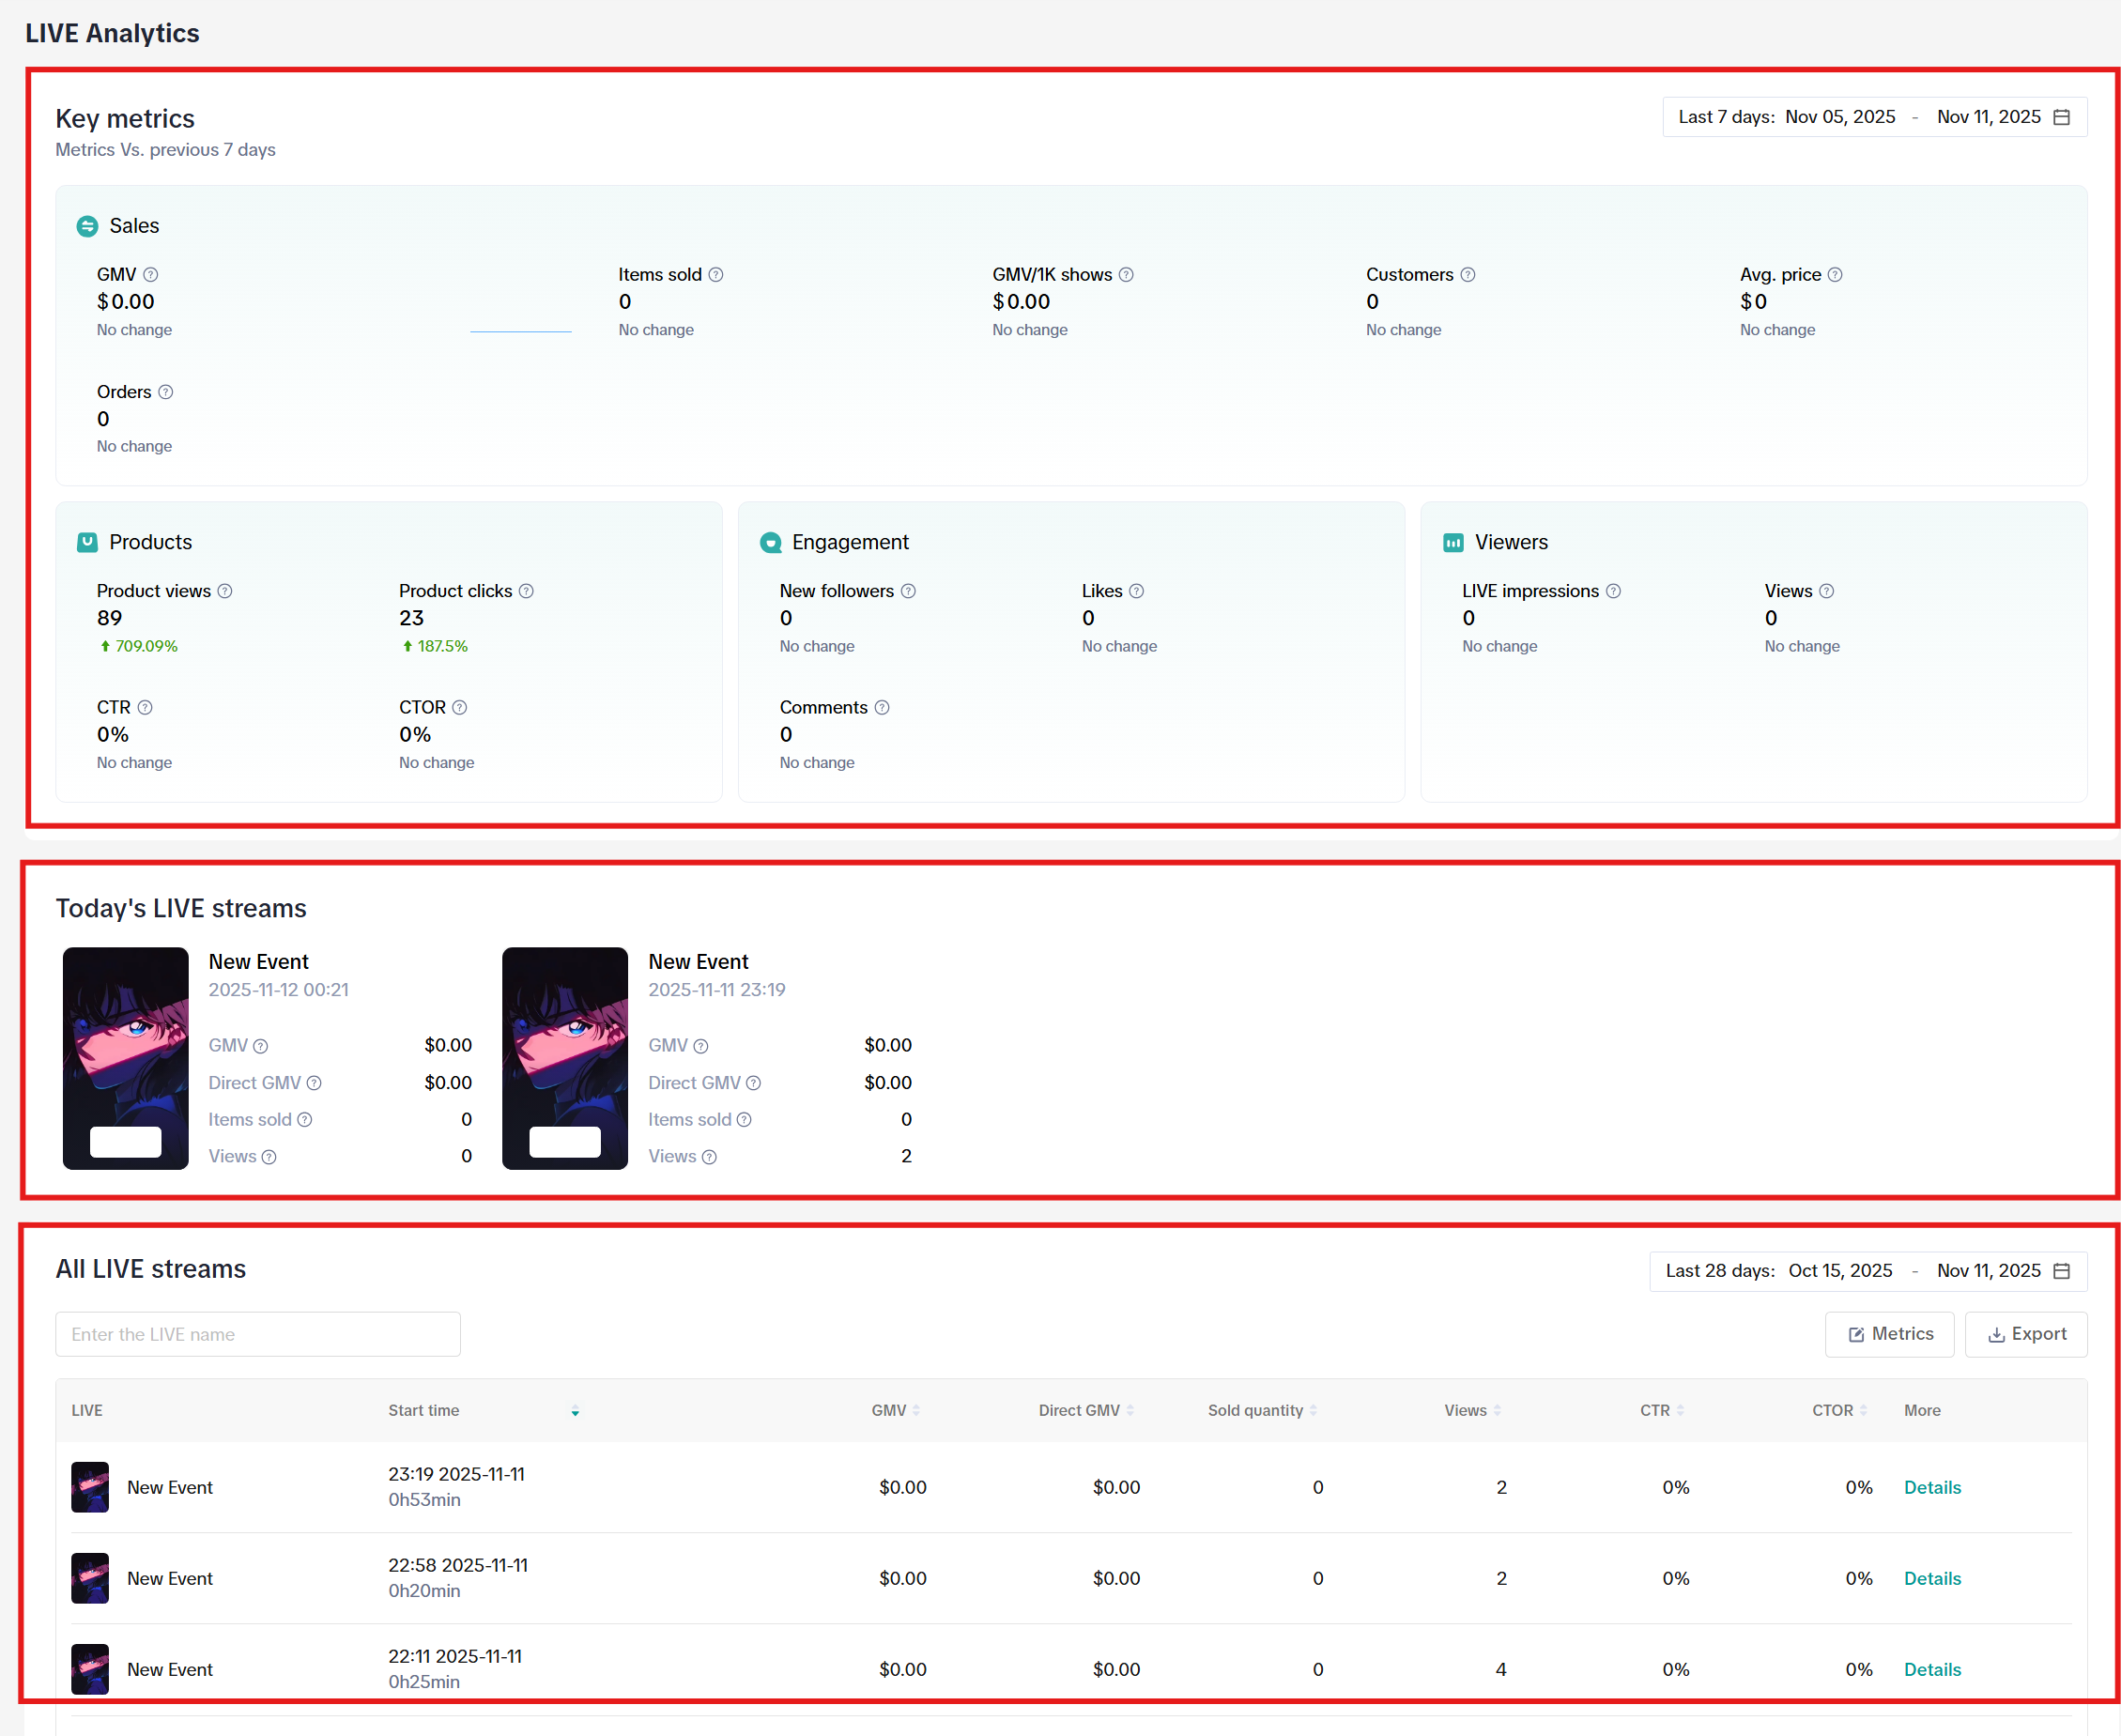 |
| In the ALL LIVE streams, you can filter to see all of your LIVE streams in the past, up to a year. Click on the Metrics button, you can customize the metrics you want to see shown on the dashboard. Export will export this set of data into an Excel file for offline viewing. | 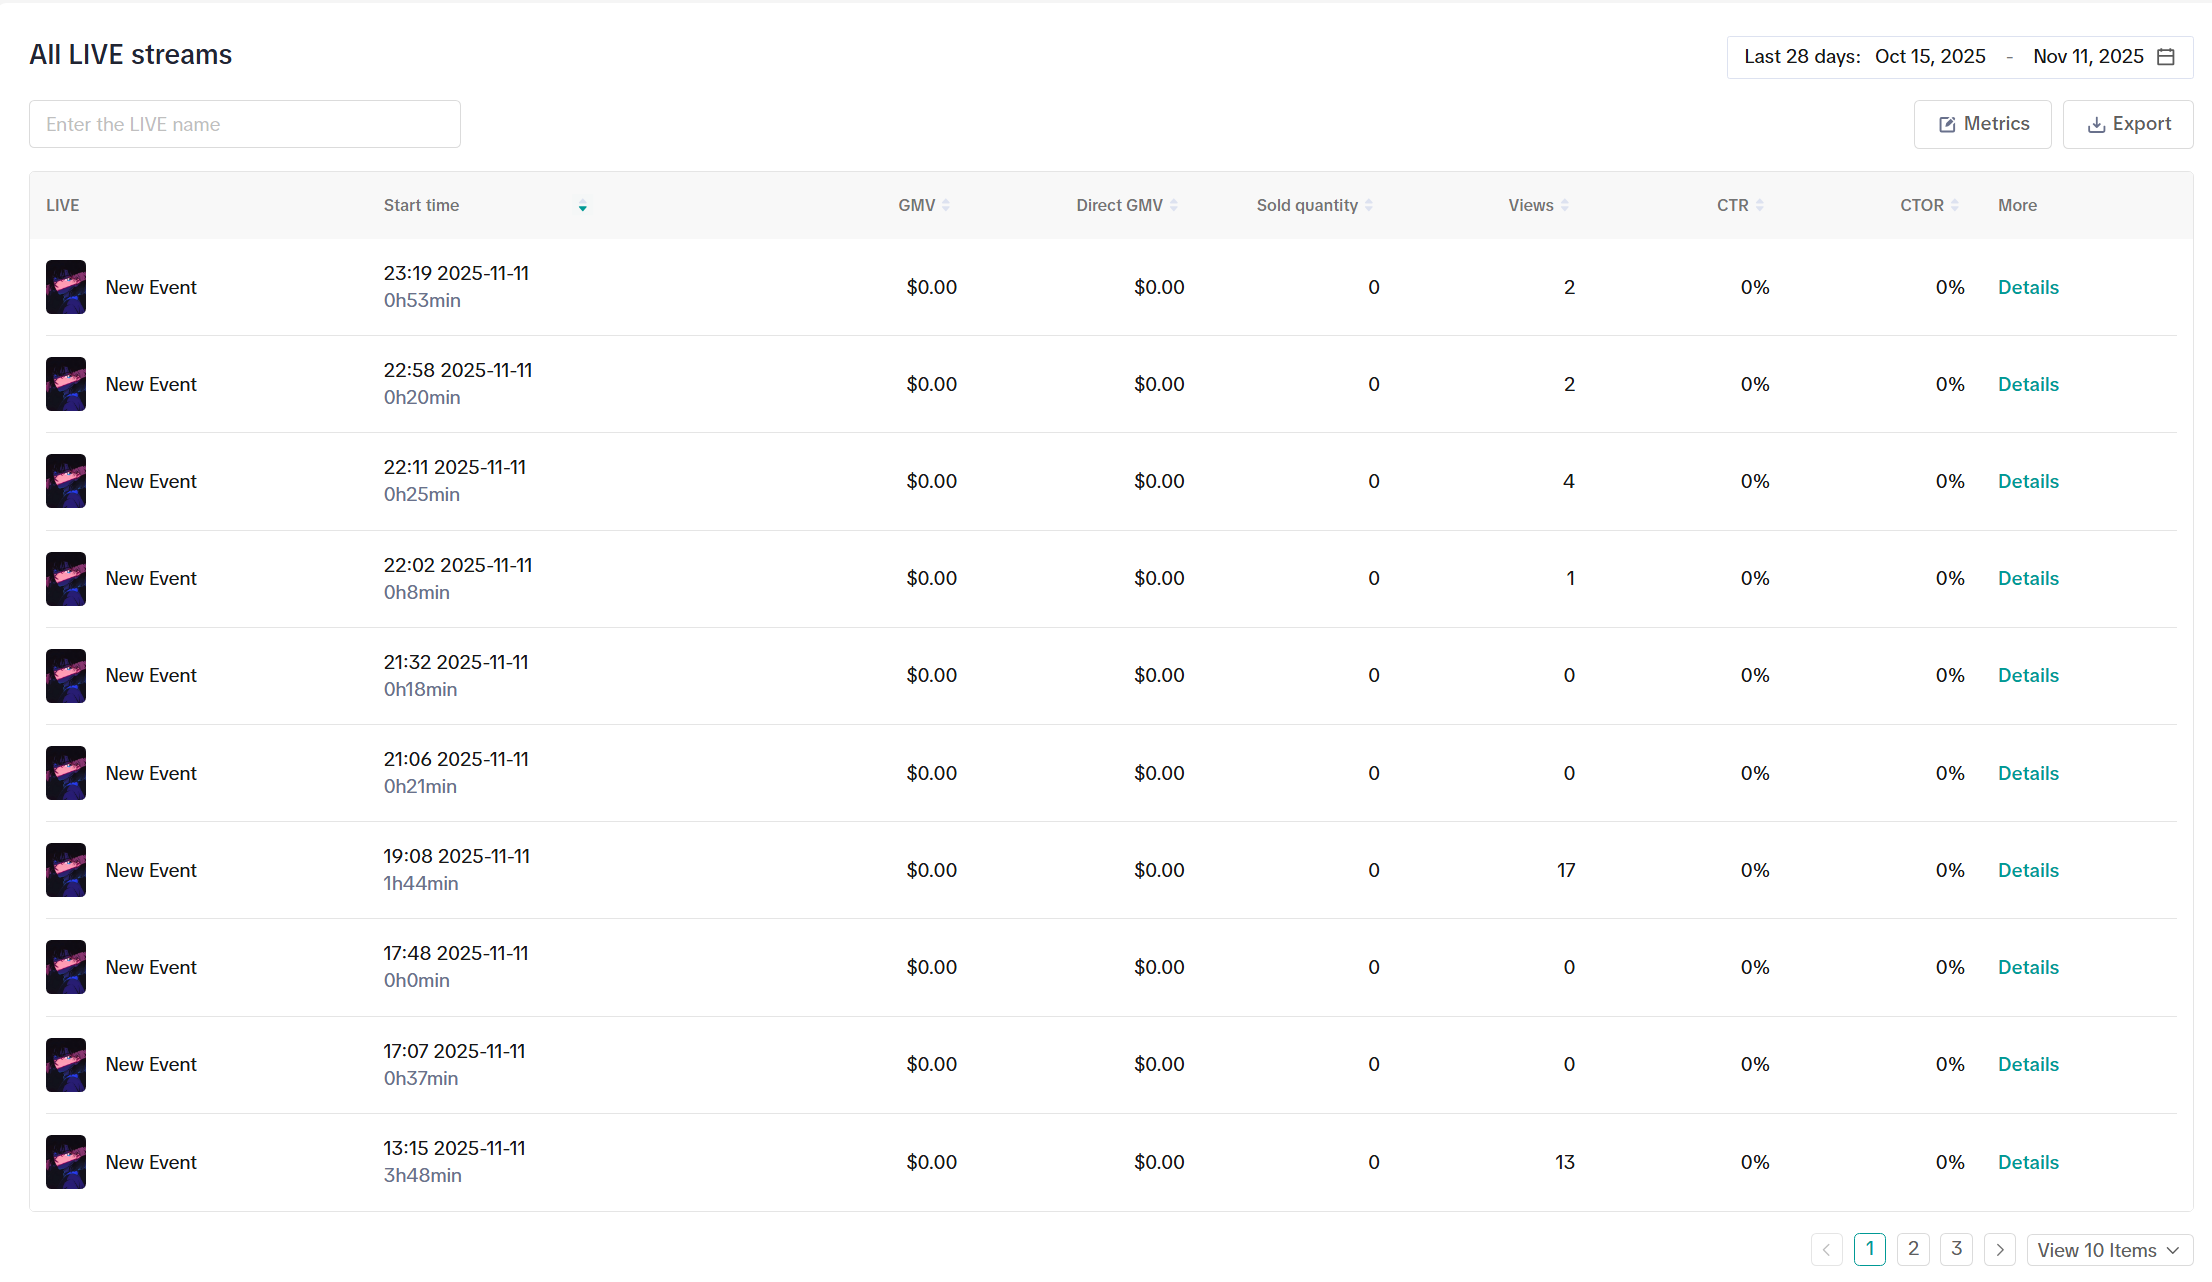 |
| Clicking into any of your past LIVEs, a new page will appear. On this new page, you can view more details about this specific LIVE. At the top, click on LIVE Dashboard to see more metrics about your LIVE. In the Key metrics section, see more sales and product metrics. At the bottom, you can toggle between Content, Viewers, Products, and User Profile. On the right, you'll see a recording of your livestream. | 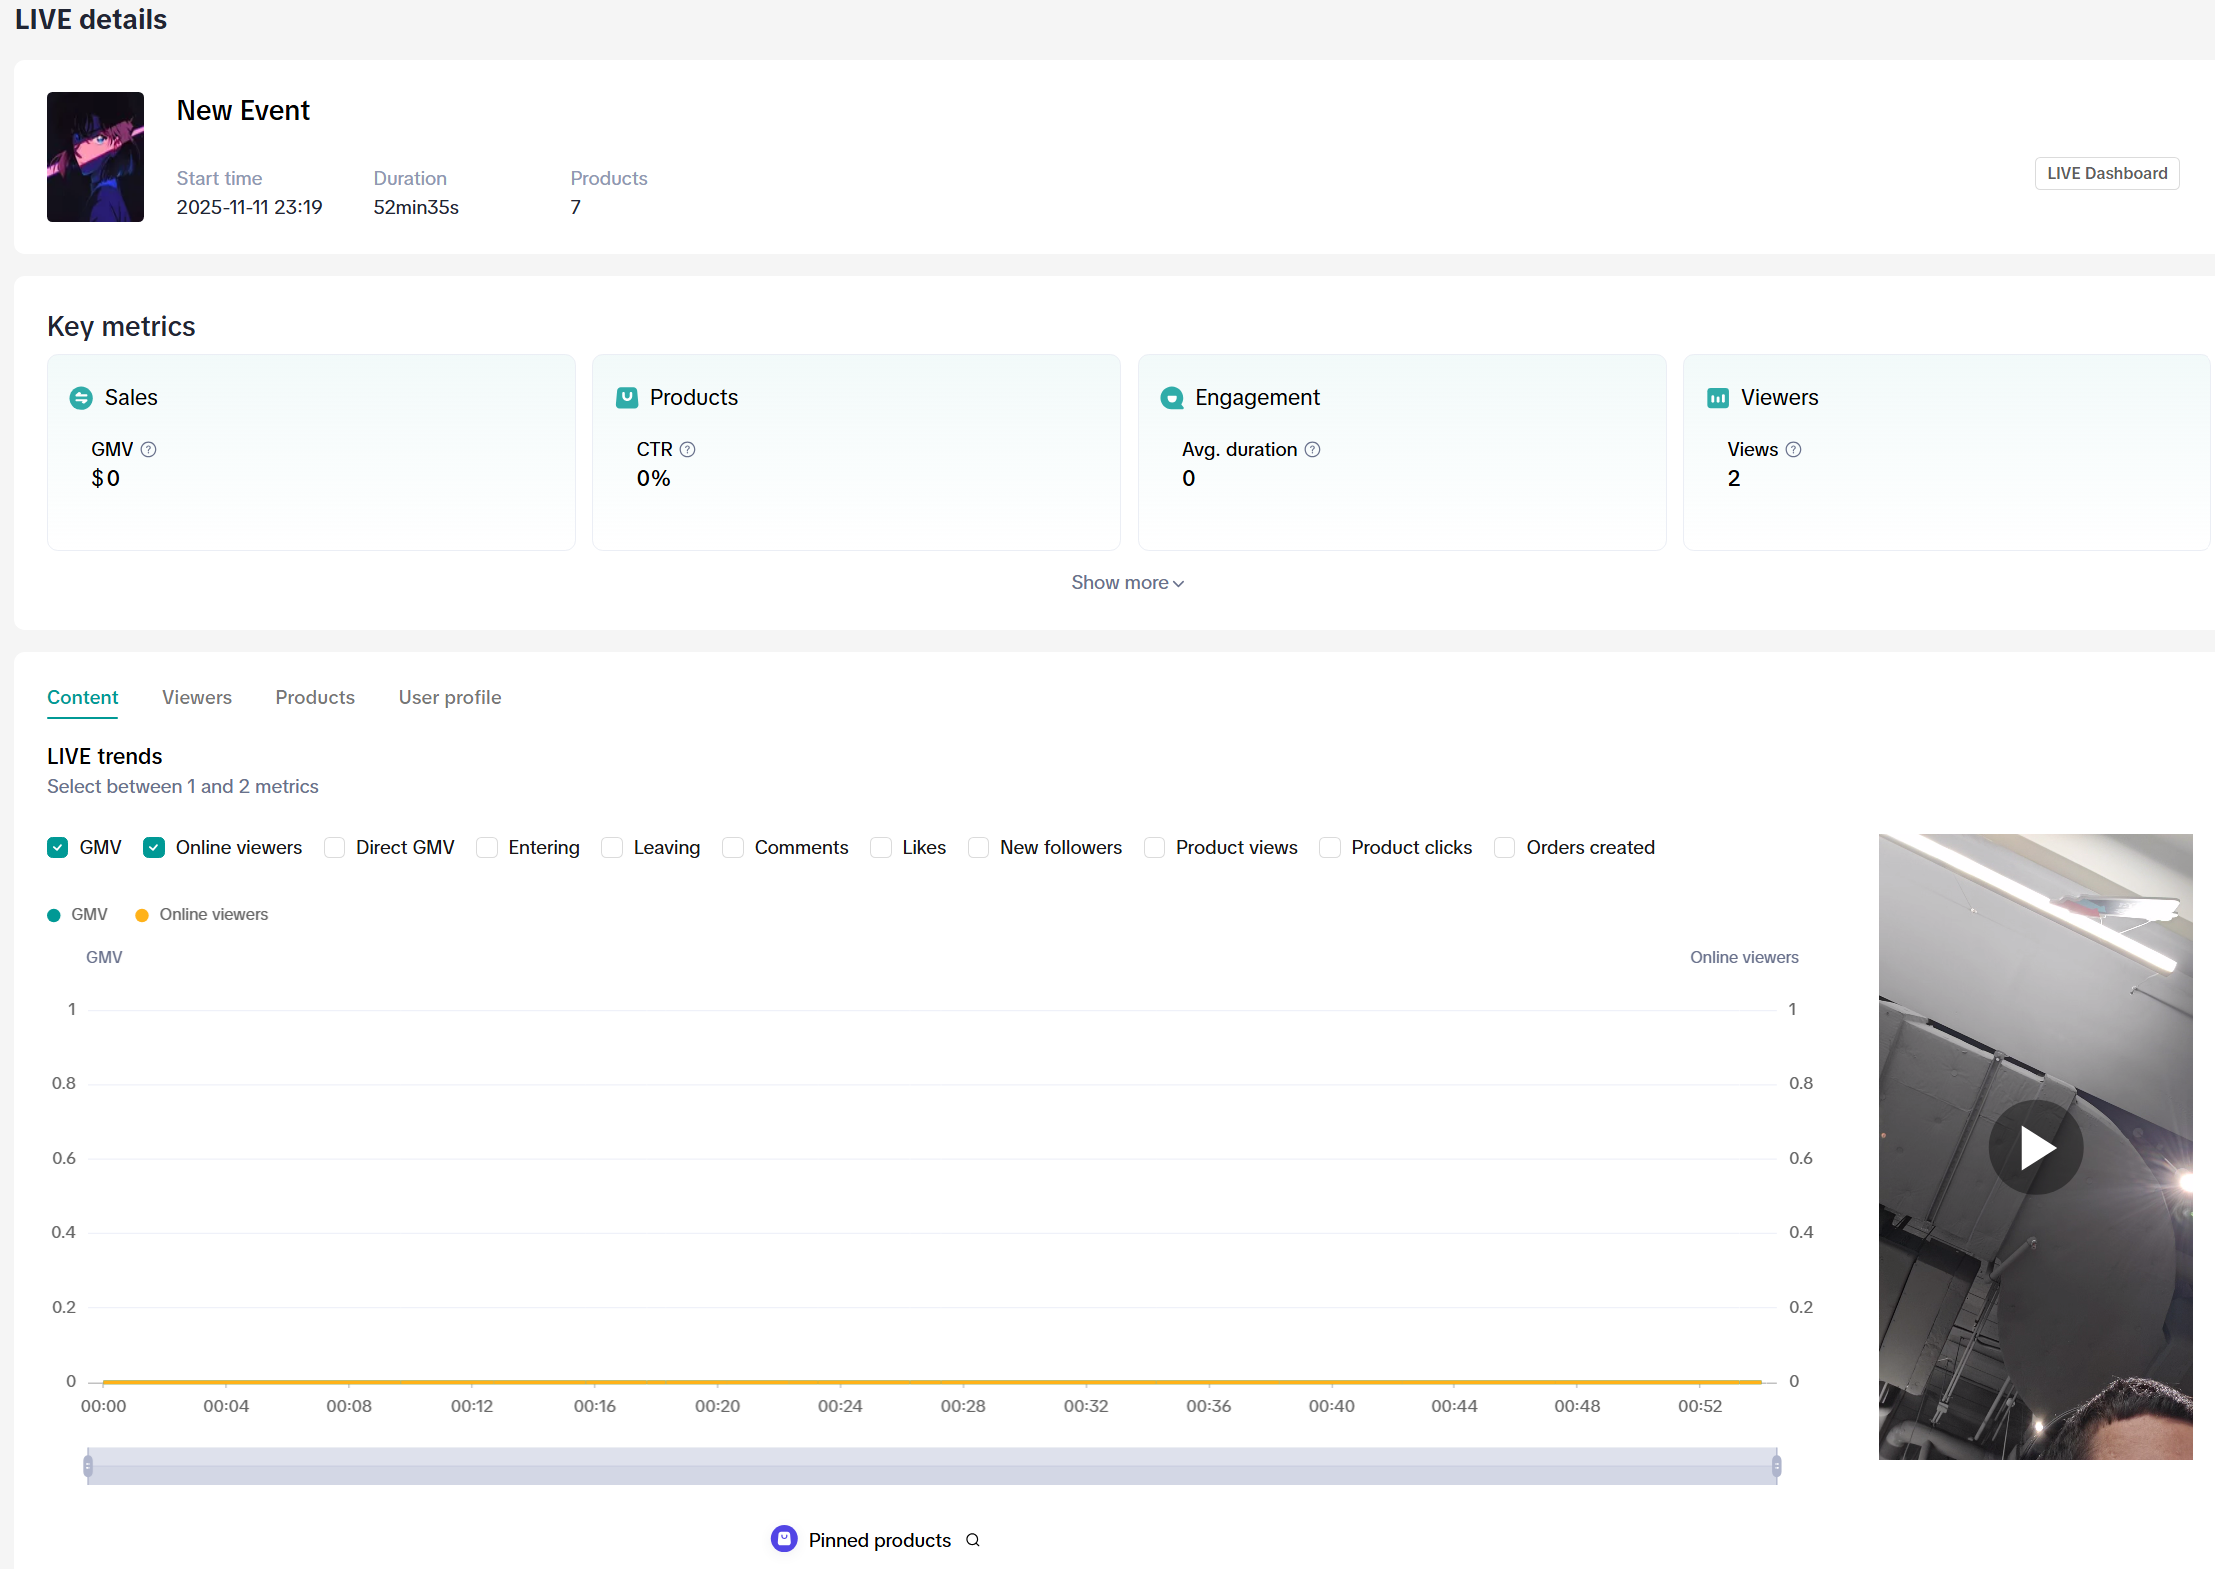 |
| Content shows the relationship between livestream content and audience behavior. This page shows trends when certain products are pinned and discounts or flash sales are offered. It allows you to understand the relationships between content and transaction, traffic, and audience engagement trends. You can click on the timeline and drill down at any time point. | |
| Viewers show the conversion from LIVE impressions all the way down to orders placed. Check the funnel stage where you lose your potential shoppers. You'll also see how trends differ for ad traffic and organic traffic. | |
| Products display the products, the number of items sold, timepoints at which they're sold, and sales metrics. | |
| Lastly, User Profile shows you information on demographics of your viewers and buyers. |

