

Analyzing your Video Performance in the TikTok App
09/28/2023
Summary
What are the benefits of using Video Analysis in Data Compass on TikTok Shop?
- Monitor video performance by analyzing traffic, interactions, transaction amounts, and conversion efficiency to adjust video creation strategies.
- Optimize product selection by identifying high GMV or conversion rate products and eliminating low-performing ones.
How can sellers access and use Video Analytics on TikTok Shop?
- Access through TikTok Shop Creator Center via Today's Data, Overview, and Video List to view recent video performance data.
- Use the Video List module in Data Compass to review video performance over the last 90 days, ranked by metrics like GMV, Views, or Items sold.
What key metrics are available in Video Analytics, and how can they help sellers?
- Metrics include revenue, views, orders, items sold, likes, comments, and more, helping sellers understand video and product performance.
- View trends of key metrics to analyze performance over time and make informed decisions on video and product strategies.
How can sellers analyze detailed video performance on TikTok Shop?
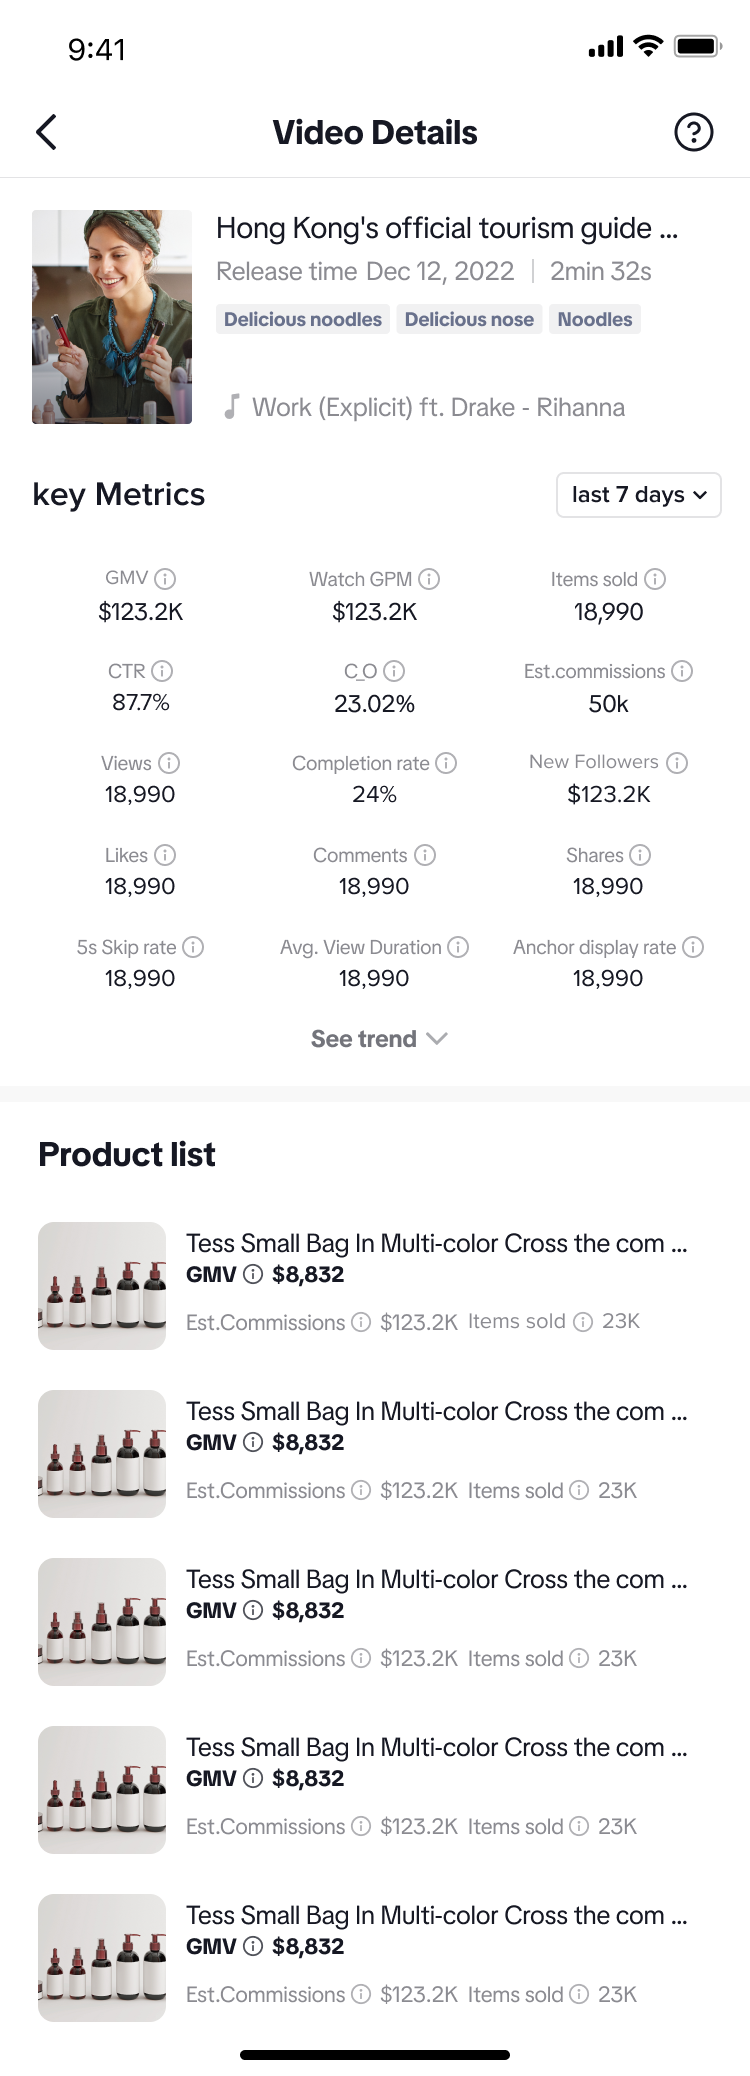
- On the Video Details page, view additional information like topic tags, music, and detailed metrics such as GMV, CTR, and interaction rates.
- Sort product lists by revenue to assess the performance of each product featured in a video.
Benefits of using Video Analysis in Data Compass
🌟Monitor Video Performance
Learn about the traffic gained, interactions, transaction amount and transaction conversion efficiency of each video that you publish. Get a better understanding of the kinds of videos that are popular with your viewers, which helps you adjust your video creation strategy.🌟Optimize Video Product Selection
See the product performance of your videos, analyze the product transaction and conversion performance, identify the products that contribute to high GMV or the products with high conversion rates and eliminate the products with low GMV and low conversion.How to use Video Analytics
From Video Overview in Creator Center
Detailed introduction | Product Demo (test account, virtual data, subject to product) |
| Entrance:Enter through: TikTok Shop Creator Center->Today's Data->Overview->Video ListHere you can see the most recent video you’ve published and its performance data, including revenue, views, likes and comments.Click View More to enter the Video List page for more detailed data about your videos.You can also click the Video tab to check out all the key aggregated video data and complete video list. | 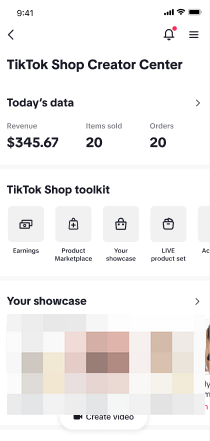 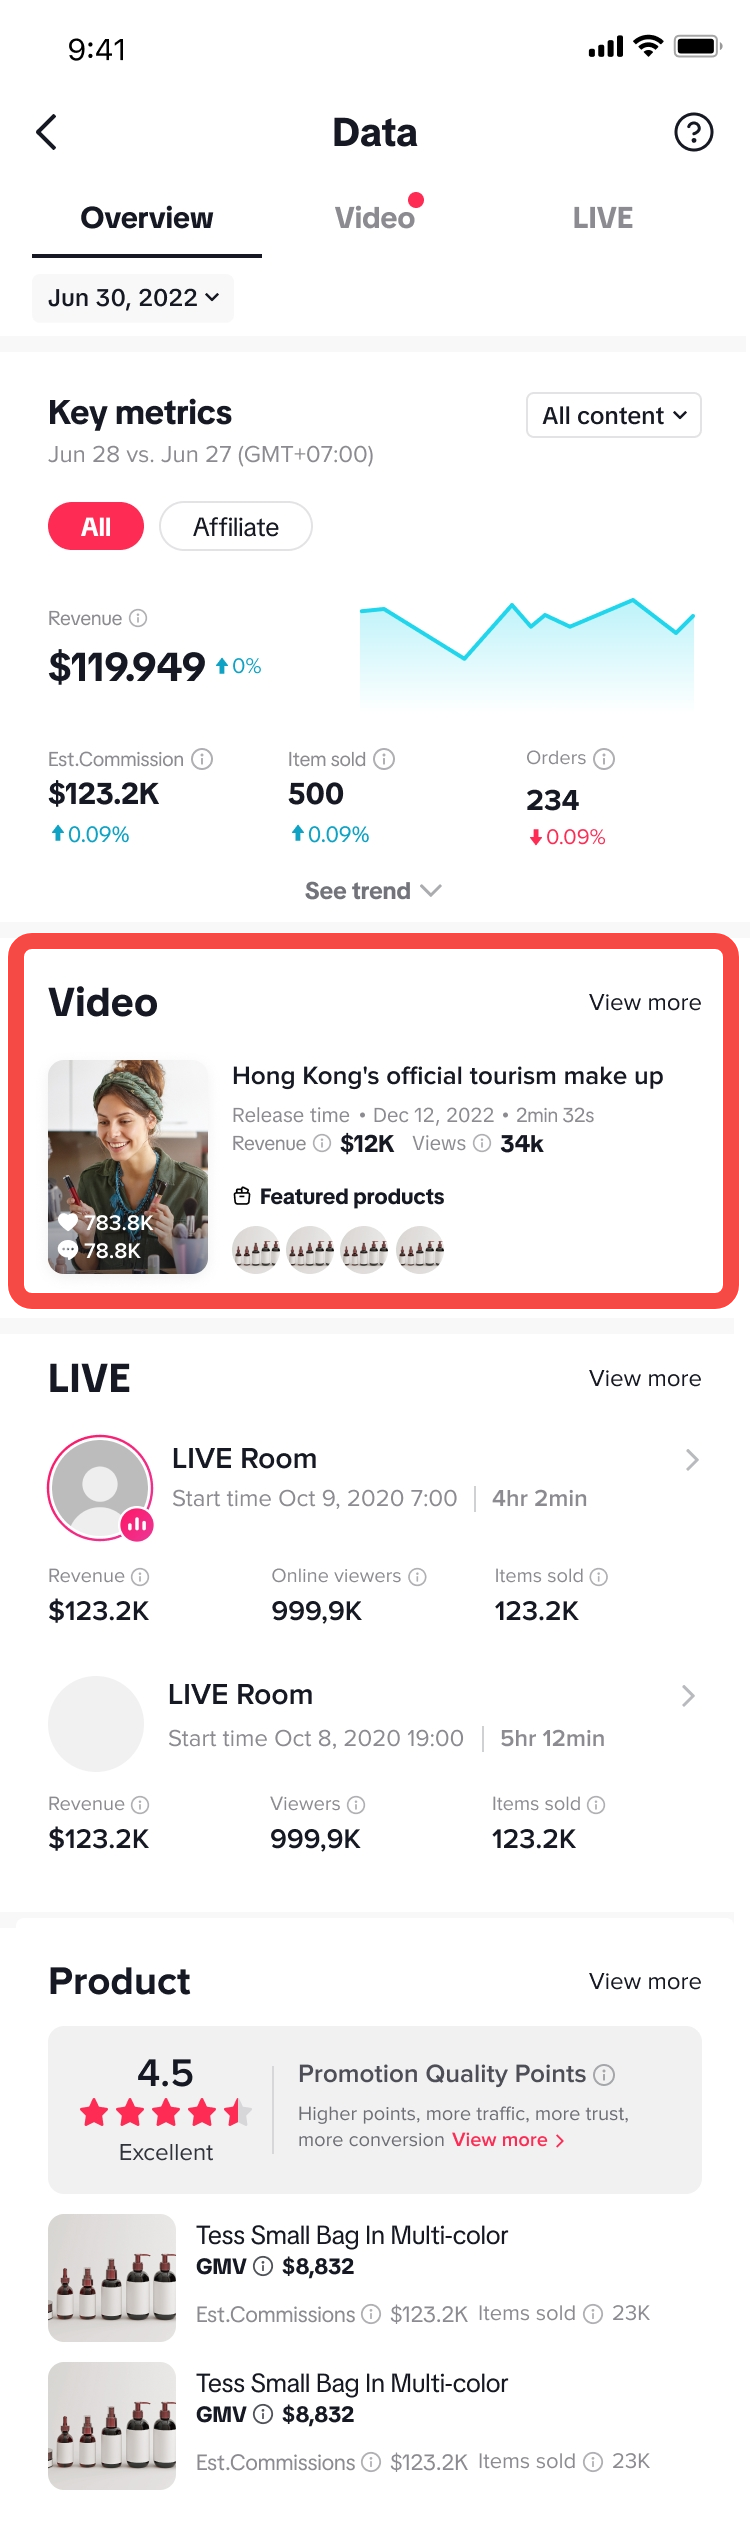 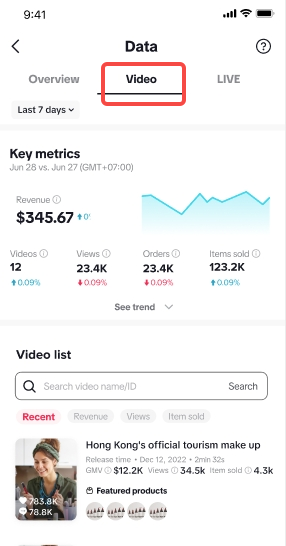 |
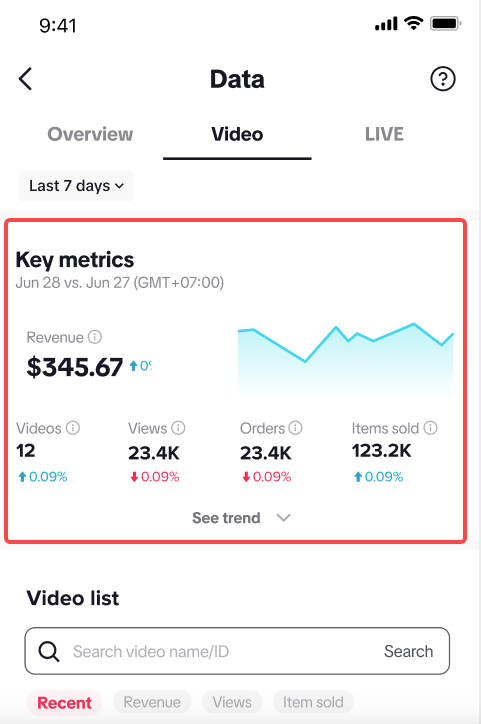
Time selection:You can choose Today, Last 7 Days, Last 28 Days, Week, Month or Custom Time.
|  |
From the Video List module in Data Compass
Detailed introduction | Product Demo (test account, virtual data, subject to product) |
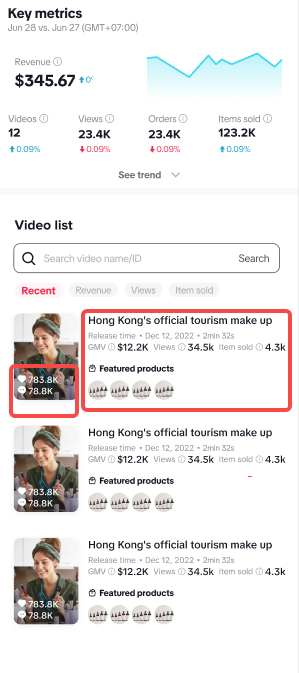
| In the Video List module, you can review the performance of videos published within the last 90 days.Videos are listed in descending order based on their post time by default. You can also choose to rank by metric (GMV, Views or Items sold) to determine the top videos based on your selection.You can also search by video name or video ID in the search bar to find your target video. | 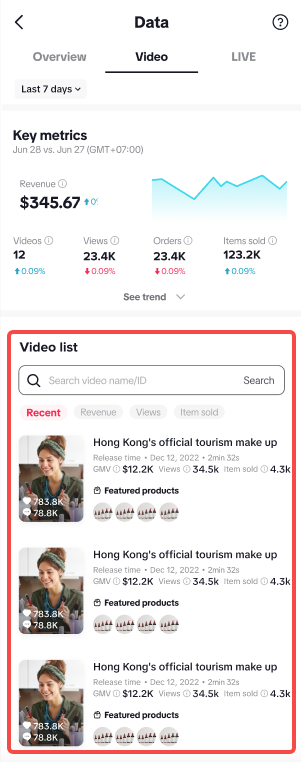 |
Check out the key performance data of videos:The metrics displayed with each video are calculated based on the chosen time period.Core indicators include:
|  |
From the Video detailed page
Detailed introduction | Product Demo (test account, virtual data, subject to product) |
| 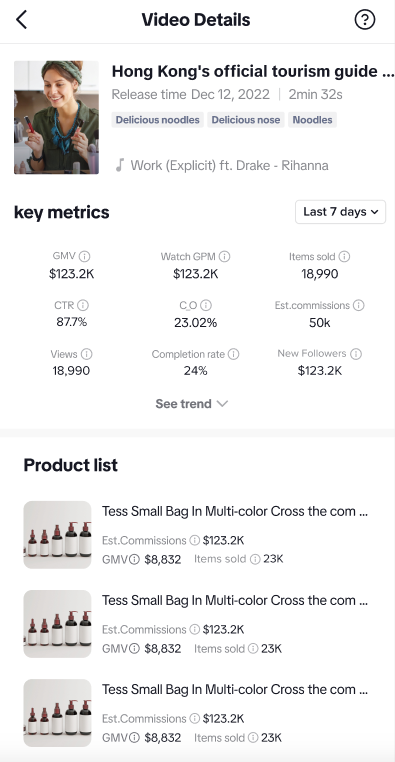 |
Product list sorted by Revenue:
|  |
You may also be interested in
How to Analyze Your Video Performance on Desktop
From this article, you will learn how to use video analytics generated by the platform to analyze yo…

How to Use Earnings Analytics
Maximize Your Growth with our New Earnings Analytics! Take full control of your revenue with our new…
How to Use Video Diagnosis
Ever wonder how to make your content really pop? This article is your ultimate guide to using Video…

Market Insights for Creators
Market Insights for Creators Overview Ready to be inspired? Find trends, topics, and inspiration for…

Start Here!
Please Note: This is the mobile-optimized version. If you are viewing on your PC web-browser, clic…
Video Insights for new Creators
High level overview Are you looking to level-up your Video performance but not sure how to get start…