

How to use Campaign Dashboard
Summary
What is the purpose of the TikTok Shop Campaign Dashboard and what key features does it offer to sellers?
- The Campaign Dashboard helps sellers track real-time sales, product performance, and content effectiveness during mega campaigns, enabling quick strategy adjustments and deeper analysis.
- Key features include multiple time views (Today, Daily, Campaign Period), benchmark comparisons, marketing data, traffic breakdown, conversion funnel, and inventory alerts for proactive management.
How can sellers use the Campaign Dashboard to optimize their campaign performance and marketing efforts?
- Sellers can set campaign goals, compare daily GMV against past performance, monitor product impressions, ad spend, and creator content supply, and receive benchmark data to identify improvement areas.
- The dashboard provides detailed content and sub-campaign rankings, traffic source insights, and a conversion funnel to understand shopper behavior and optimize marketing focus.
What inventory and product performance insights does the Campaign Dashboard provide to help sellers manage stock during campaigns?
- Real-time stock status and alerts for potential out-of-stock risks within 7 days help sellers replenish inventory timely.
- Metrics like Add-to-Cart Rate and filters for campaign or all products allow sellers to identify high-demand items and prioritize ad creation or stock replenishment efficiently.
How does the Campaign Dashboard support sellers in analyzing traffic sources and conversion efficiency?
- The Traffic section breaks down product impressions by channel, showing impression share, click-through rate (CTR), and click-to-order rate (CTOR) to highlight high-performing traffic sources.
- The Conversion Funnel visualizes the shopper journey from exposure to purchase, providing average unique reach, clicks, and daily customers to guide data-driven campaign improvements.
What are the recommended ways for sellers to access and navigate the Campaign Dashboard within the Seller Center?
- Sellers can access the dashboard via multiple Seller Center paths: Analytics > Marketing analytics > Promotion > Campaigns, Marketing > Campaigns > Manage campaigns, Analytics > Shop analytics > Ongoing events, or Homepage banners.
- The dashboard allows switching between Today, Daily, and Campaign Period views, with customizable metrics and detailed drill-downs for videos, LIVE streams, and products to facilitate comprehensive performance tracking.
Campaign Dashboard Overview
Campaigns are key opportunities for sellers to boost sales and acquire new customers. Campaign Dashboard provides real-time insights into shop sales, product performance, and content effectiveness during mega campaigns. It also issues timely alerts for content violations and potential out-of-stock risks. Once you've successfully joined a mega campaign, you'll automatically gain access to its corresponding dashboard.Campaign Dashboard offers a simple and efficient way to track campaign performance. You can quickly assess results and progress, adjust strategies in real time, and explore detailed metrics for deeper performance analysis.
What's New
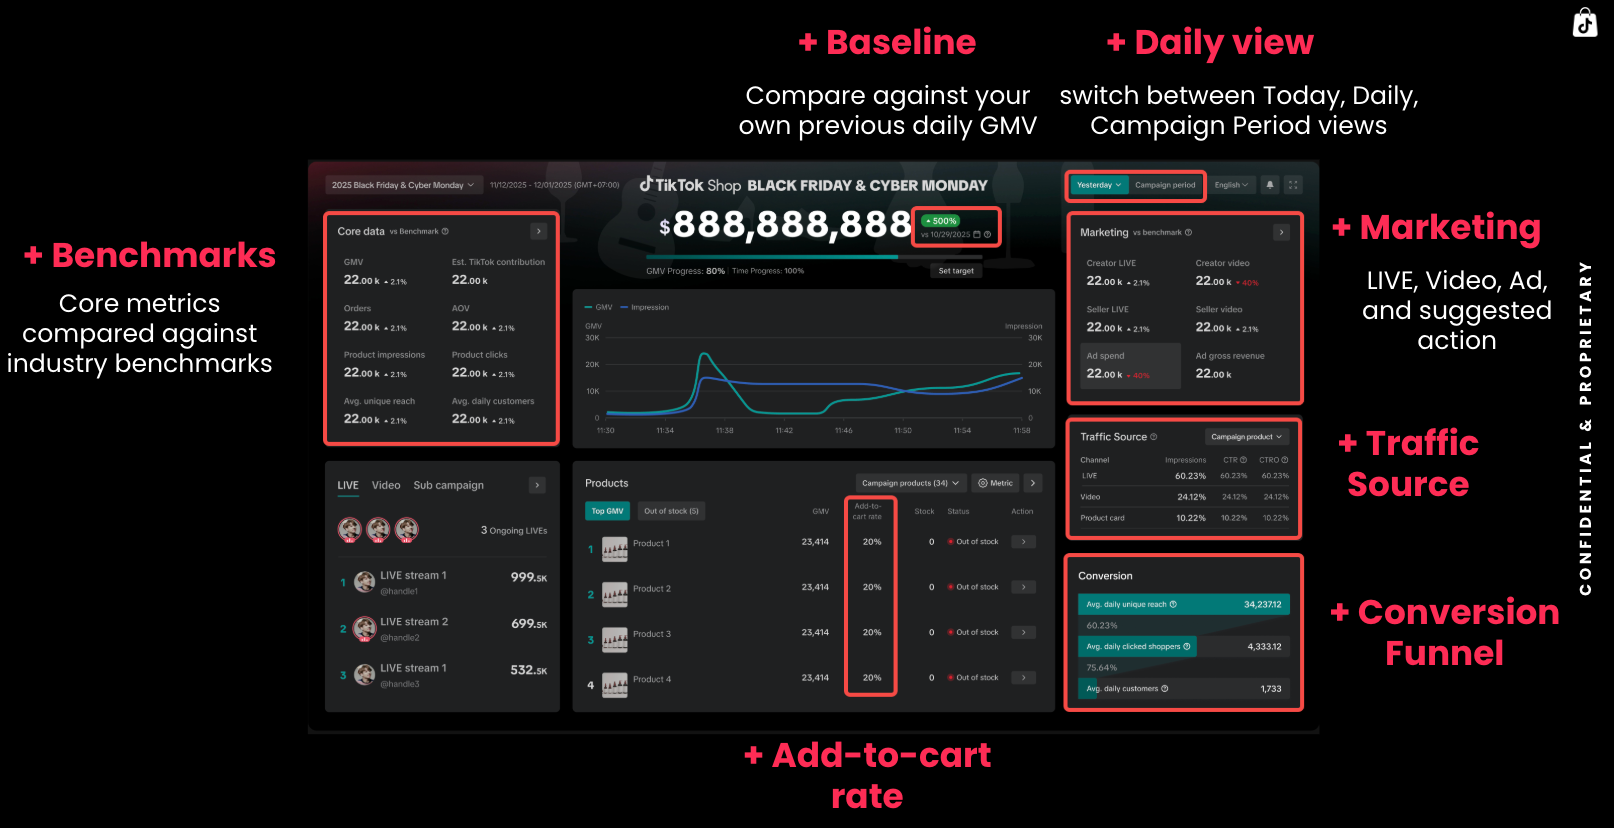
- Added Day and Campaign period view: Add daily view for yesterday or any completed campaign days. Now you can switch among Today(real-time data), Daily(daily data for yesterday or any completed campaign days), and Campaign Period(aggregated data) views.
- Added Benchmark Comparison of Core Data: Offer the benchmark based on the ACE Framework (upcoming), enabling you to compare your own performance against sellers in the same category and at the same or higher GMV tiers.
- Added Baseline Comparison of Campaign GMV: Compare your campaign day GMV performance with your shop's previous daily GMV (any day within the past six months)
- Added Marketing Data: Offer a real-time view of your content supply from both creator and your self-operated accounts, as well as ad investment metrics from your primary ad account. When benchmark data becomes available, it provides guidance and quick links for timely optimization.
- Added Traffic Breakdown: Provide deeper visibility into how your campaign traffic is distributed across different channels, along with their respective engagement and conversion efficiencies, helping you identify high-performing sources and optimize your marketing focus.
- Added Conversion Funnel: Offer a visual view of the shopper journey from exposure to conversion, breaking down reach, engagement, and conversion metrics to help you better understand performance across customer acquisition stages.
How to use Campaign Dashboard
Entrance
Entrance 1: Seller Center > Analytics > Marketing analytics > Promotion > Campaigns > View performance on the banner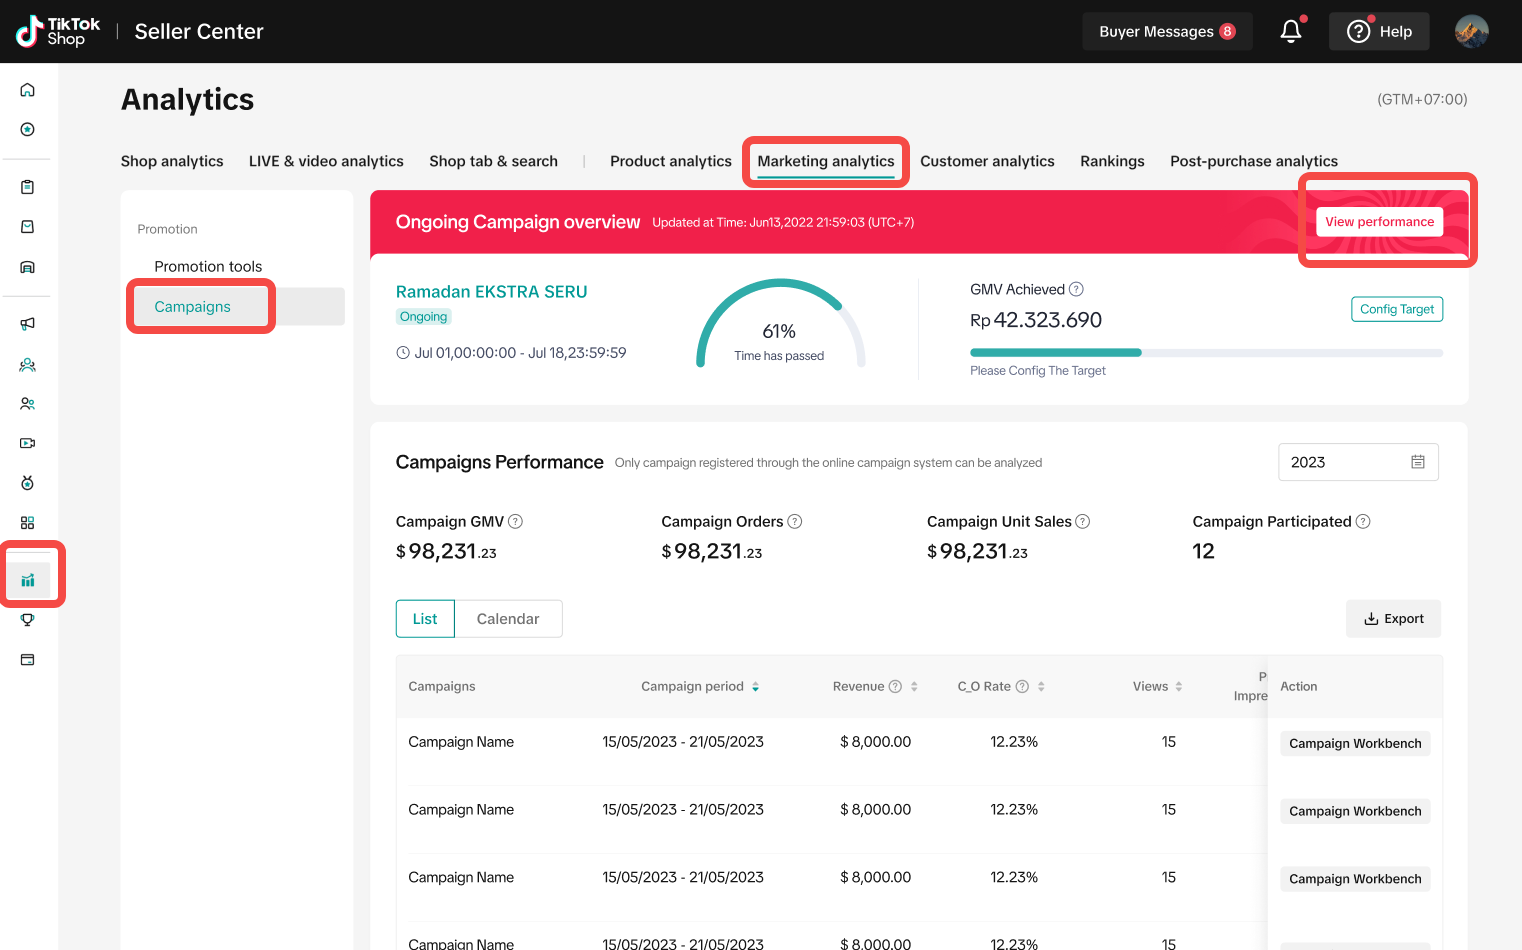


Features Introductions
Today, Daily and Campaign Period view
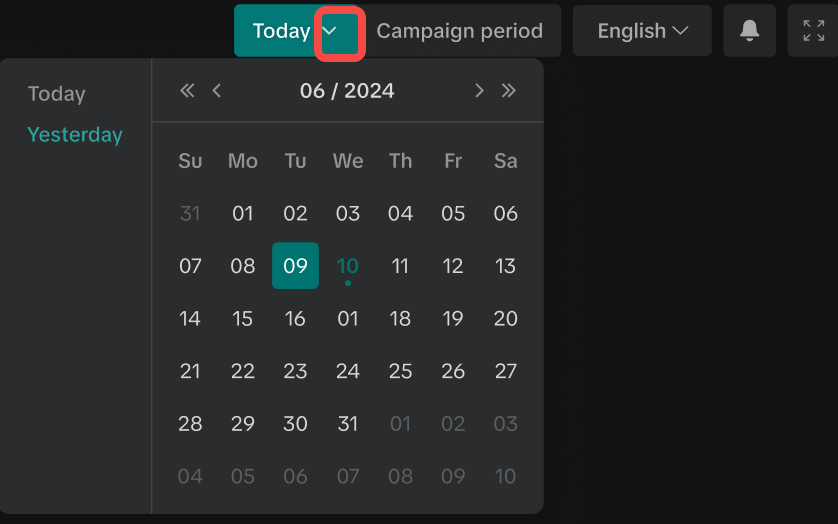
Throughout the duration of mega campaigns, you can head to the Campaign Dashboard to monitor your shop achievements in real time. At the top-right corner, you can switch between Today, Daily (select a specific campaign day from the calendar), Campaign Period views:- Today: real-time data starts from 00:00 (US Seller Center time) till your viewing time
- Campaign Day: daily data for yesterday or any completed campaign days
- Campaign Period: aggregated data from campaign start day till your viewing time
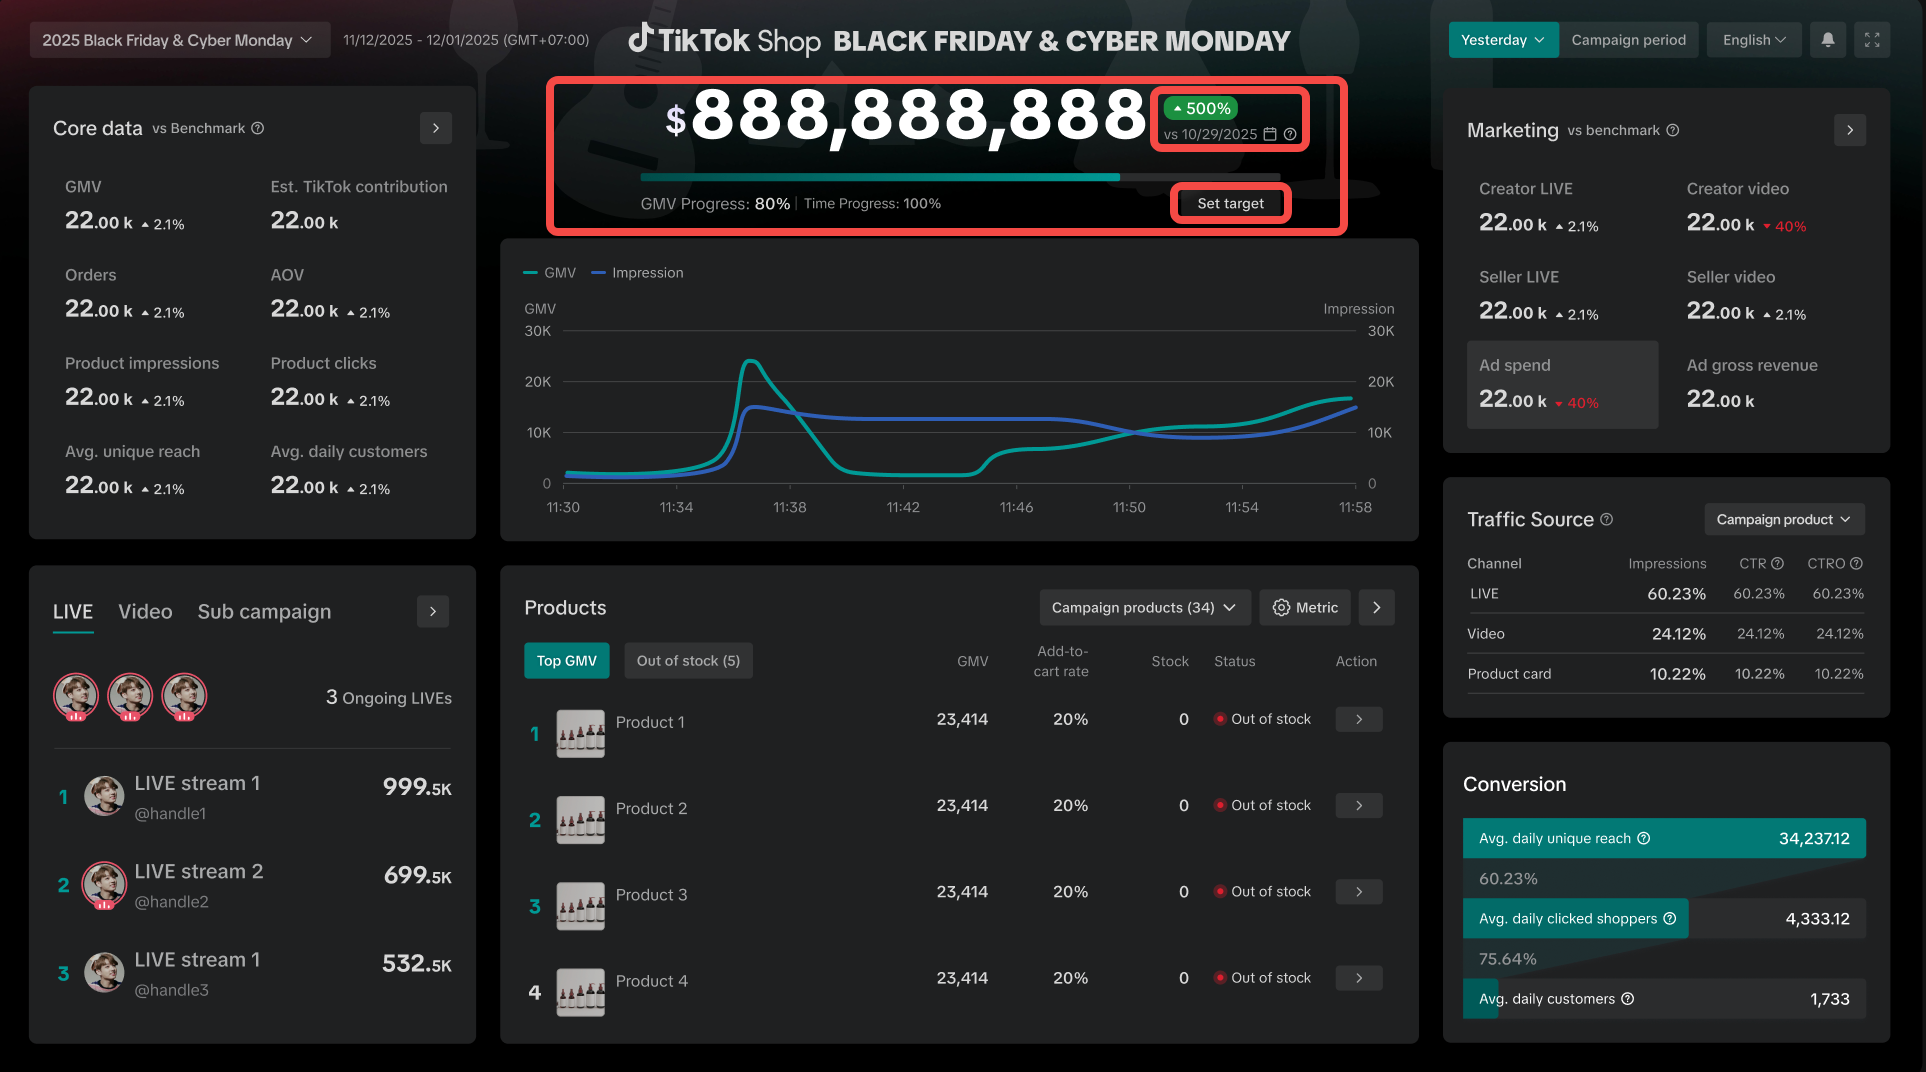
Set up your campaign goal and keep on track
At the top of the page, you can view your achievements during the campaign period. Click Set Target to set your campaign goal and track your progress in real time.If you want to compare your campaign day GMV performance with your shop's previous daily GMV, use the calendar icon to select any specific day within the past six months for self-comparison. This function is currently available only in Daily View.
Difference in % = (Campaign day GMV - Selected day GMV) ÷ Selected day GMV * 100%
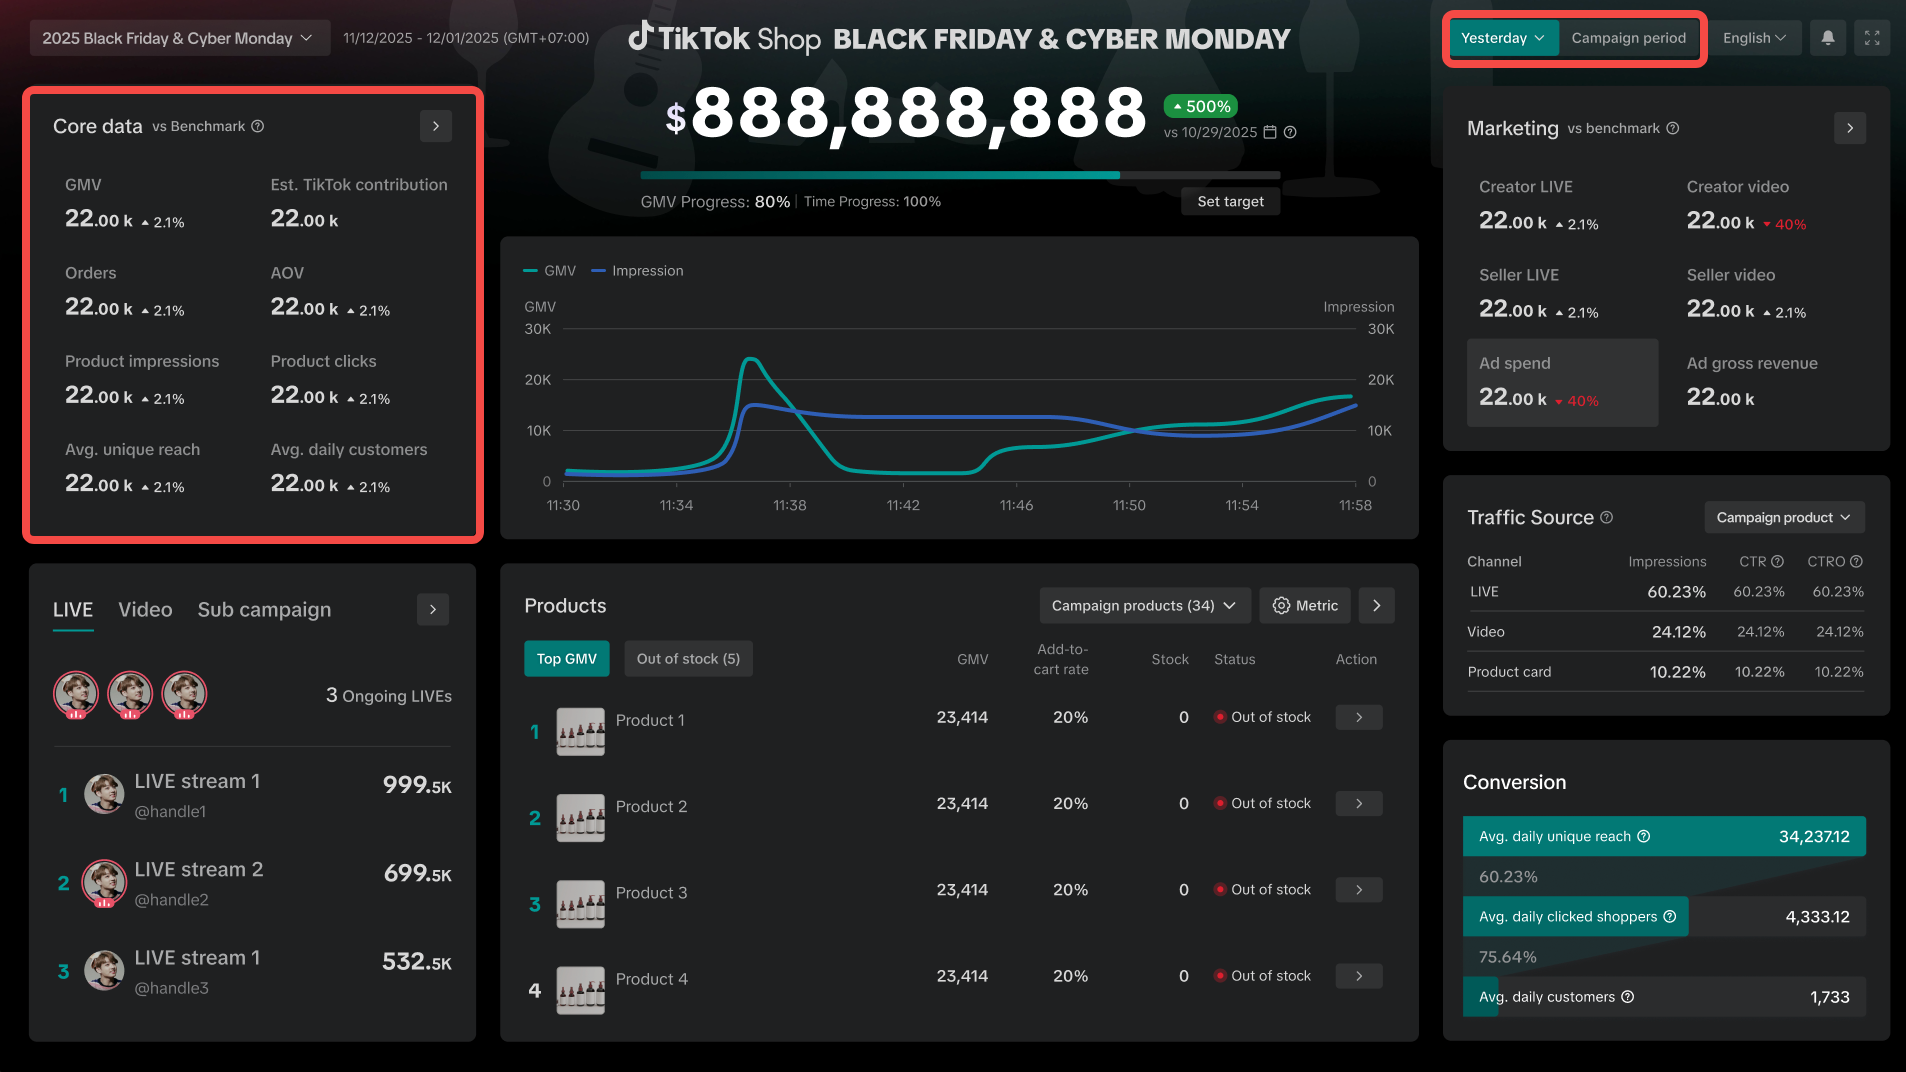
Core data
We've enhanced the Core Data section by adding:- Product Impressions: The total number of times a product appeared in LIVE streams, videos, and product cards.
- Estimated Tiktok Contribution: This is the estimated amount contributed by TikTok to your shop's GMV, including contribution to both product and shipping. It is a pre-settlement estimate; the final settled amount can be viewed under Finances in Seller Center.
- Benchmark Comparison: Similar to ACE on the Analytics home page, you can compare your key campaign metrics against the average performance of top sellers in your current or higher tier and is refreshed on a daily basis. You can check your tier on Seller Center -> Analytics -> Shop analytics -> Shop Insights based on ACE framework(upcoming).
- Difference in % = (Selected day metrics - benchmark day metrics)÷benchmark day metrics * 100%
- Availability: Benchmarks are available for daily and aggregated campaign periods. Real-time data is excluded from benchmark calculations.
- Update frequency: Benchmark data updates after the full day's data is finalized, typically reflecting the previous day. In case of delays in data processing, results from two days prior will be displayed instead.
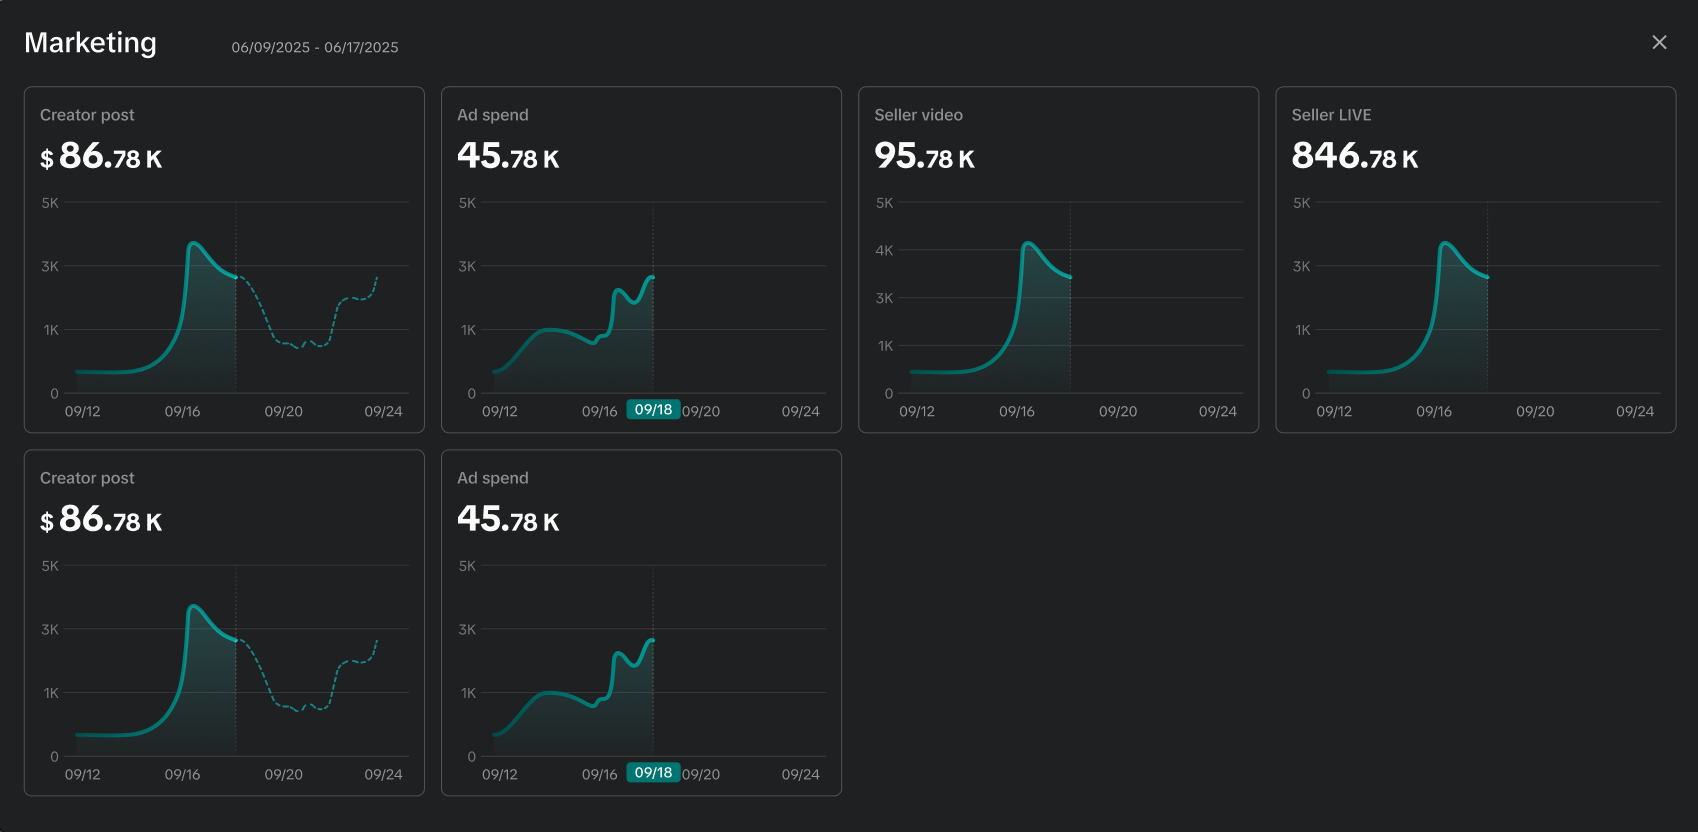
Marketing
Marketing section is newly added to help you measure your content and marketing effort during the campaign period. It includes core metrics from both content supply and ad investment dimensions. When benchmark becomes available, we will provide suggested actions and re-direct links for you to take immediate actions.- Creator Video/LIVEs: New videos published or new LIVE streams hosted by creator accounts.
- Seller Video/LIVEs: New videos published or new LIVE streams hosted by sellers' marketing accounts and linked accounts.
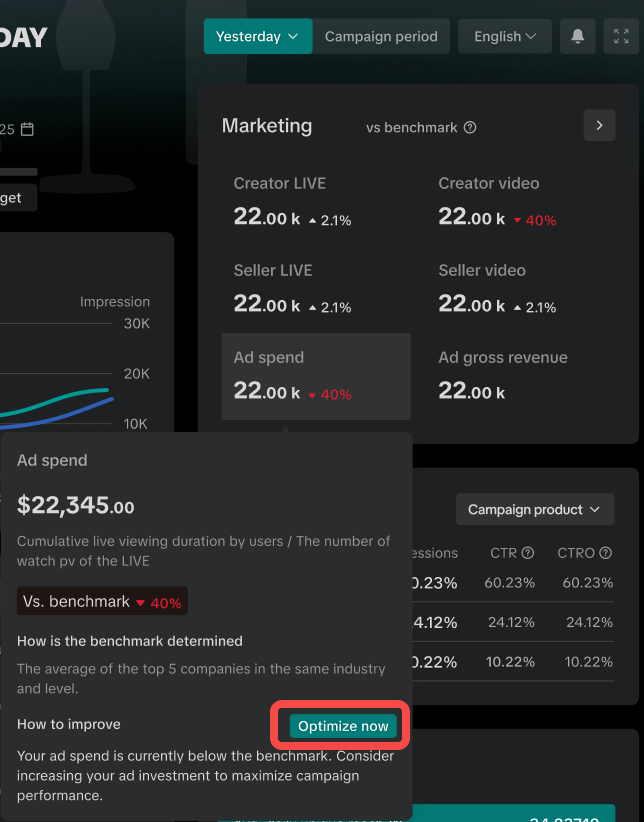
- Ad spend and Ad gross revenue from your primary account: Primary account refers to the ad account you have selected in Seller Center → Marketing → Shop Ads. Data will refresh automatically when you update your primary account.
- Optimize immediately: Click "Optimize now" to access related pages where you can review details or take immediate optimization actions.
*Under daily view, hourly views are only available for Ad spend and Ad gross revenue.
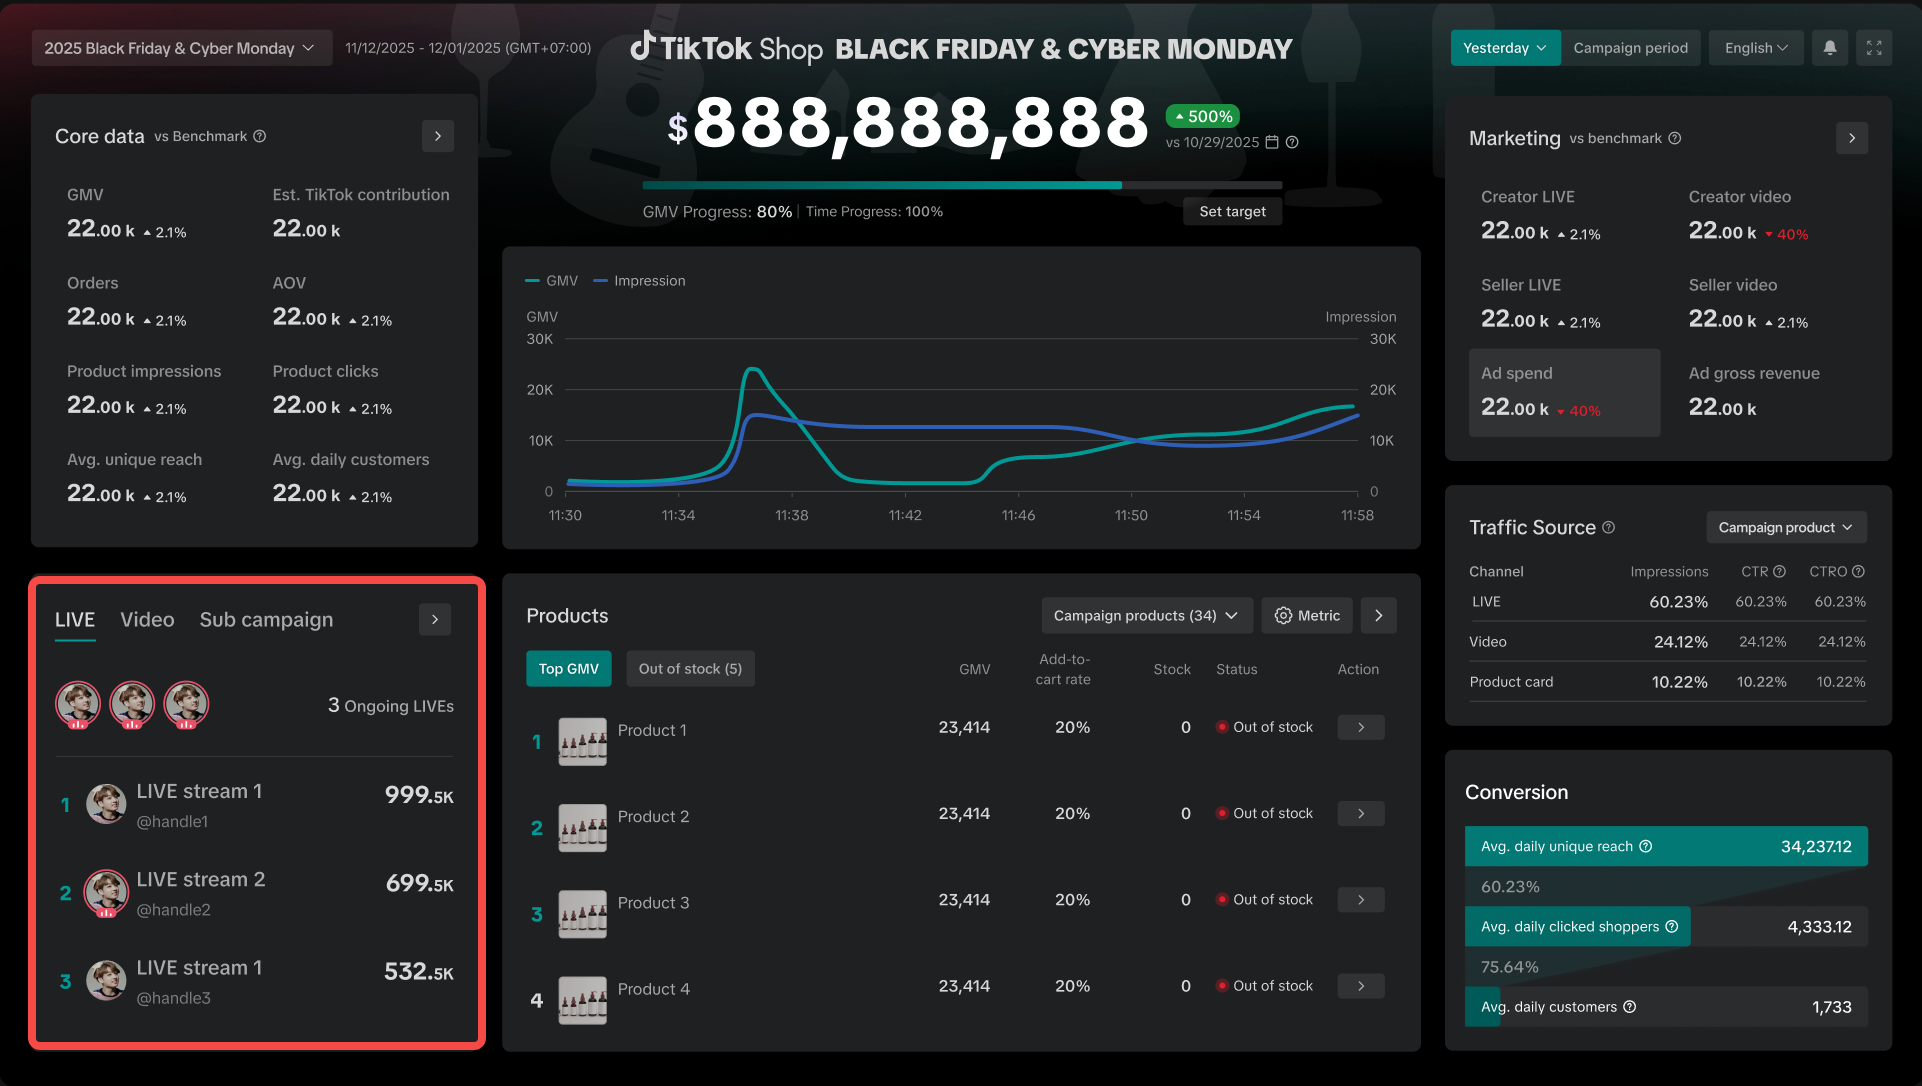
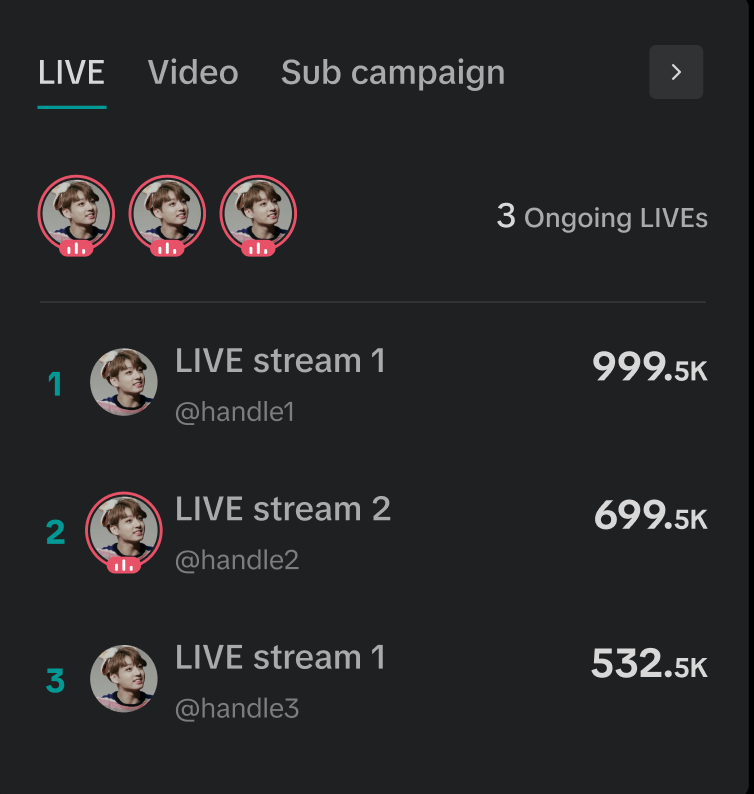
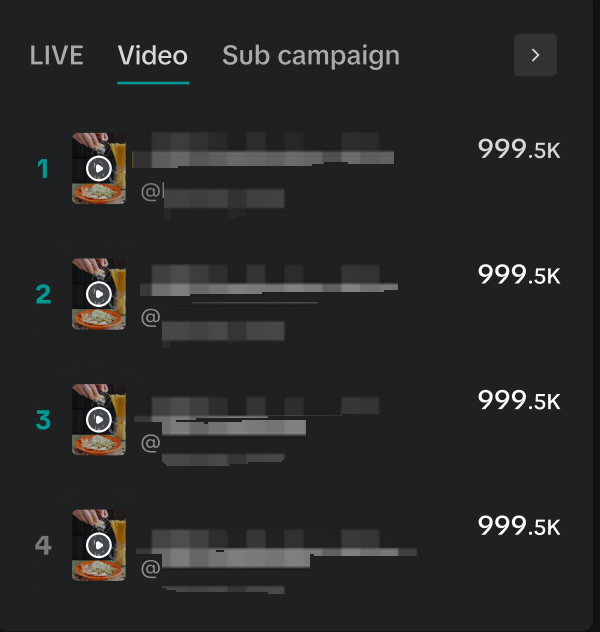
Content and Sub-campaign performance ranking
We combined LIVE, Video, Sub campaign modules into one section now,- In the LIVE and Video modules, the top performing content is listed out in real-time, including your own content and affiliate content. Any existing LIVE violations will be indicated at the top of the LIVE module. For a more detailed analysis, click on the Arrow icon.
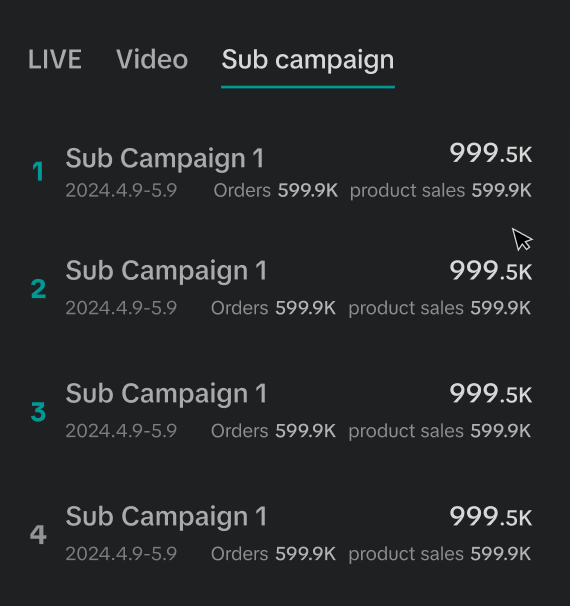
- In the Sub campaign module, view the orders and revenue of sub campaigns that you joined.
 |  |  |
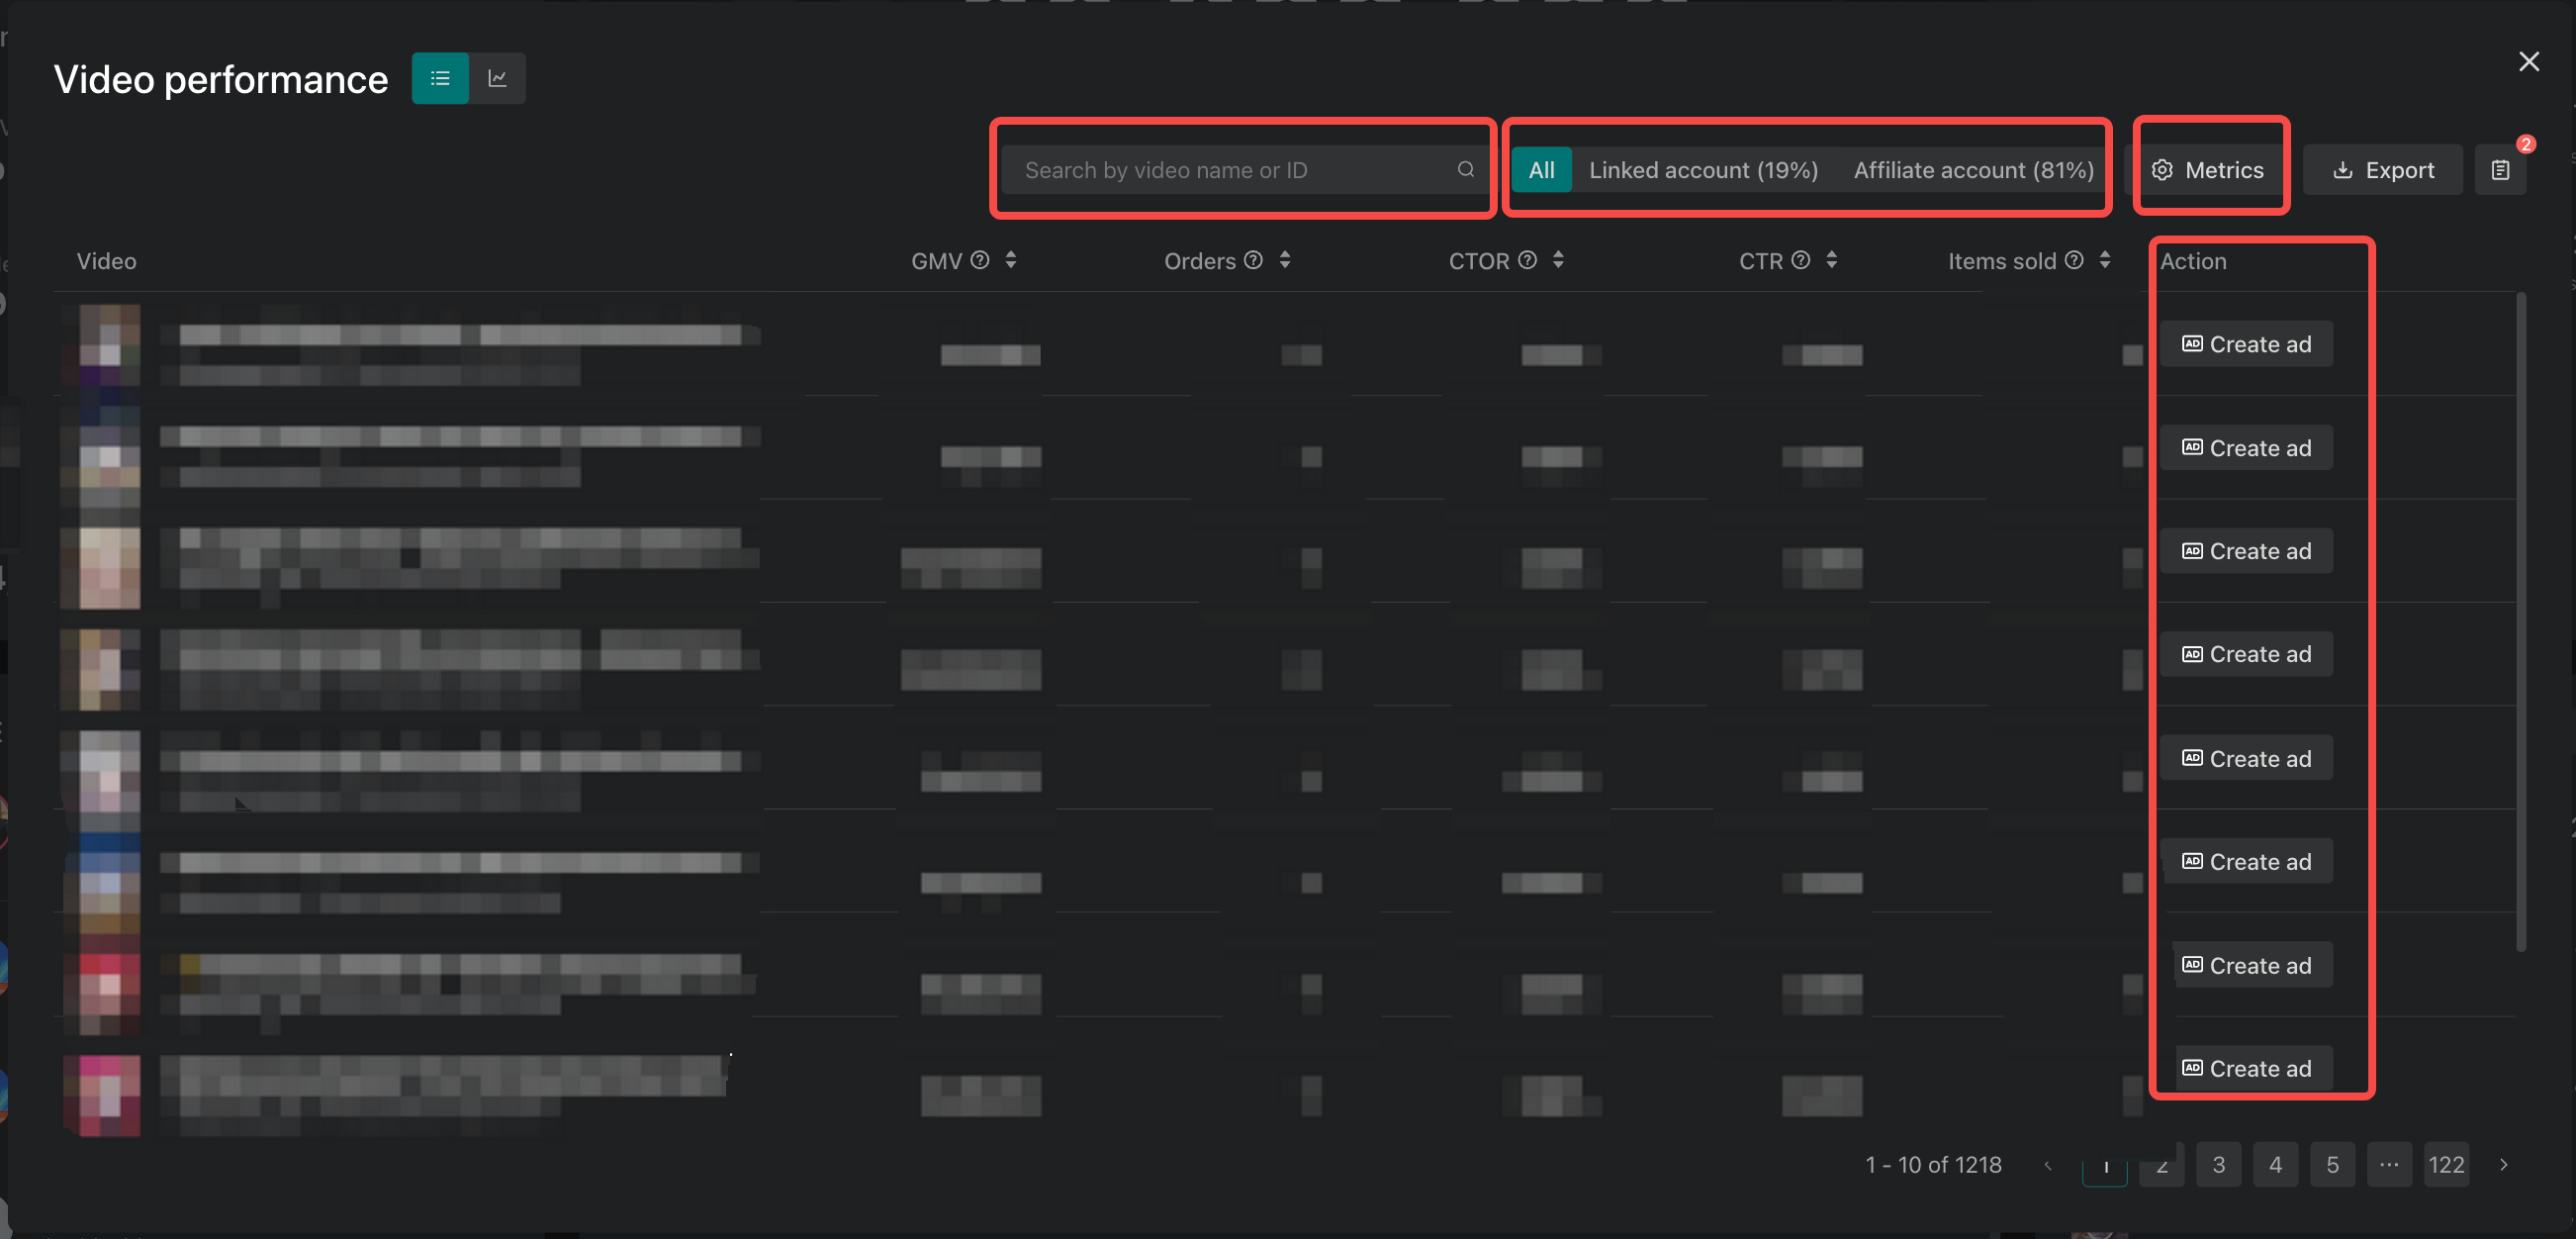
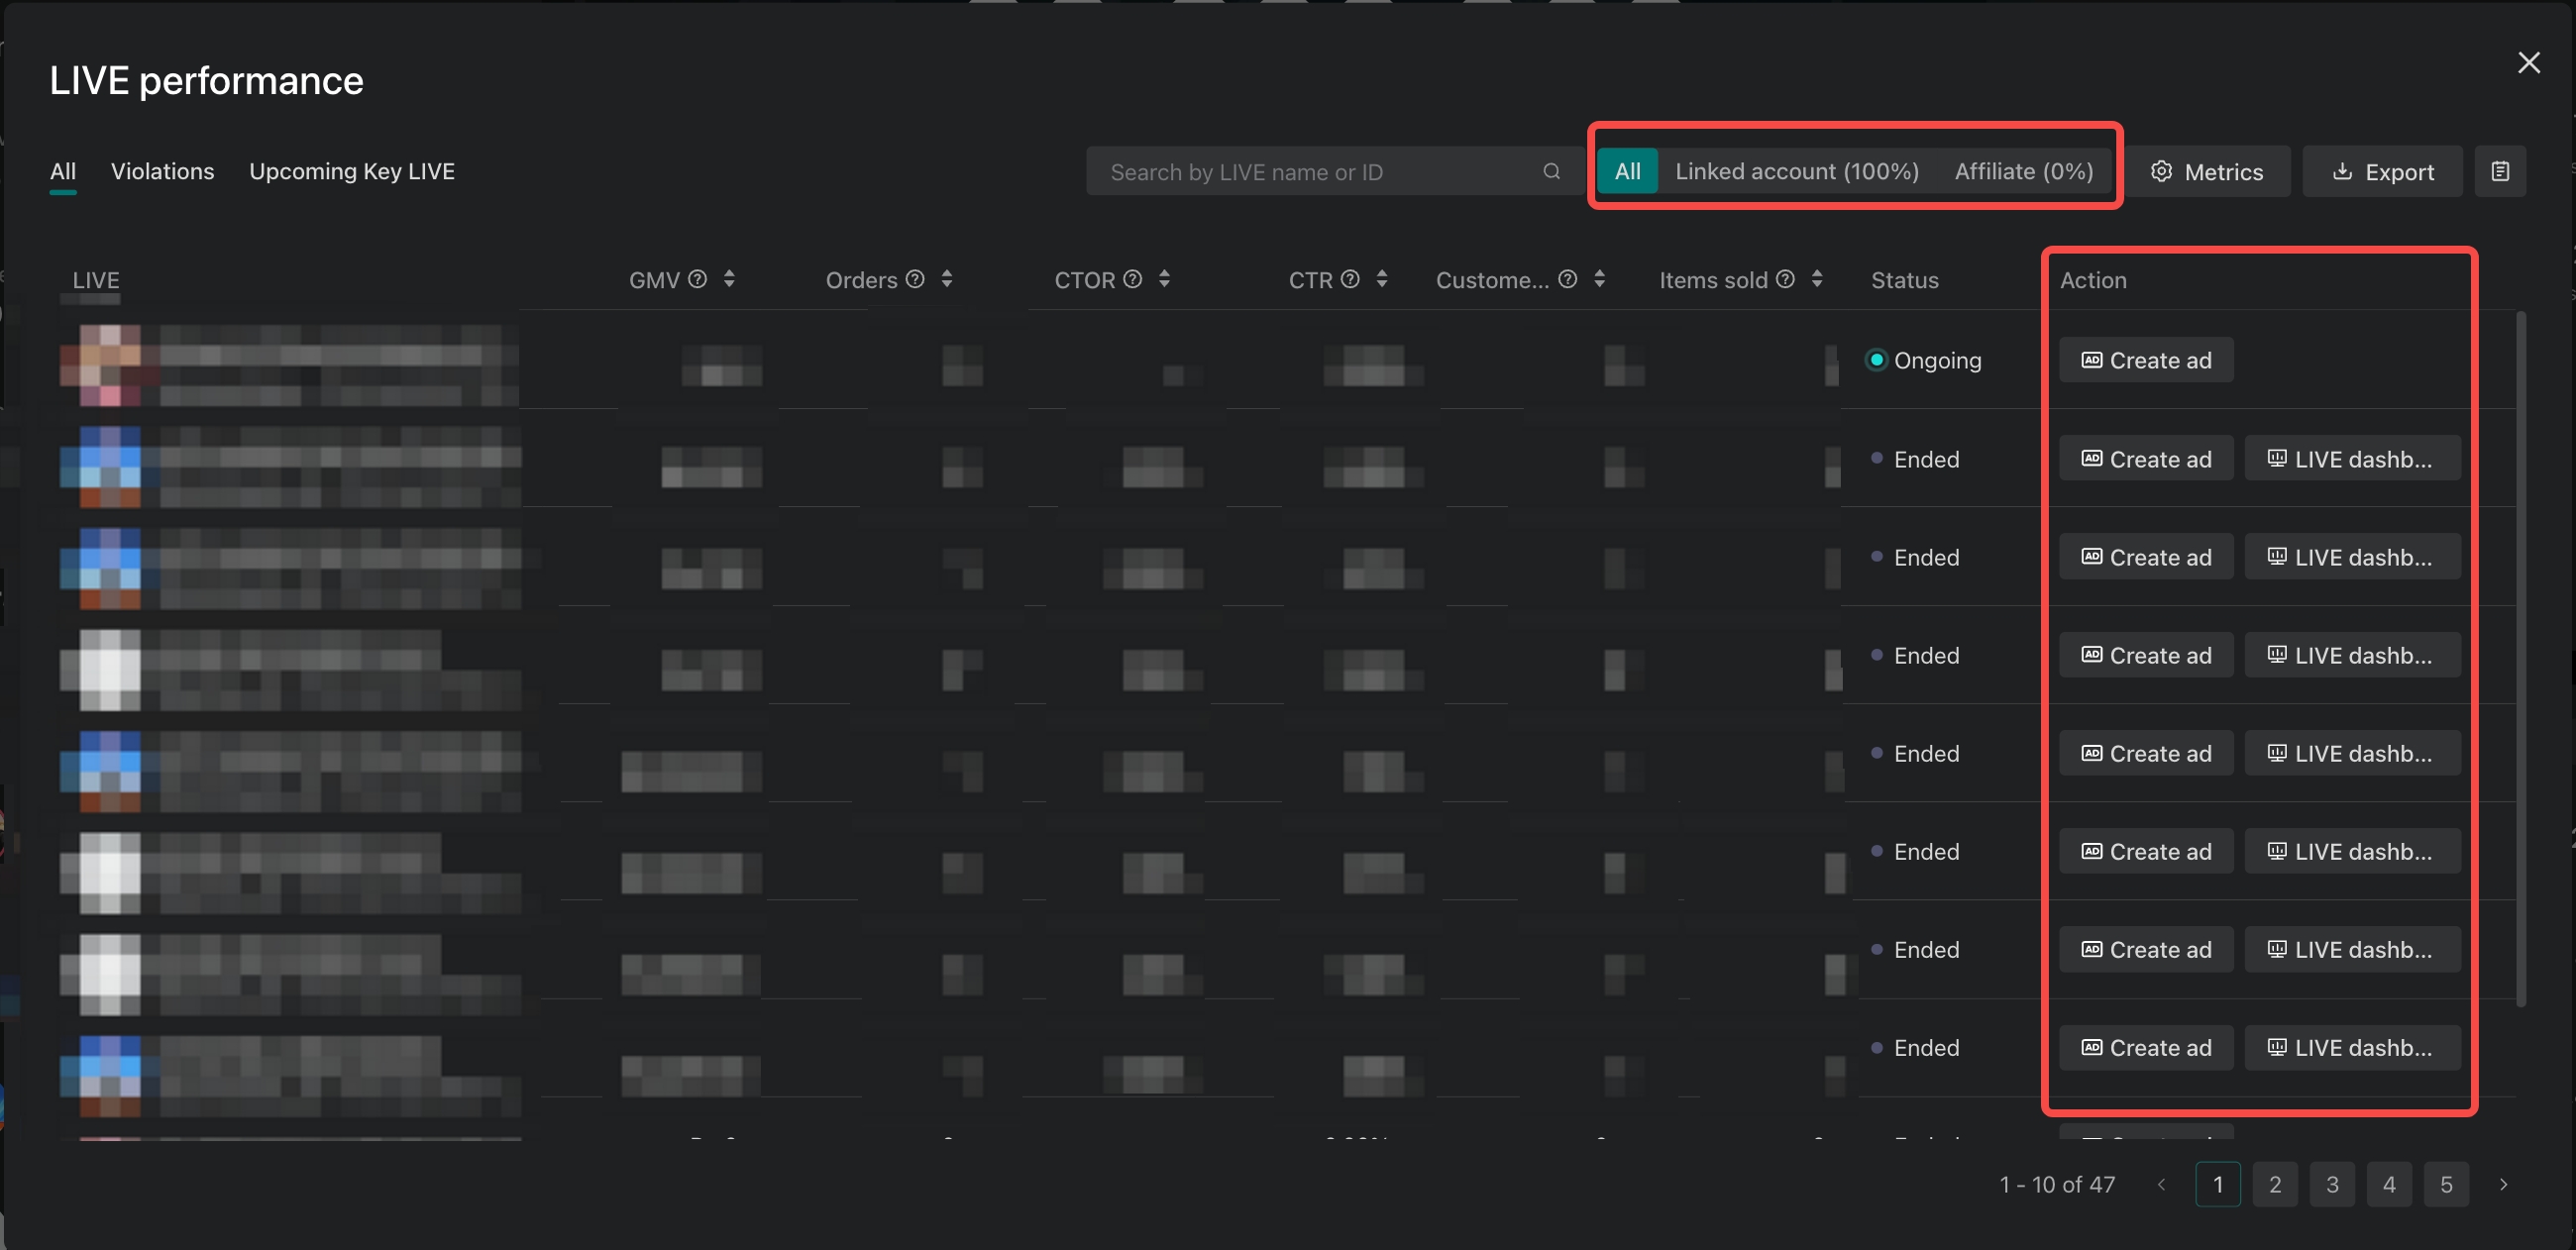
- On the detail page, more metrics are available when you click Metrics to customize, and you can also search for a specific video in the search bar. Additionally, you can switch between linked-account and affiliate video with just one click on the top of the table — GMV contribution rates are provided here.
- Similar to the video detail page, more metrics are available when you click Metrics to customize, and you can also search for a specific LIVE in the search bar. Additionally, you can switch between linked-account and affiliate LIVE with just one click on the top of the table.
- You can switch to view any LIVEs with violations, or LIVEs that have joined Key Livestream sessions with just one click on the quick filter. If you need more detailed analytics on LIVE, click Live Console to achieve real-time monitoring or a performance recap.
Product performance and inventory alerts
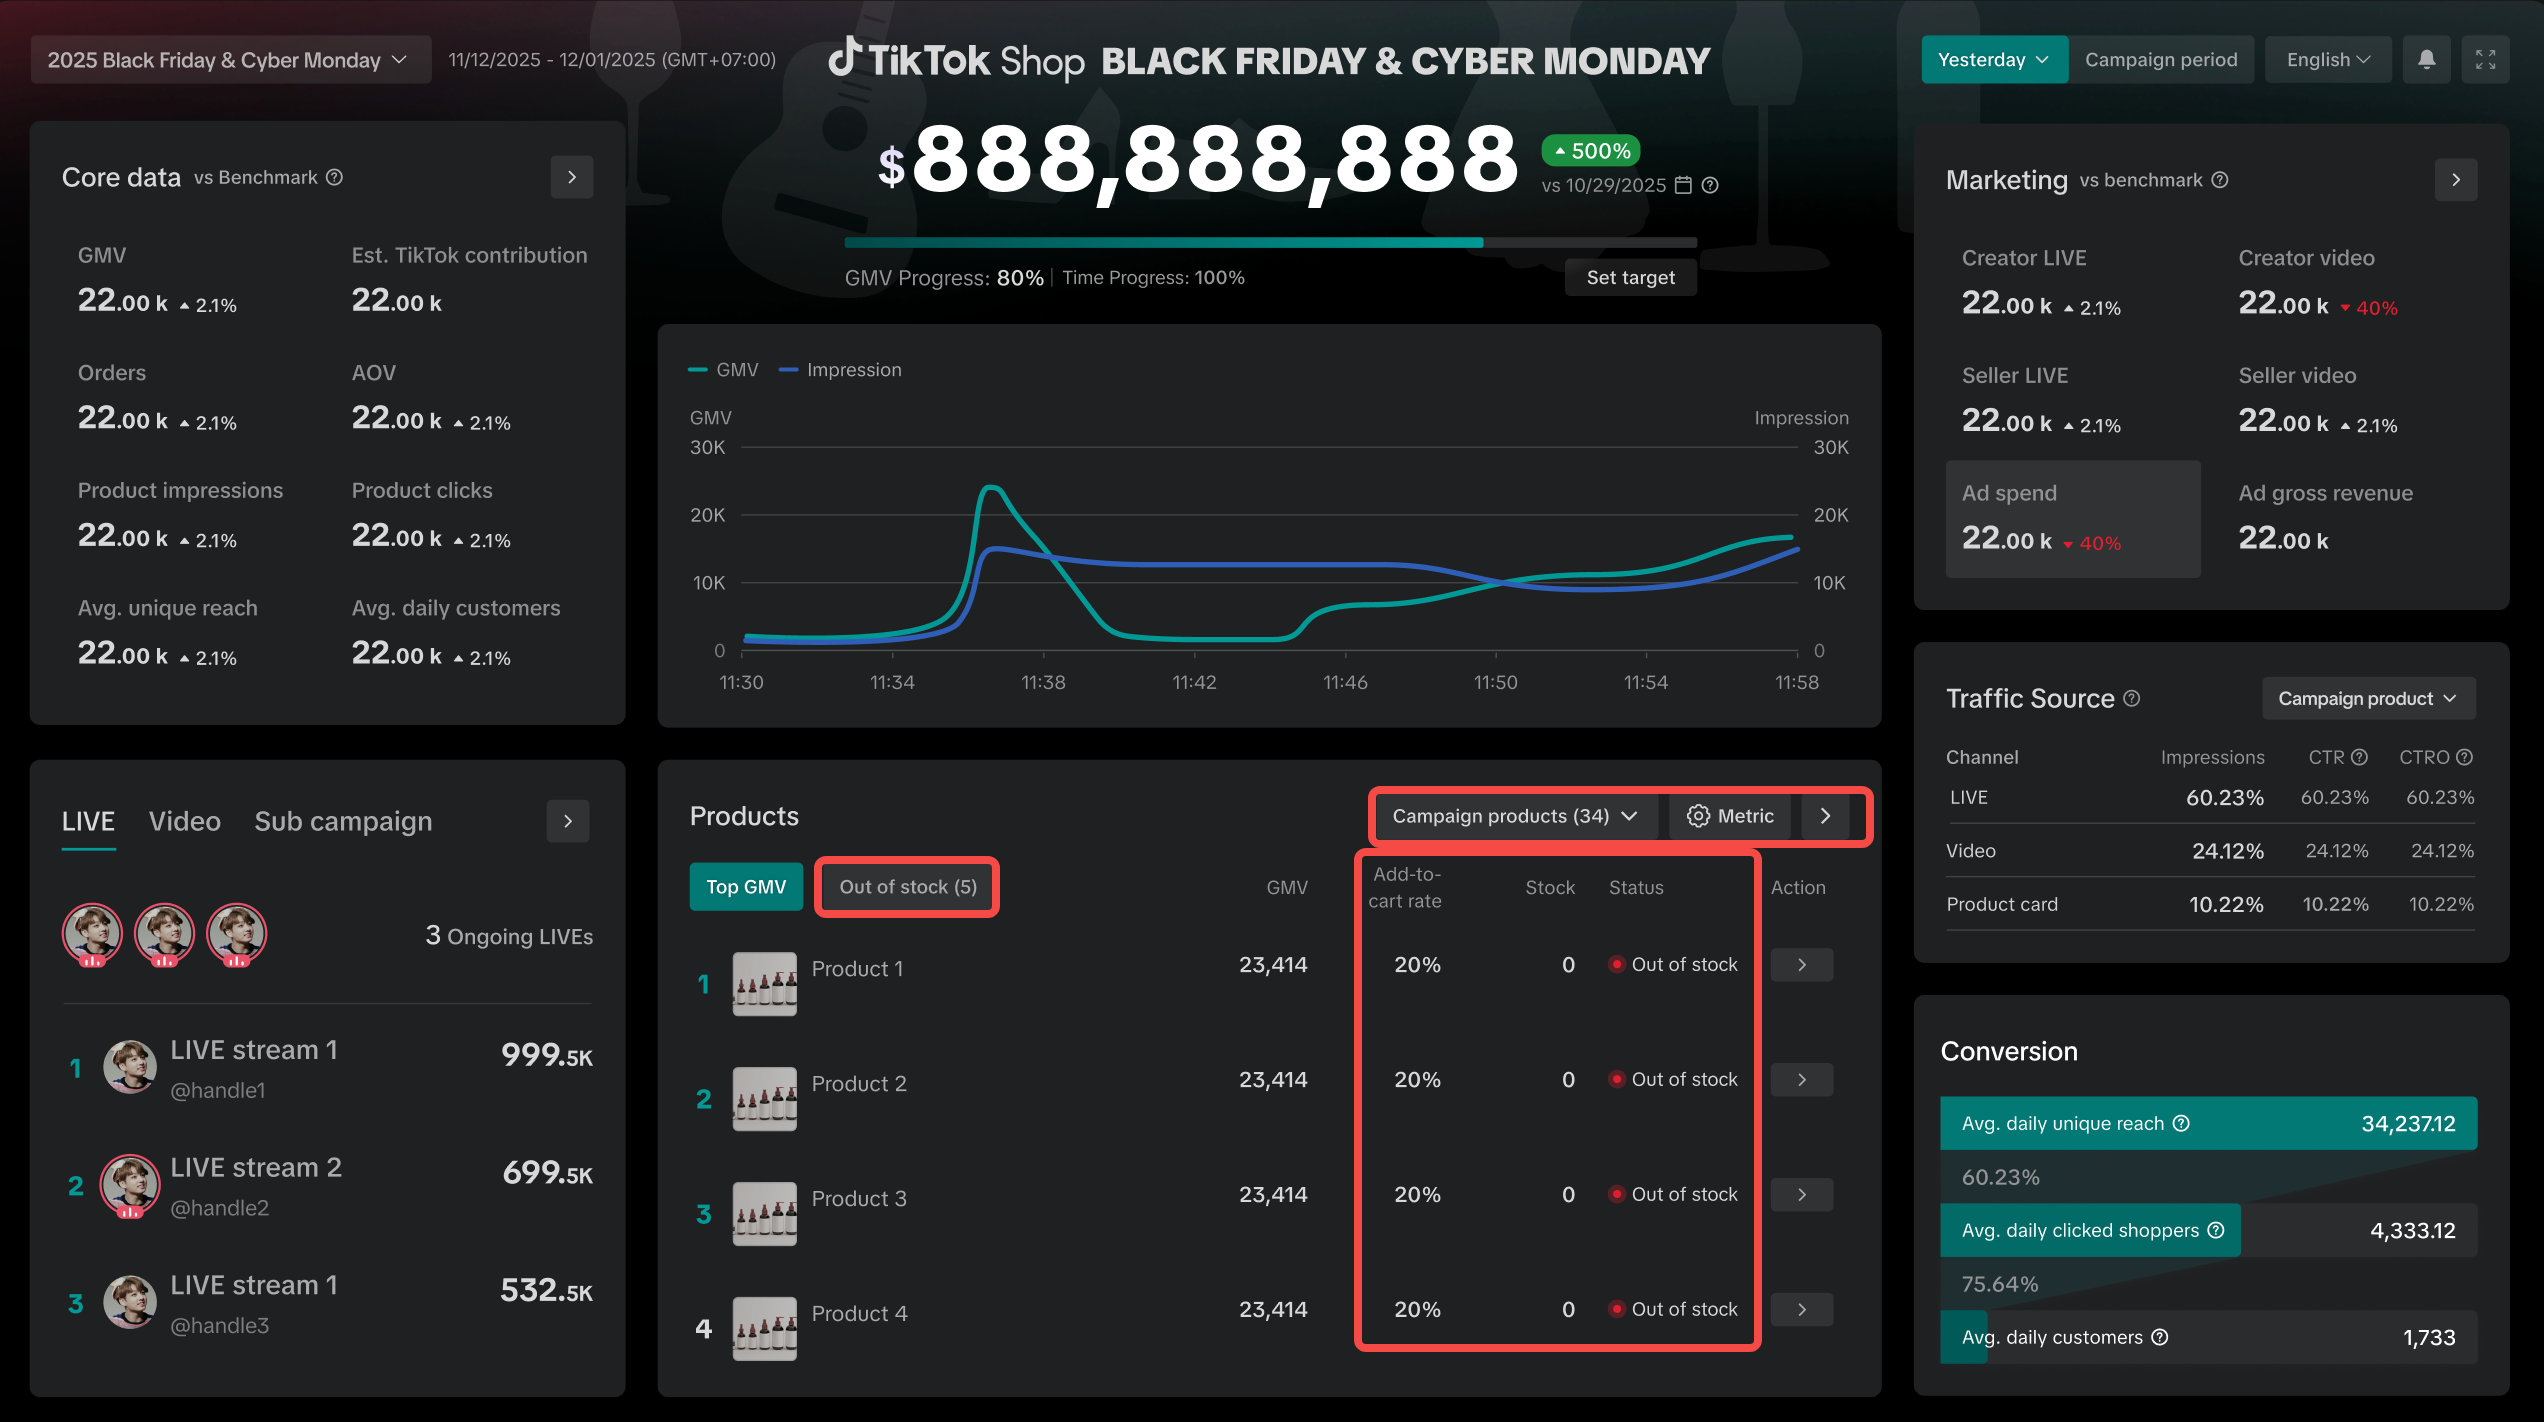
You can click Metric on the top-right to customize the metrics you want to view. Click on the Arrow icon to view the product table for detailed analysis.Core metrics for product stock management:
- Add-to-Cart Rate: The percentage of individual customers who added products to their cart after viewing the product detail page to help you identify potential high-demand items, enabling better inventory and promotion planning
- Stock: Real-time product stock statuses are provided for you to quickly view your inventory and take any action needed.
- Status: Stock status will give you alerts on upcoming out-of-stock issues in the next 7 days or within the campaign period, depending on which period is shorter.
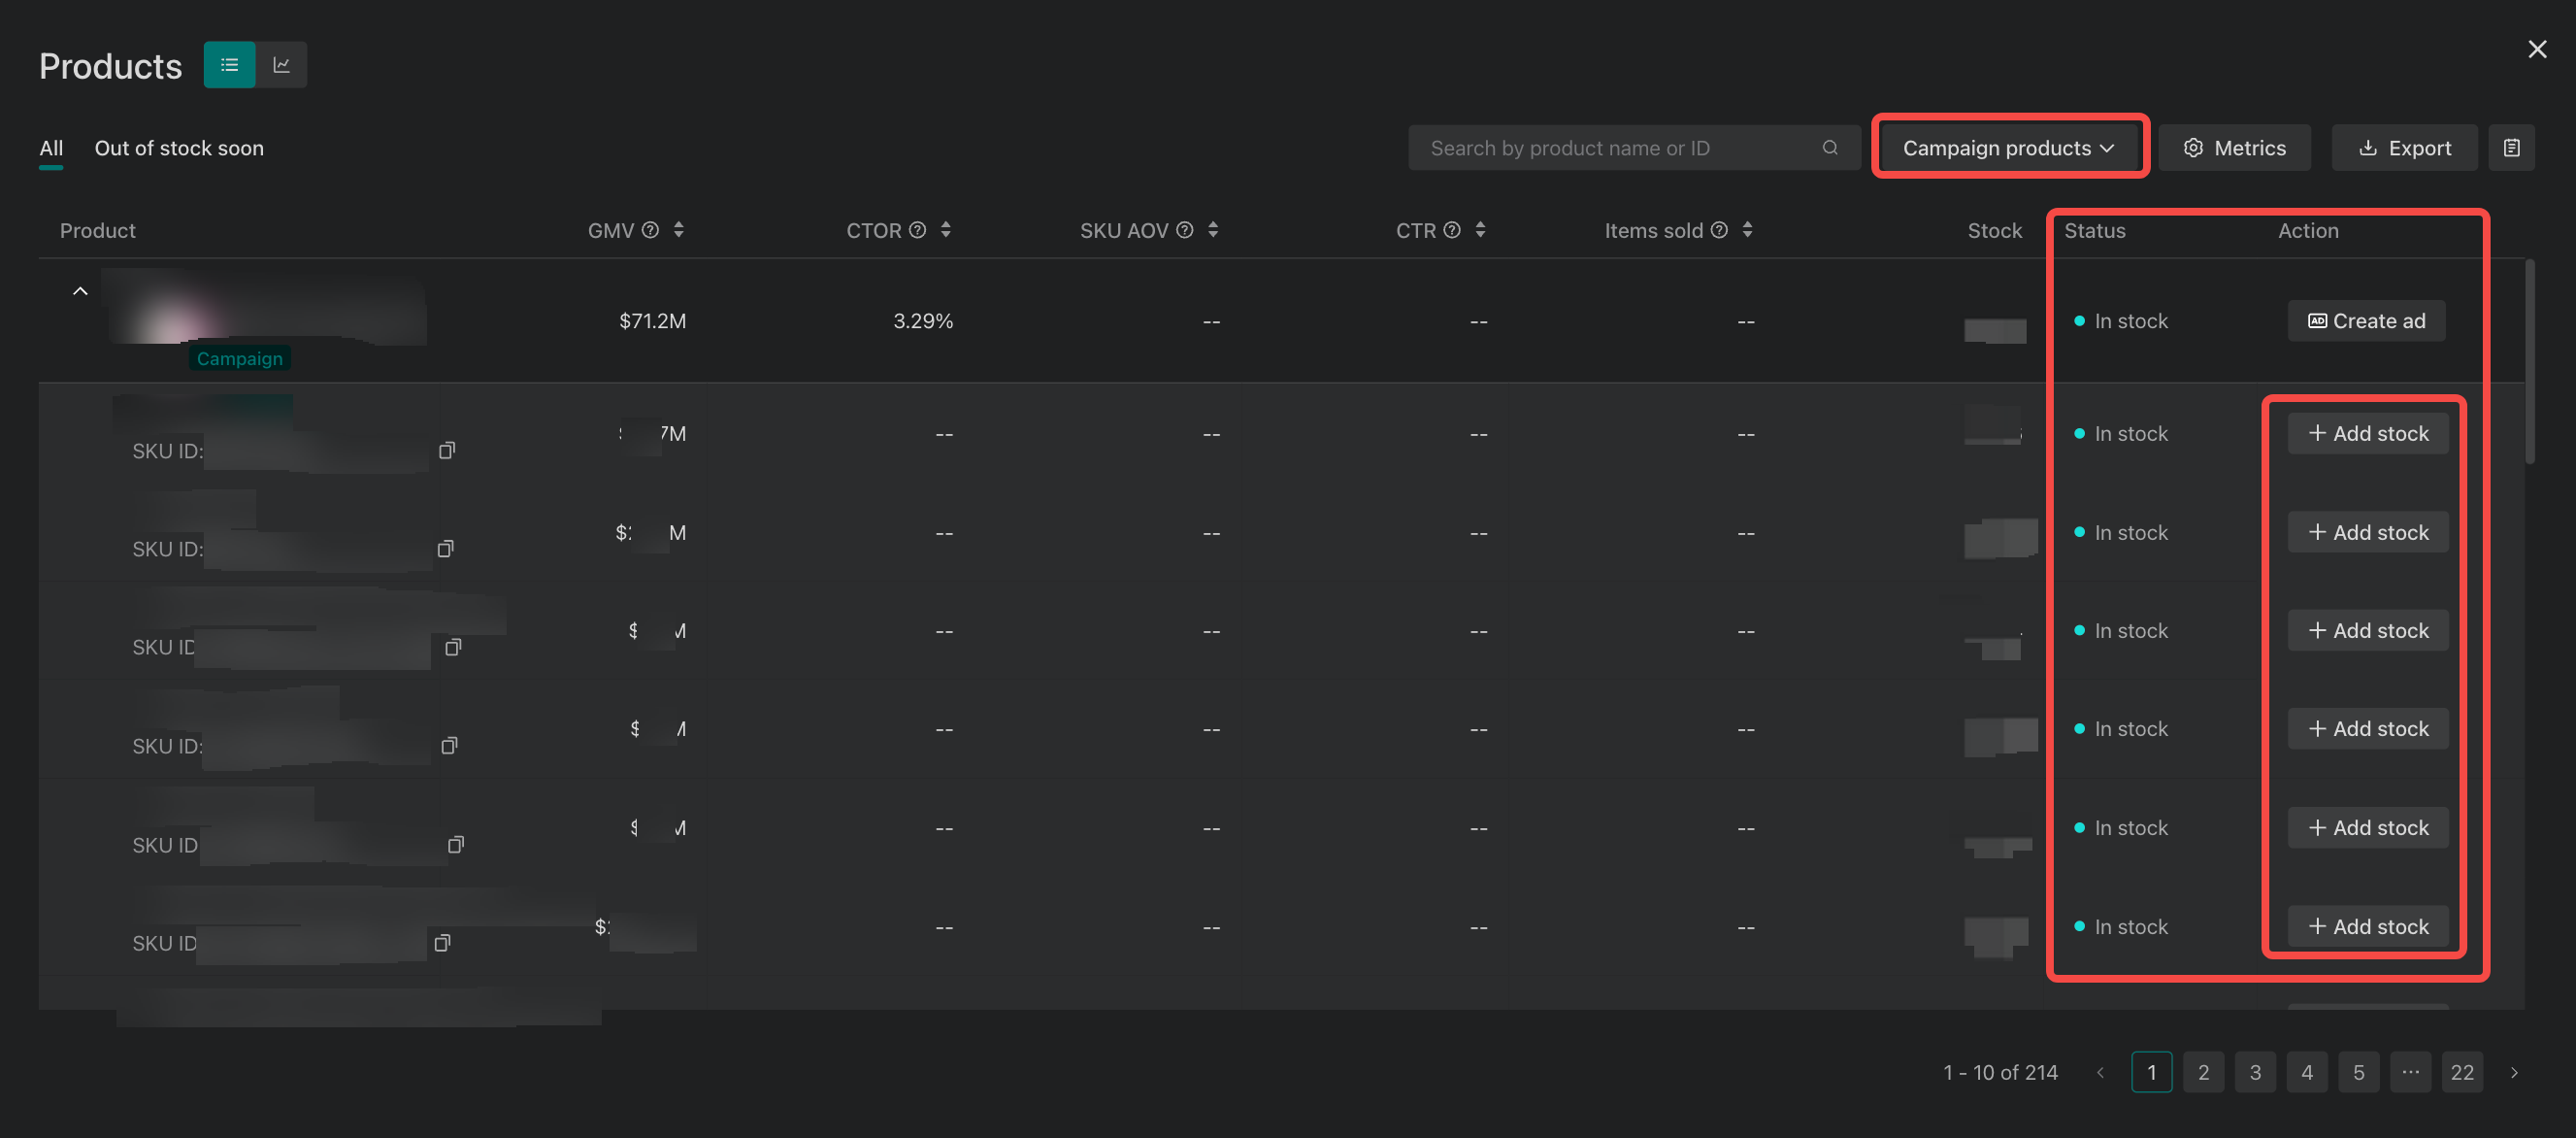
Out of Stock filter: Select the Out of Stock filter to view all the campaign products that need to be replenished. You can also easily create ads for the top products with just one click.
- Click Create Ad to launch advertisements for the product
- At SKU level, click + Add Stock to replenish inventory for the product
Traffic Source Breakdown
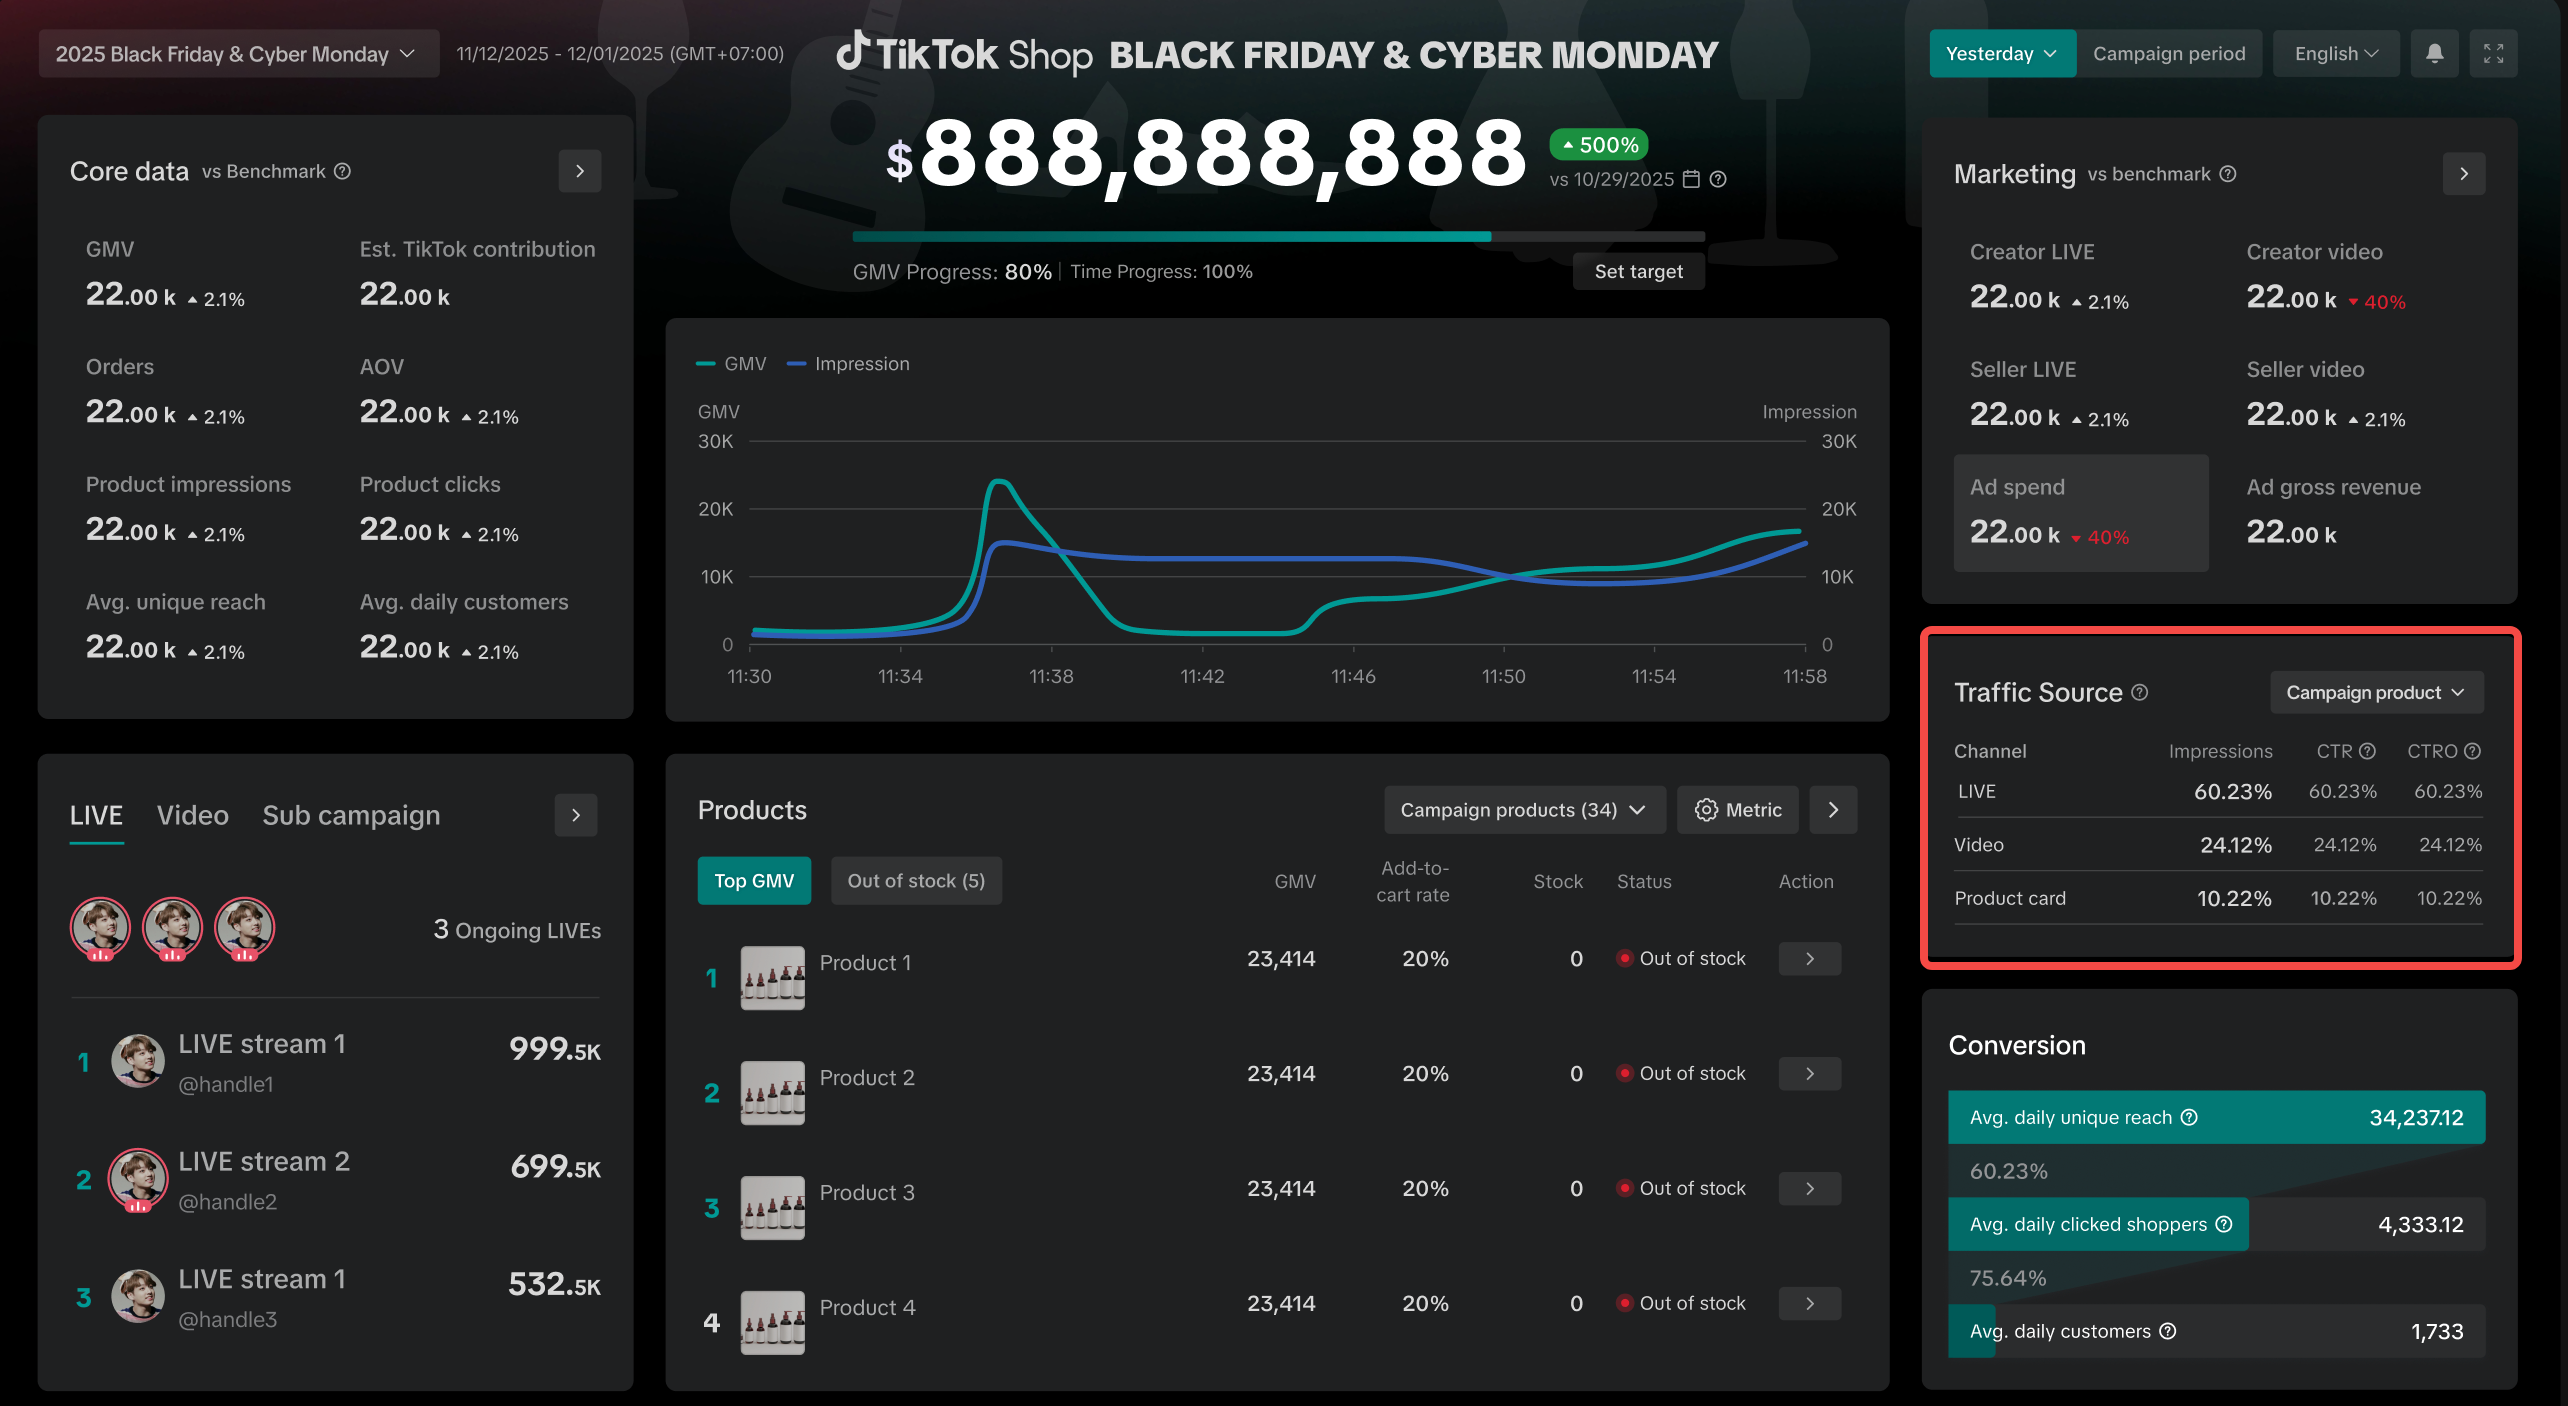
We introduced a new Traffic section, providing deeper visibility into the distribution, engagement and conversion efficiencies of your product impressions. You can combine the Traffic section with the Marketing section to strategize your optimization.Key metrics include:
- Impression Share: Understand which channels contribute the most exposure to your campaign.
- CTR: Click-Through Rate - measure how effectively your products attract shopper interest.
- CTOR(SKU Orders): Click-to-Order Rate - calculated as SKU Orders ÷ Clicks. This metric helps you assess the efficiency of converting engagement into actual orders
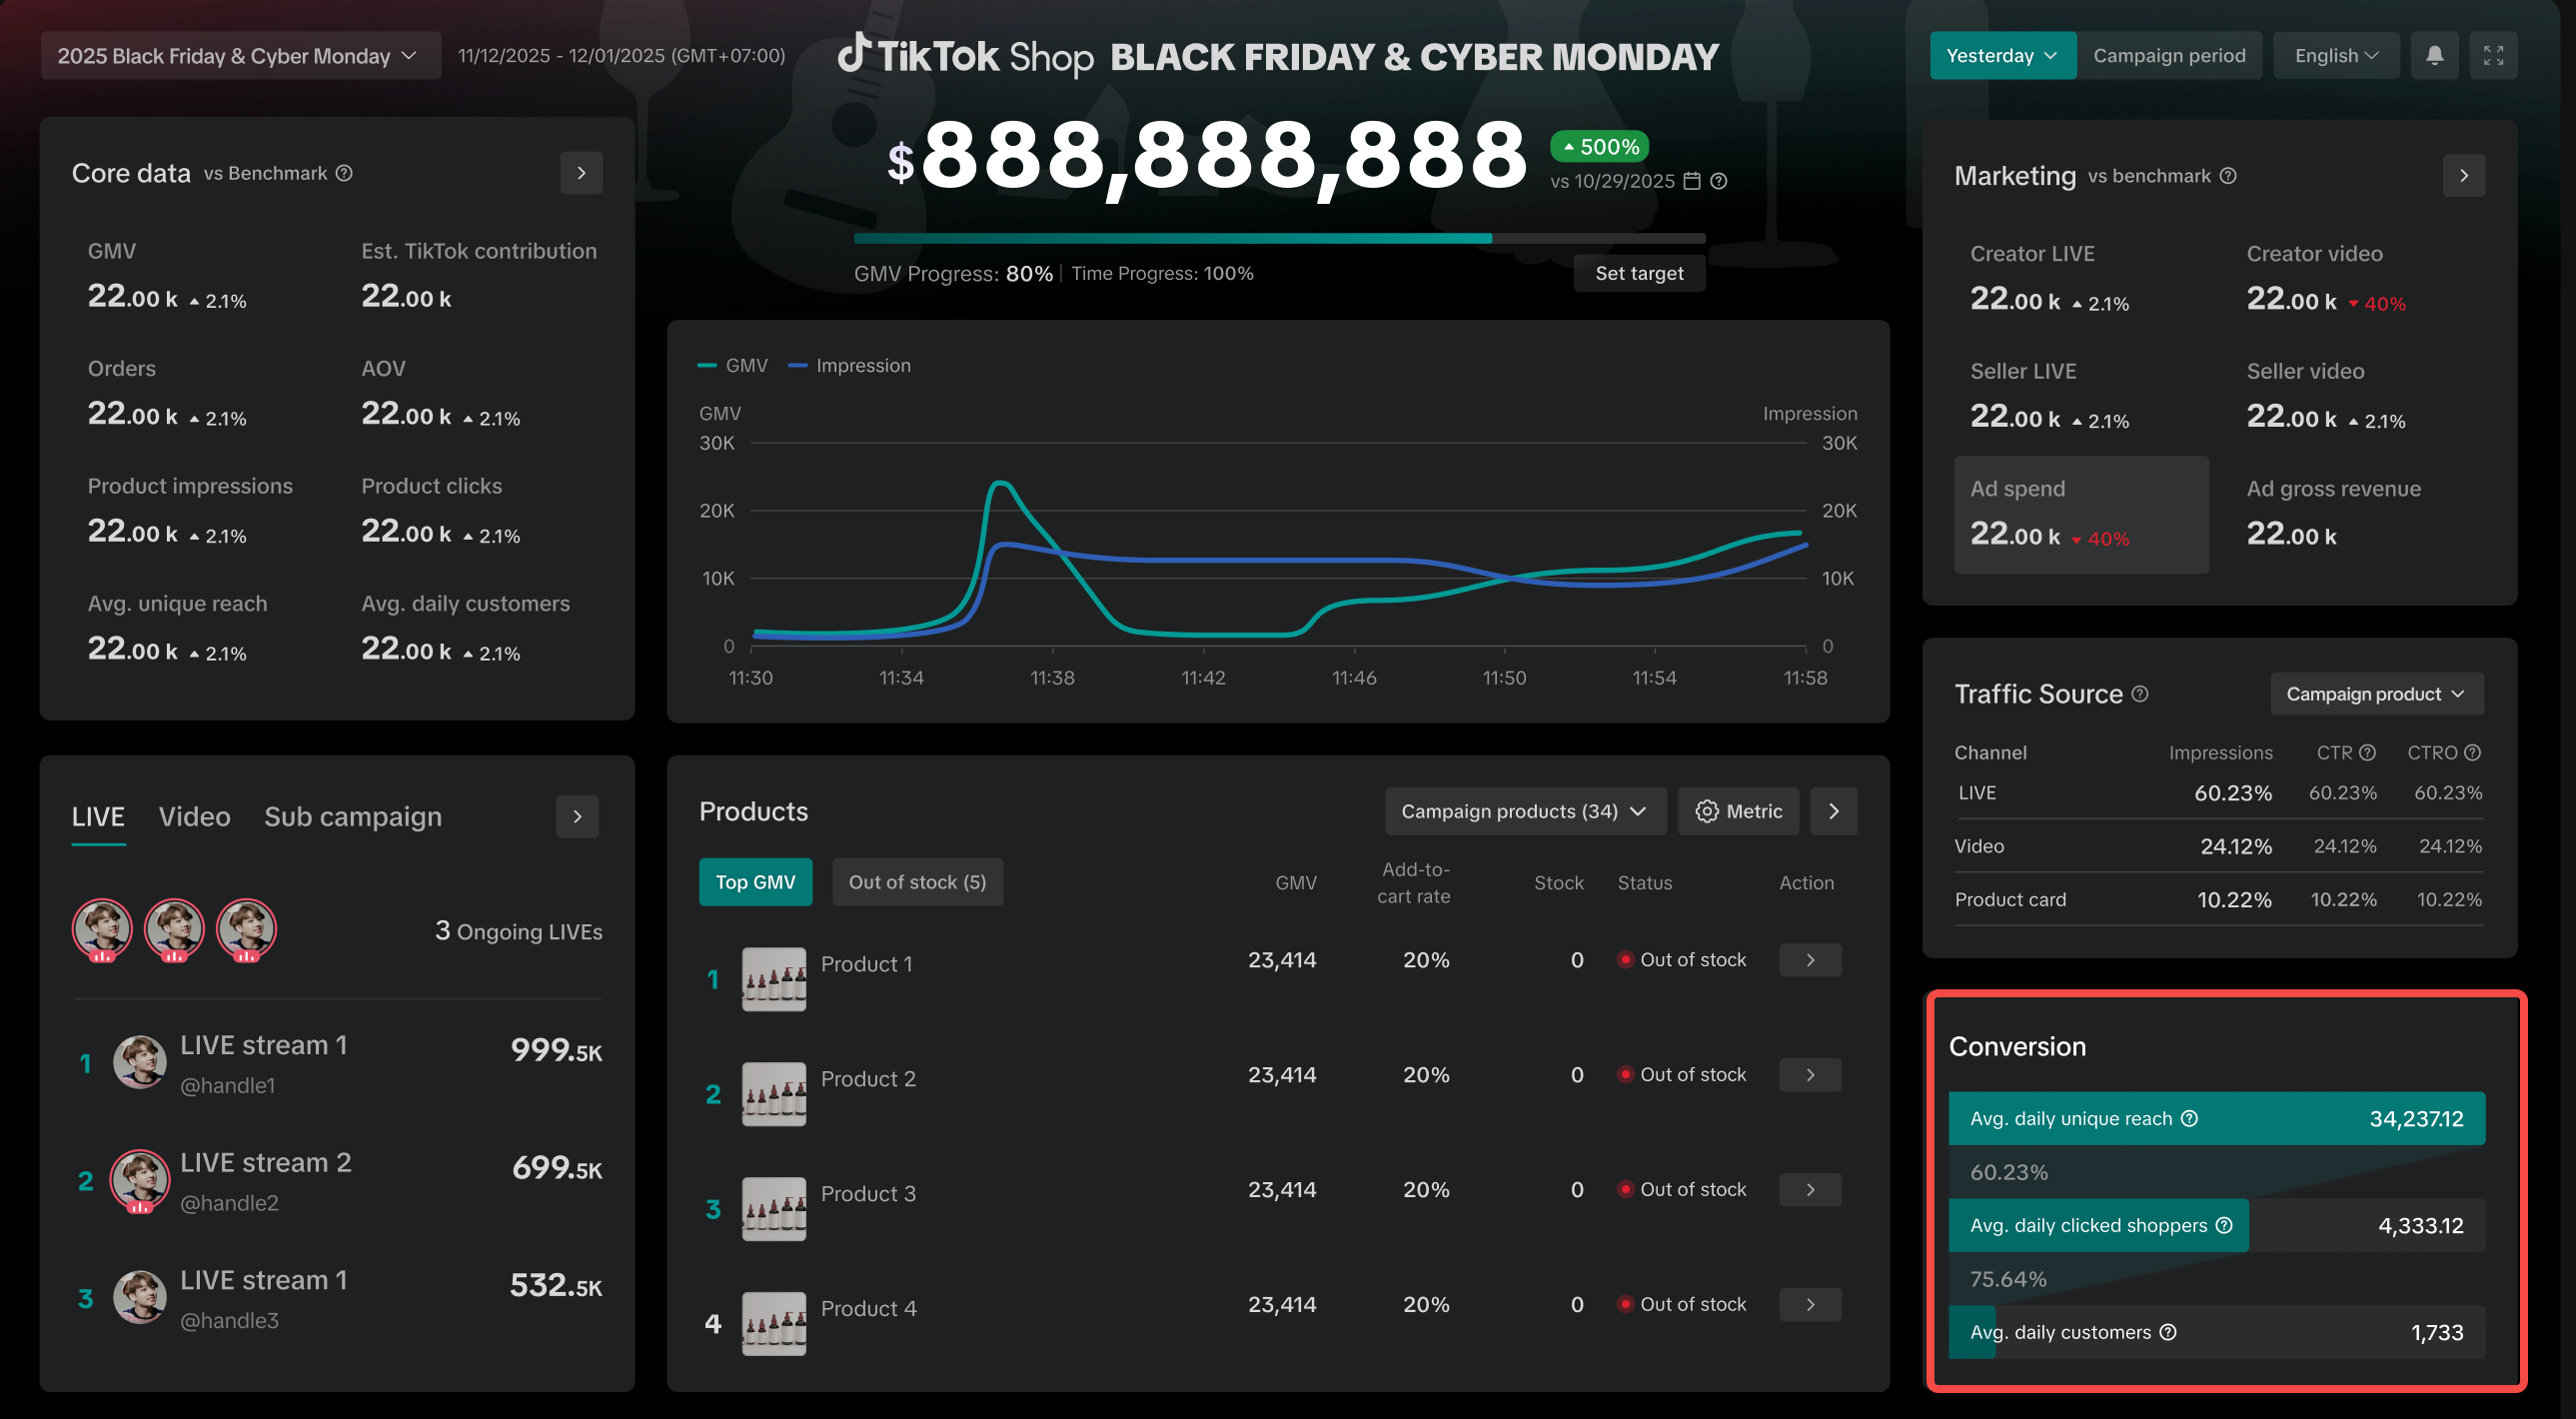
Conversion Funnel
We added a new Funnel View that visualizes the shopping journey from exposure to conversion, helping you understand performance more intuitively across different stages of the campaign.This view provides a clear breakdown of your shop's unique reach, clicks, and conversion behaviors, enabling data-driven decisions to improve campaign efficiency.
Key metrics include:
- Avg. Unique Reach – The average daily number of distinct users exposed.
- Avg. Unique Clicks – The average daily number of unique users who clicked on your product impressions.
- Avg. Daily Customers – The average daily number of customers who completed purchases.
You may also be interested in

The Seller Guide to Shop Tab Success
*What is Shop Tab? Shop Tab is another way for shoppers to discover your products on TikTok Shop. As…

How to resolve SKU errors
If you need to edit your product's retail prices or add, delete, or edit a SKU while it is registere…

LIVE Price Match Guarantee using Co-funded LIVE Flash Sale
Introduction: What is LIVE Price Match Guarantee? During Deal for You Days from July 7 - July 19, 20…

Marketing benefits package
Product Overview Marketing Benefits Packages are a collection of placements and promotions on TikTok…

Campaign FAQs
Key Points: Your shop is eligible to enroll in campaigns if you meet the minimum criteria, includin…

How to Register for Content Campaigns in the TikTok App
How to Register for Content Campaigns in the TikTok App Content campaigns on TikTok Shop allow creat…

How to register for standard / advanced registration?
What is Standard Registration? Standard Registration allows you to register products that meet speci…

How to register for flash sale campaigns
What is a TikTok Shop Flash Sale Campaign? A Flash Sale campaign is a limited-time promotion that le…

How to register for content campaigns
Product Overview Content campaigns on TikTok Shop are special events that give you a chance to boost…

TikTok for Shopify: Promotions Sync
*Overview: Shopify sellers can sync Promotions/Discounts except Free Shipping on Shopify directly to…