Shop Page Analytics
05/07/2024
Summary
What are the core capabilities of the Shop Page Performance analysis on TikTok Shop?
- It provides key metrics reflecting the current status and historical trends of shop page performance.
- It identifies top-selling products to understand customer preferences.
- It tracks traffic channel contributions to optimize promotion strategies.
How can sellers utilize the Shop Page Performance analysis to improve their shop design and sales?
- Sellers can analyze key metrics like GMV, orders, units sold, and conversion rate to understand performance fluctuations.
- By identifying top-selling products, sellers can tailor offerings to customer preferences.
- Analyzing traffic sources helps in strategizing improvements and promotions.
What are the key metrics available in the Shop Page Performance analysis, and how can they be used?
- Key metrics include GMV, orders, units sold, and conversion rate.
- These metrics help in assessing traffic and conversion performance, identifying trends, and understanding reasons for performance fluctuations.
How can sellers analyze traffic sources to optimize their TikTok Shop strategy?
- Sellers can view a pie chart breakdown of GMV or units sold by traffic sources like Shop Tab, Search, Livestream, and more.
- Detailed data on each source, including impressions and PV, helps in tracking daily trends and strategizing accordingly.
Access feature here: https://seller-us.tiktok.com/compass/shop-tab?timeRange=2024-02-27%7C2024-03-05
A good shop design can help you personalize your shop to be aligned with your branding and make it more attractive to customers, which will earn customers' trust and generate more sales.Considering the shop page is an important way to attract customers and improve conversion, we built the Shop Page Performance analysis to help you better understand the business performance of your shop page and optimize the shop design to help achieve your business goal.
Core capabilities:
🔥Check out key metrics which reflect the current status and historical trend of the business performance of your shop page
🔥Identify the top selling products through your shop page to get to know your customers' preference
🔥Track the contribution of each traffic channel from where users come to your shop page, which helps you identify improvement and promotion strategies to drive more revenue.
Detailed introductions:
Entrance: Seller Center >> Analytics >> Shop Tab Analytics >> shop Page Performance tab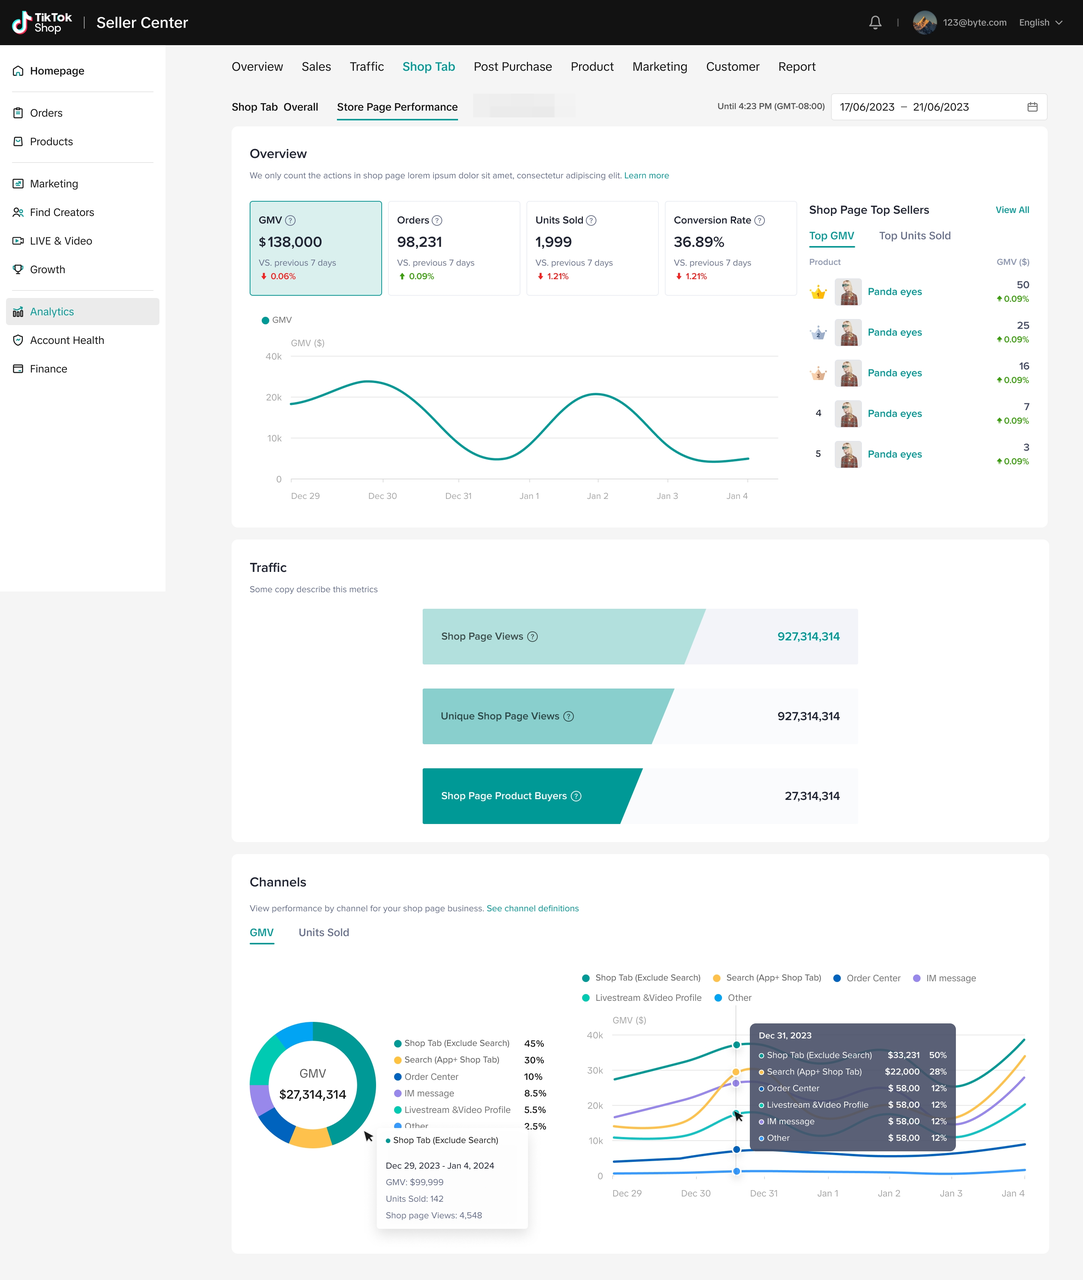 Pick up the time period that you focus on the right top date picker.
Check out overview performance of your shop page
In the overview section, check out the 4 key metrics that reflect the traffic and conversion performance on your shop page:--GMV, orders (main order), units sold, conversion rate.
Identify the performance fluctation and further investigate the reasons by comparison rate with the previous period of time and the trend charts below.
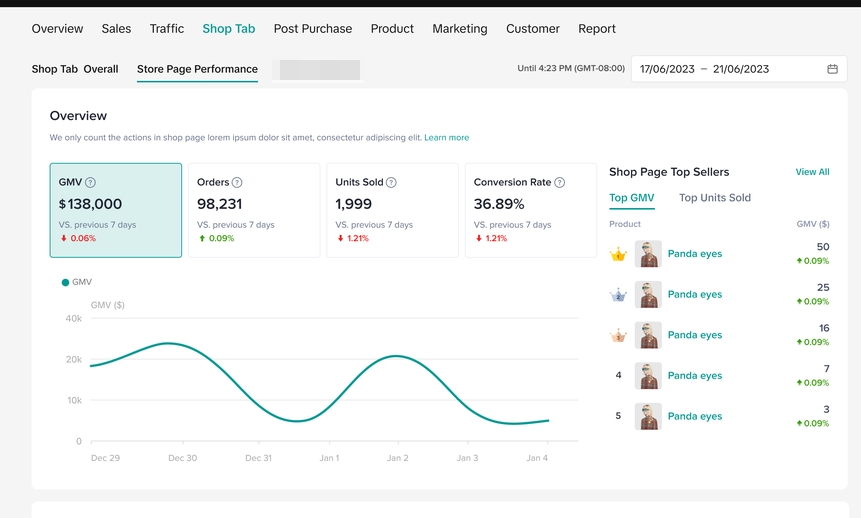
Identify the top selling products through your shop page
Toggle between the Top GMV and Top units Sold tab to see the top selling products through your shop page, and further analyze your customers' preferences. Try to provide more products catering to the customers' preferences to boost revenue.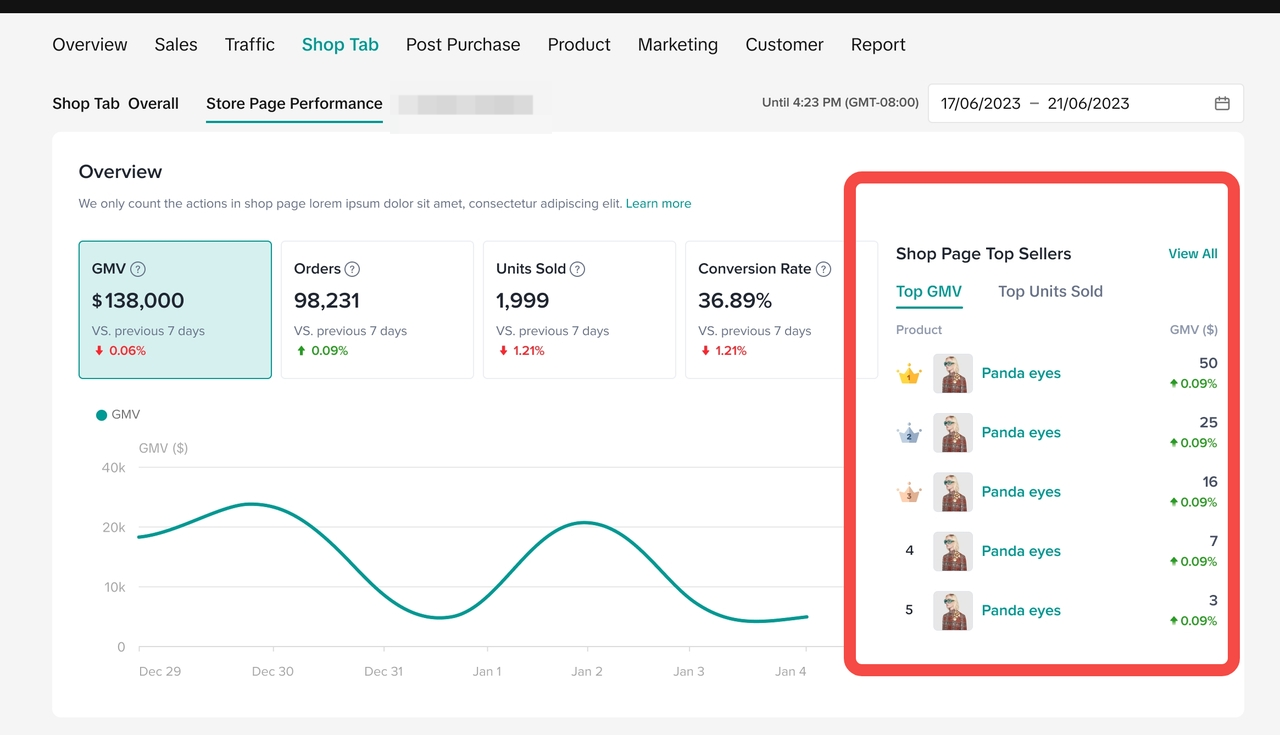
Traffic funnel metrics
Analyze the conversion gaps by the transaction funnel data from shop page views to unique shop page views, and shop page product buyers.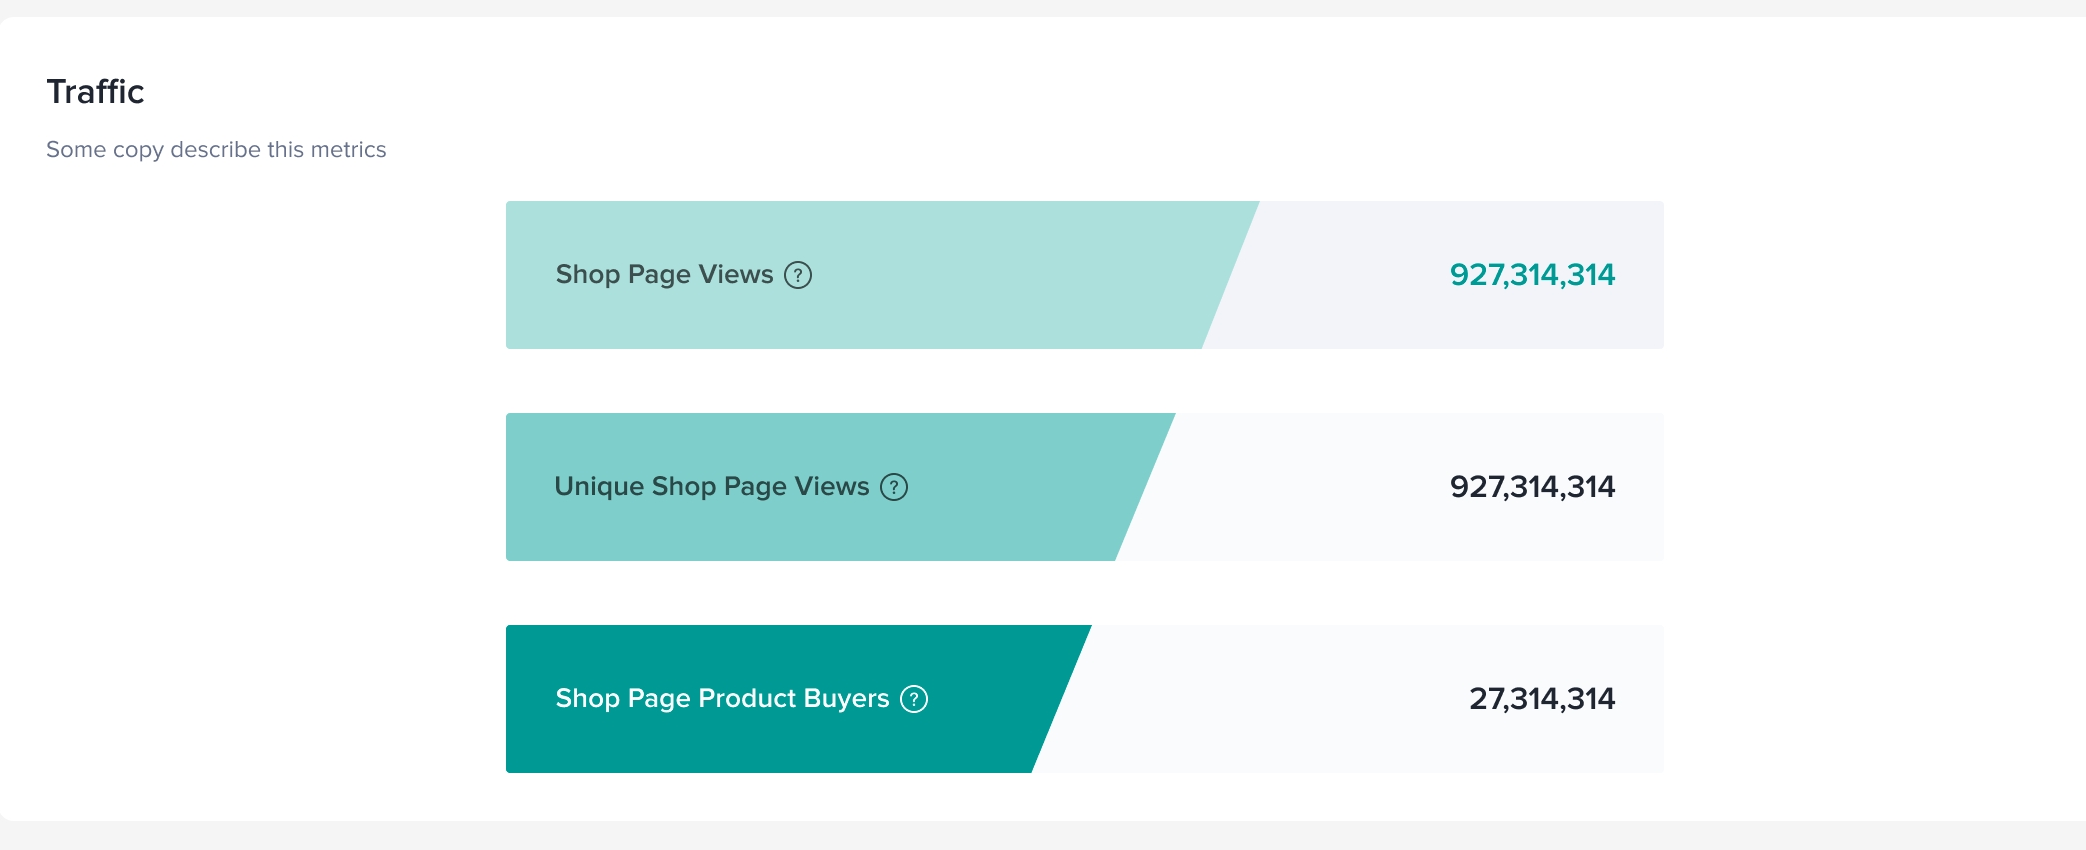
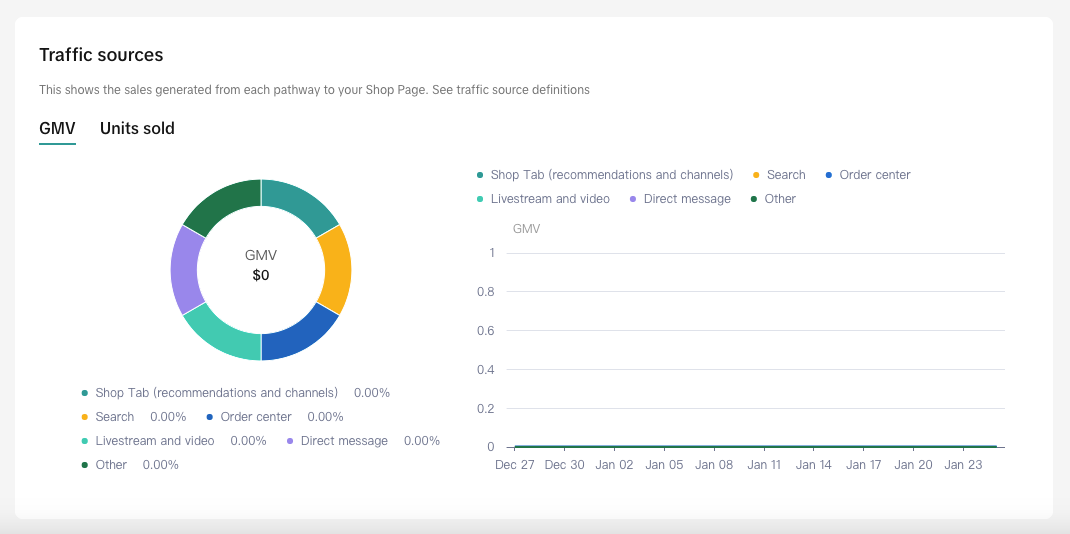
Analysis contributions of all traffic sources
- In the traffic sources section, check out the pie chart of the GMV or units sold to breakdown by different traffic sources, including Shop Tab(recommendations and channels), Search, Order center, Llvestream and video, Direct message and other channels.
- Hover to the pie chart, you are able to see the detailed data of the specific source including GMV, units sold, impressions and PV.
- Track the daily trends of each traffic source with the right side trend lines.
FAQ:
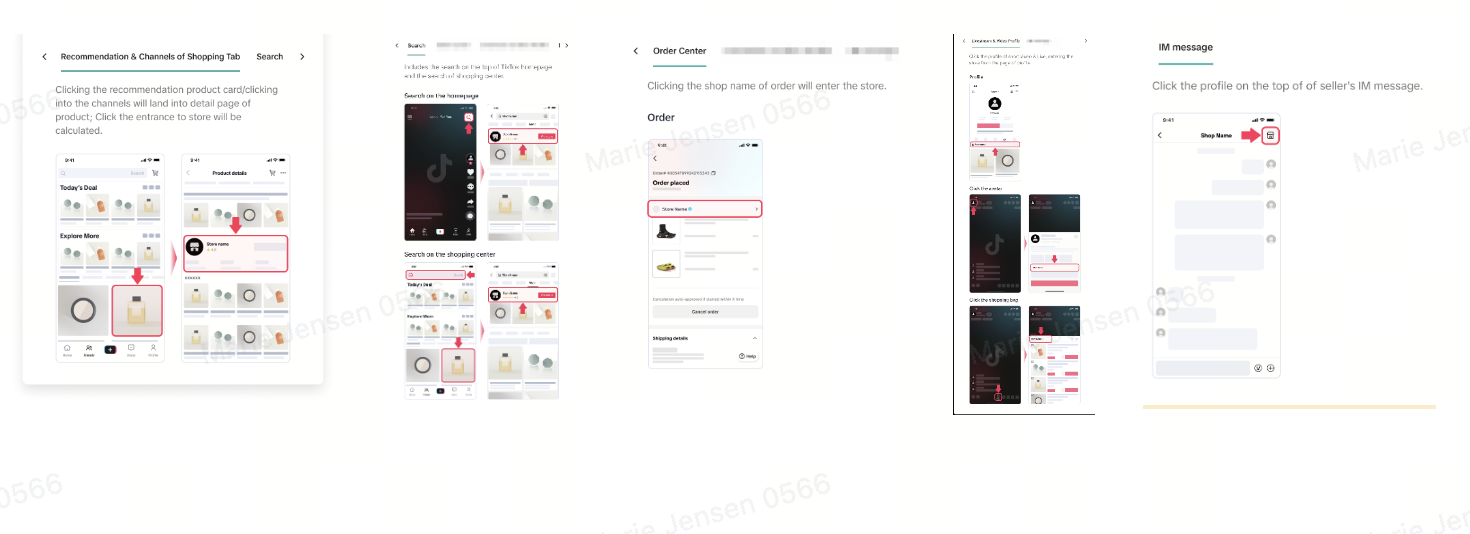
What are the channels that direct users to a shop page?
The traffic sources include Shop Tab(recommendations and channels), Search, Order center, Llvestream and video, Direct message and other channels.