Product Card Analytics and Diagnosis
05/07/2024
Summary
What are Product Cards on TikTok Shop and how do they function?
- Product Cards are content forms on TikTok displaying product images, titles, prices, and descriptions, driving traffic from various sources like Search, Recommendation, and Shop Tab.
How can sellers view and analyze the performance of their Product Cards?
- Sellers can access performance data via TikTok Shop Seller Center under Data Analytics, examining metrics like Unique Clicks, Buyers, Revenue, and traffic sources.
What is Product Card Diagnosis and how can it help improve performance?
- Product Card Diagnosis identifies high potential upside cards and offers suggestions for optimization, allowing sellers to analyze growth opportunities and conversion rates.
How can sellers optimize their Product Cards for better traffic and conversion?
- Sellers can enhance Product Cards by improving images, titles, descriptions, pricing, and adding vouchers, or collaborating with creators and using promotional tools.
Access Product Card Analytics here: https://seller-us.tiktok.com/compass/product-card-analytics
This article explains what Product Cards are, how to measure their performance, and how to use Product Card Diagnosis for suggestions on improving their performance and resolving pain points. You’ll learn how to use this feature and accurately optimize your product cards afterward.What are Product Cards?
"Product Card"is a form of content on TikTok that presents a product directly to users through a card that includes product images, titles, and prices.Product Cards display everything you need to know about a product, such as Title, Price, Image, and Description after you successfully list it on TikTok Shop.
 Whether a user lands on a product directly through Search, Recommendation, Shop Tab(exclude Live/Videos shown in Shop Tab), Showcase, or Shop page, you gain traffic from the Product Cards.
 Examples of what Product Card is and what formats it can be:
| Channels | Search | Recommendation | Store | Showcase | Promotion |
| Demos | 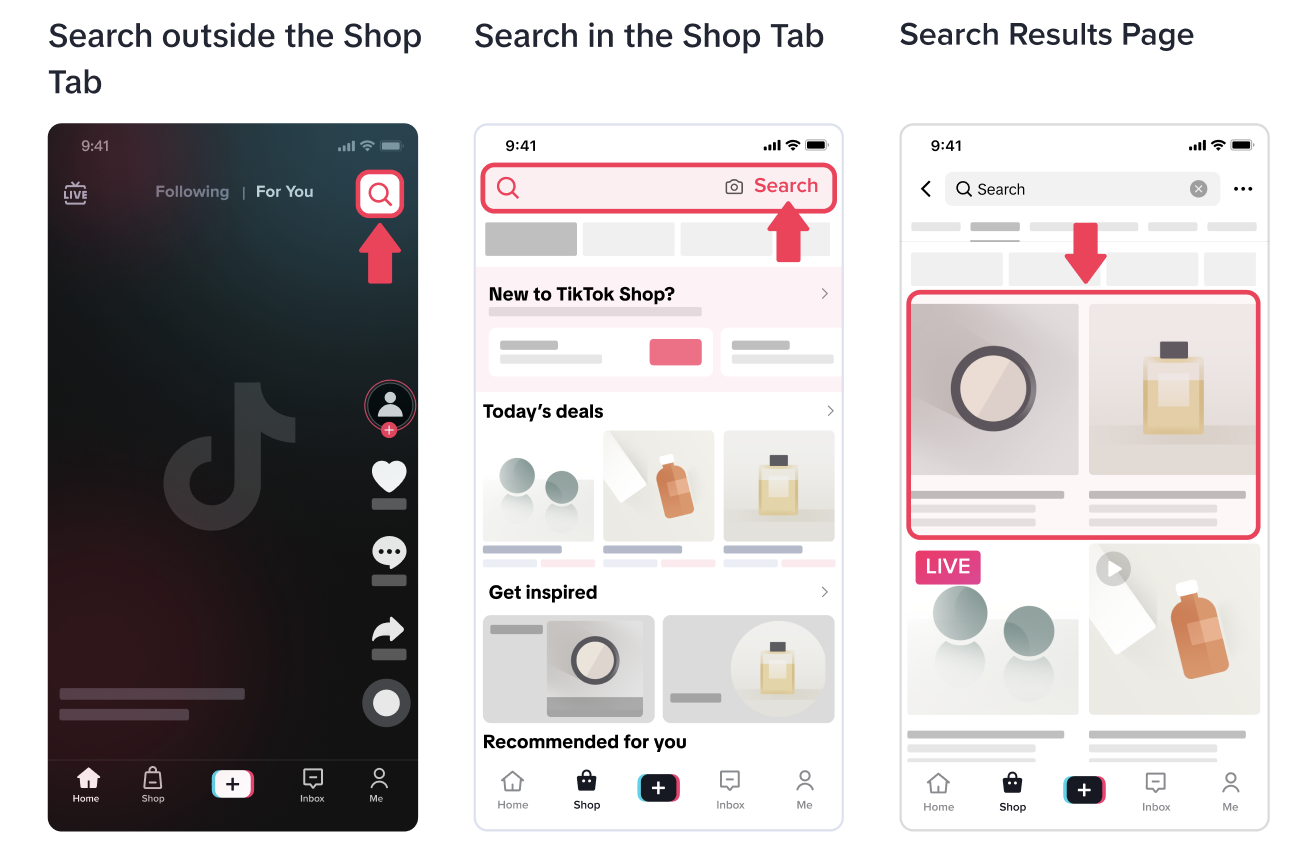 | 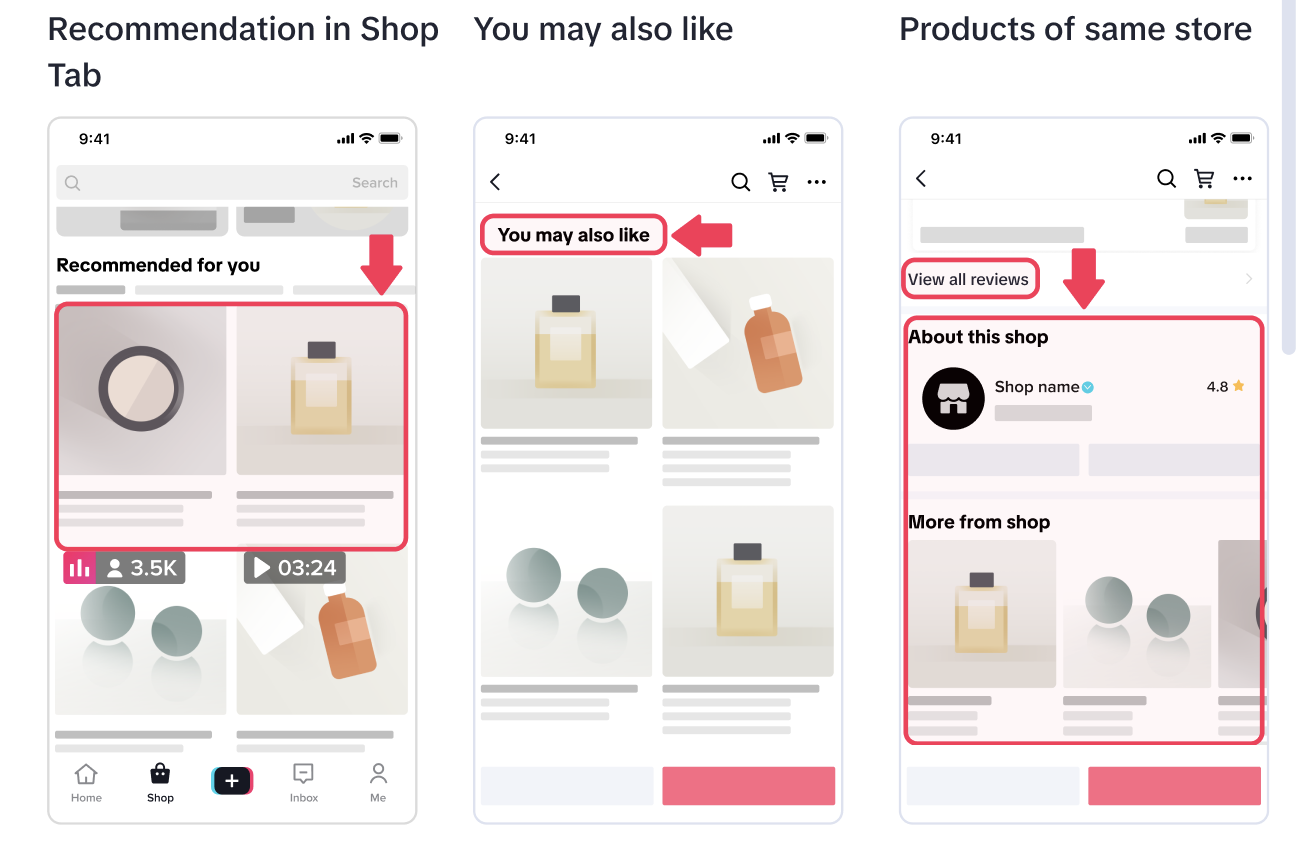 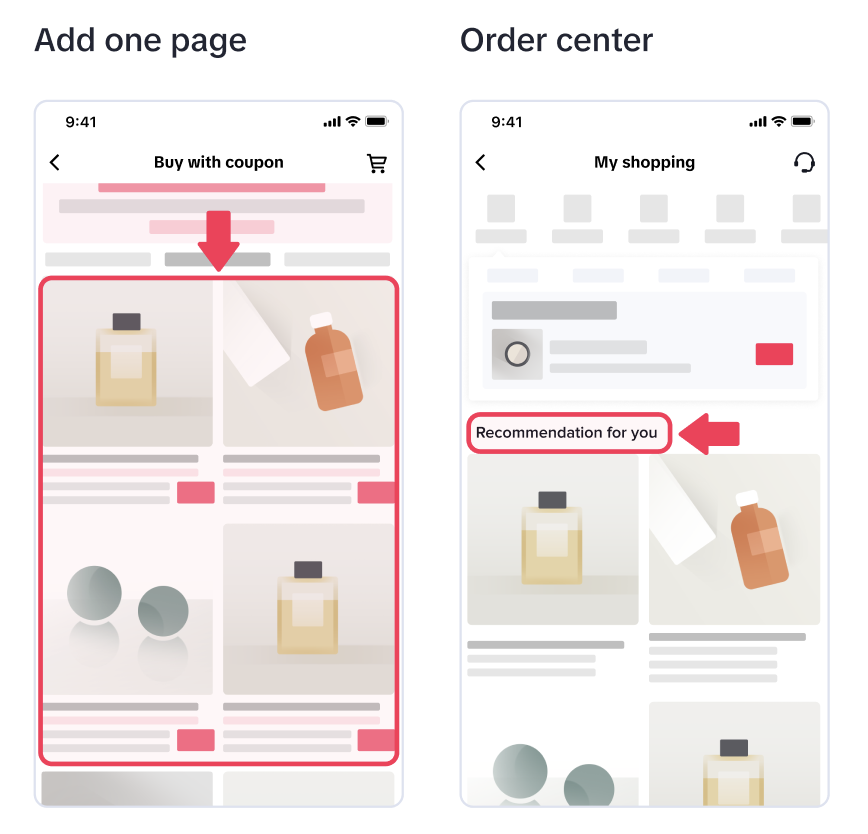 | 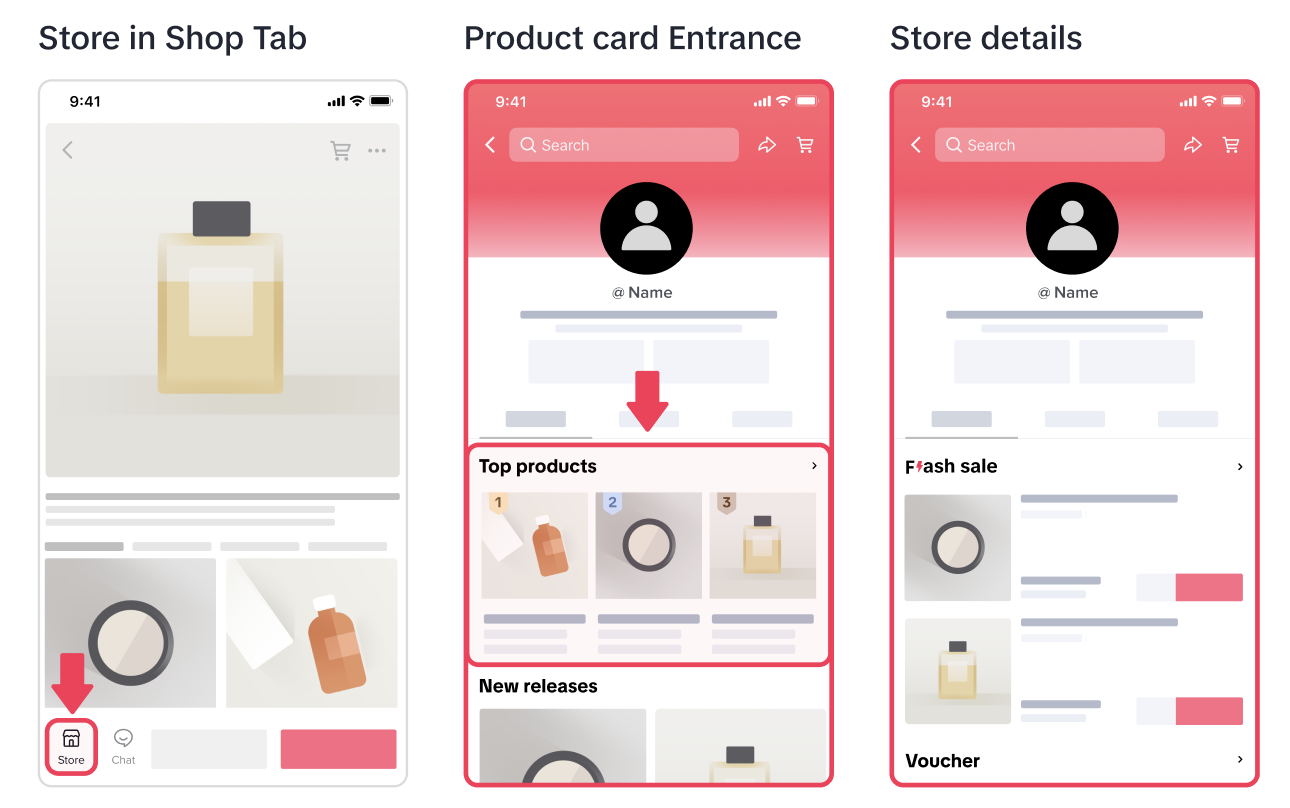 | 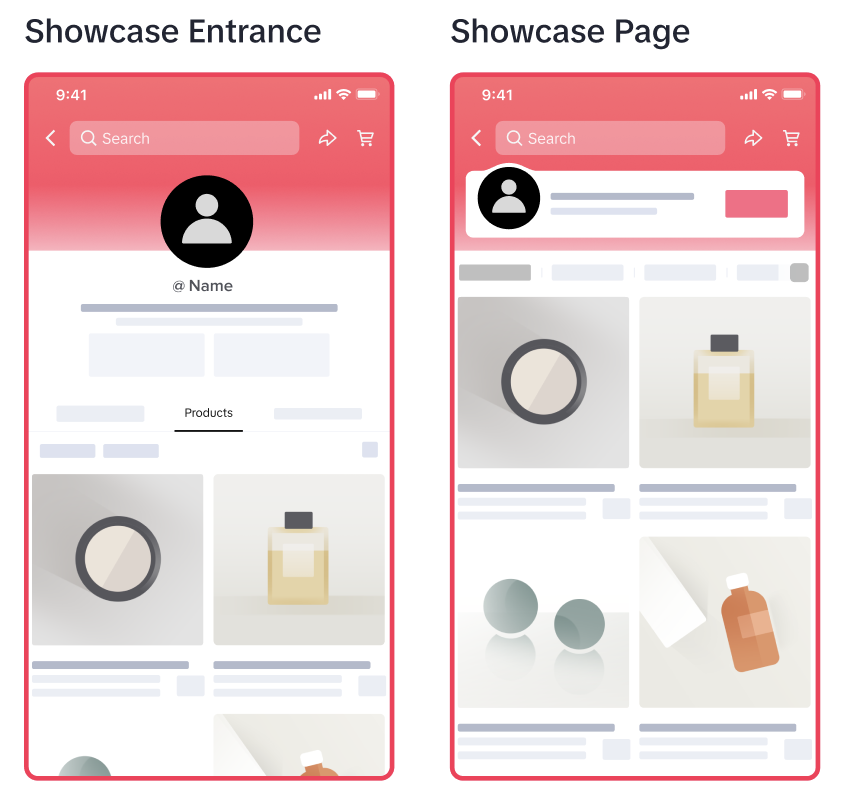 | 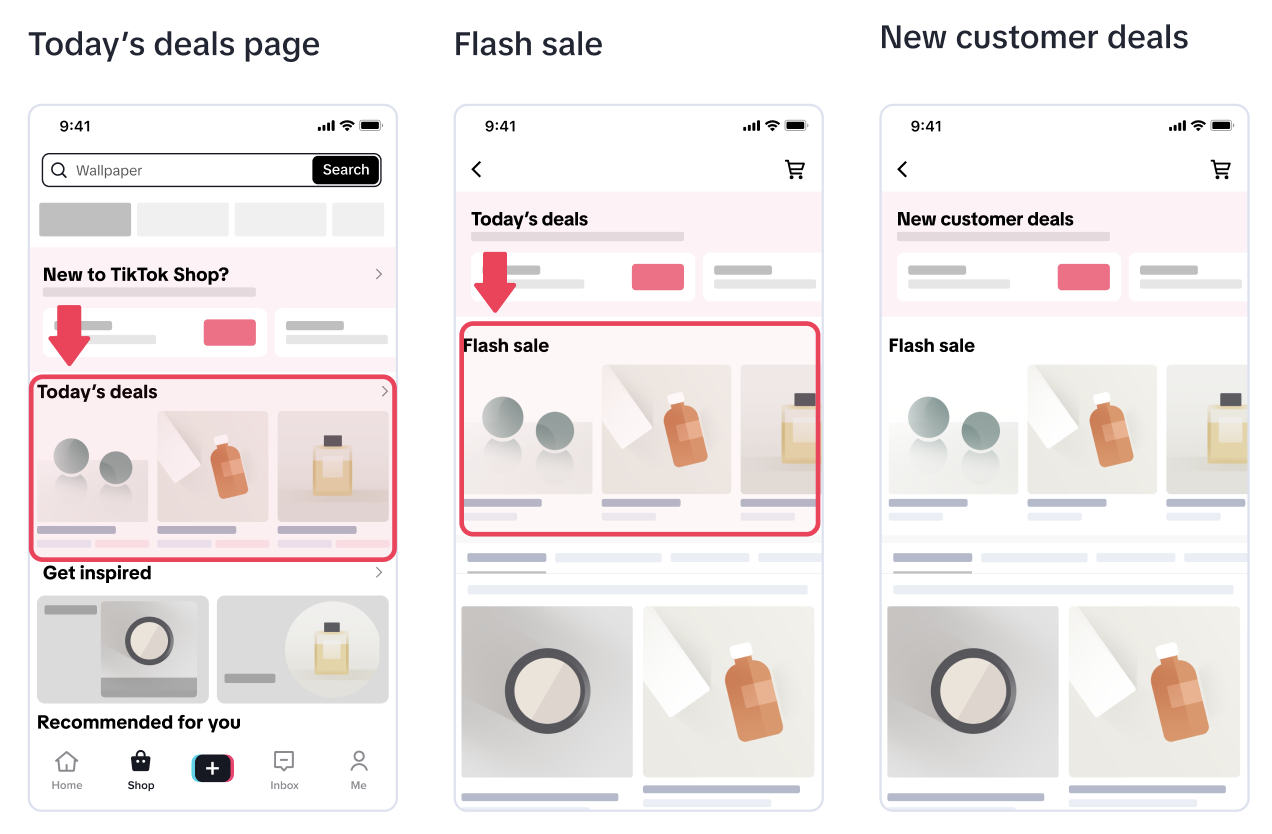 |

How to View Traffic from Product Cards
- On TikTok Shop Seller Center, click on Data Analytics->Marketplace ->Product Card->Performance. Here there are two main dashboards: Core Data and Traffic Source.
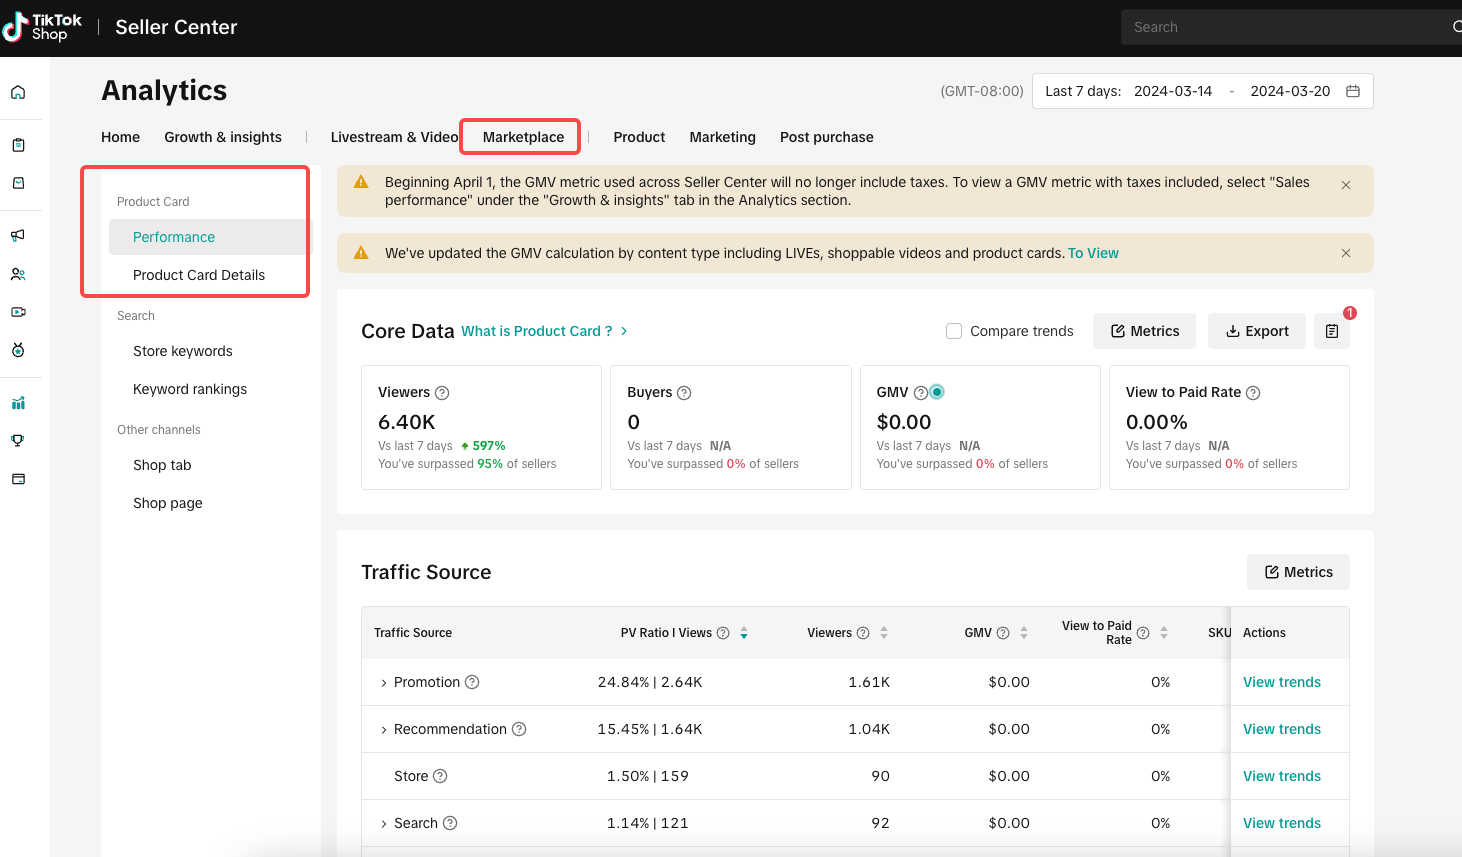
- Core Data shows Viewers, Buyers, GMV, and View to Paid Rate.
- These metrics show the performance of your product cards in the selected time period. There are 4 metrics by default: Unique Clicks, Buyers, Revenue, and Click to paid rate.
- Hover over the ? icon to view the metrics' definitions.
- You can download the performance and view trend charts.
- You can also compare the trends.
- Click on the Metrics button to check more available metrics.

- Under Traffic Source, you will see how much traffic and revenue come from different sources. This way you can identify the best performing channel.
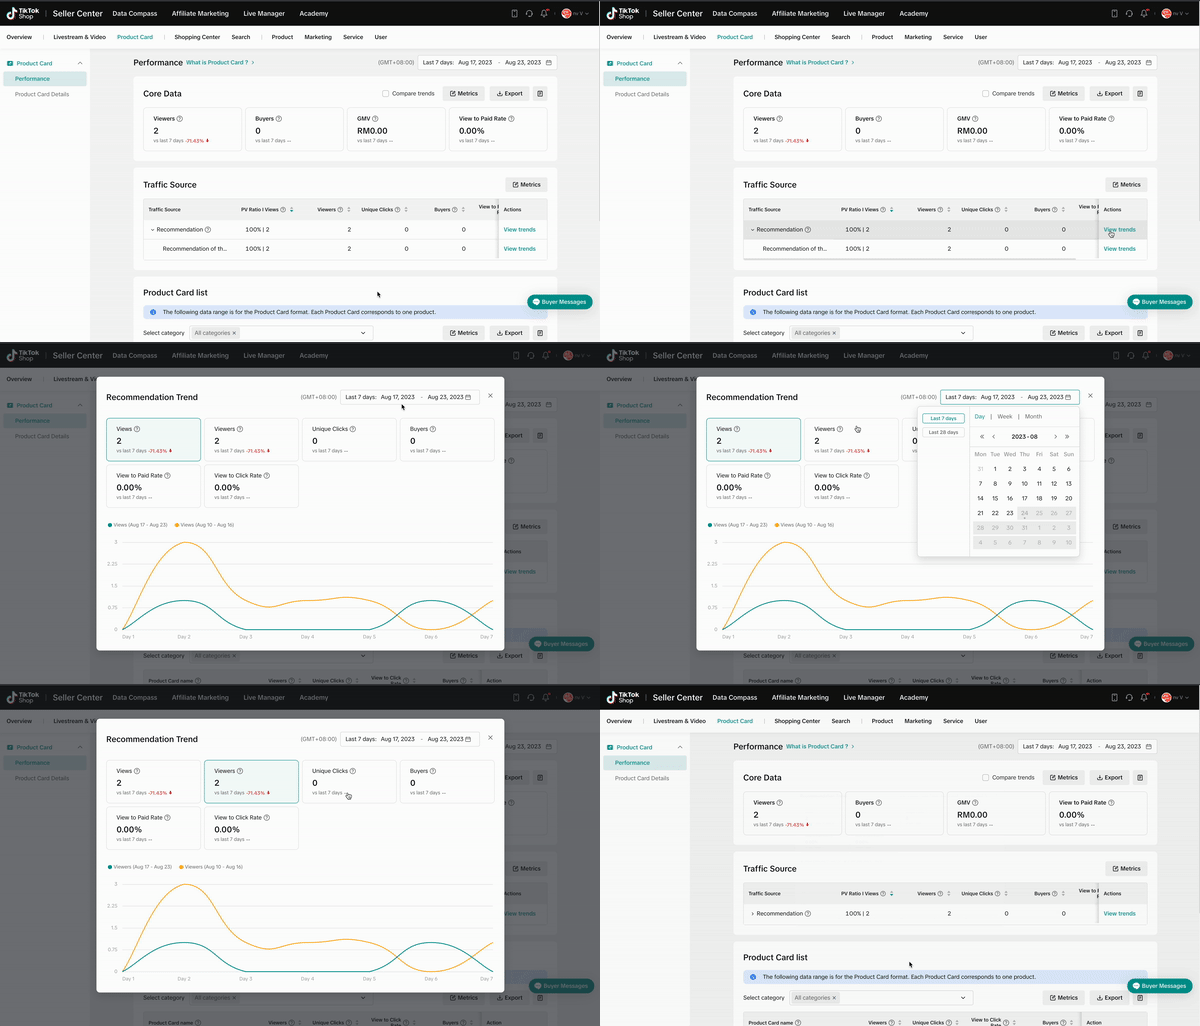
- Click on View trends to examine a Traffic Source. You will find its Views, Viewers, Unique Clicks, Buyers, View to Paid Rate, and View to Click Rate.

Where to find Product Card Diagnosis
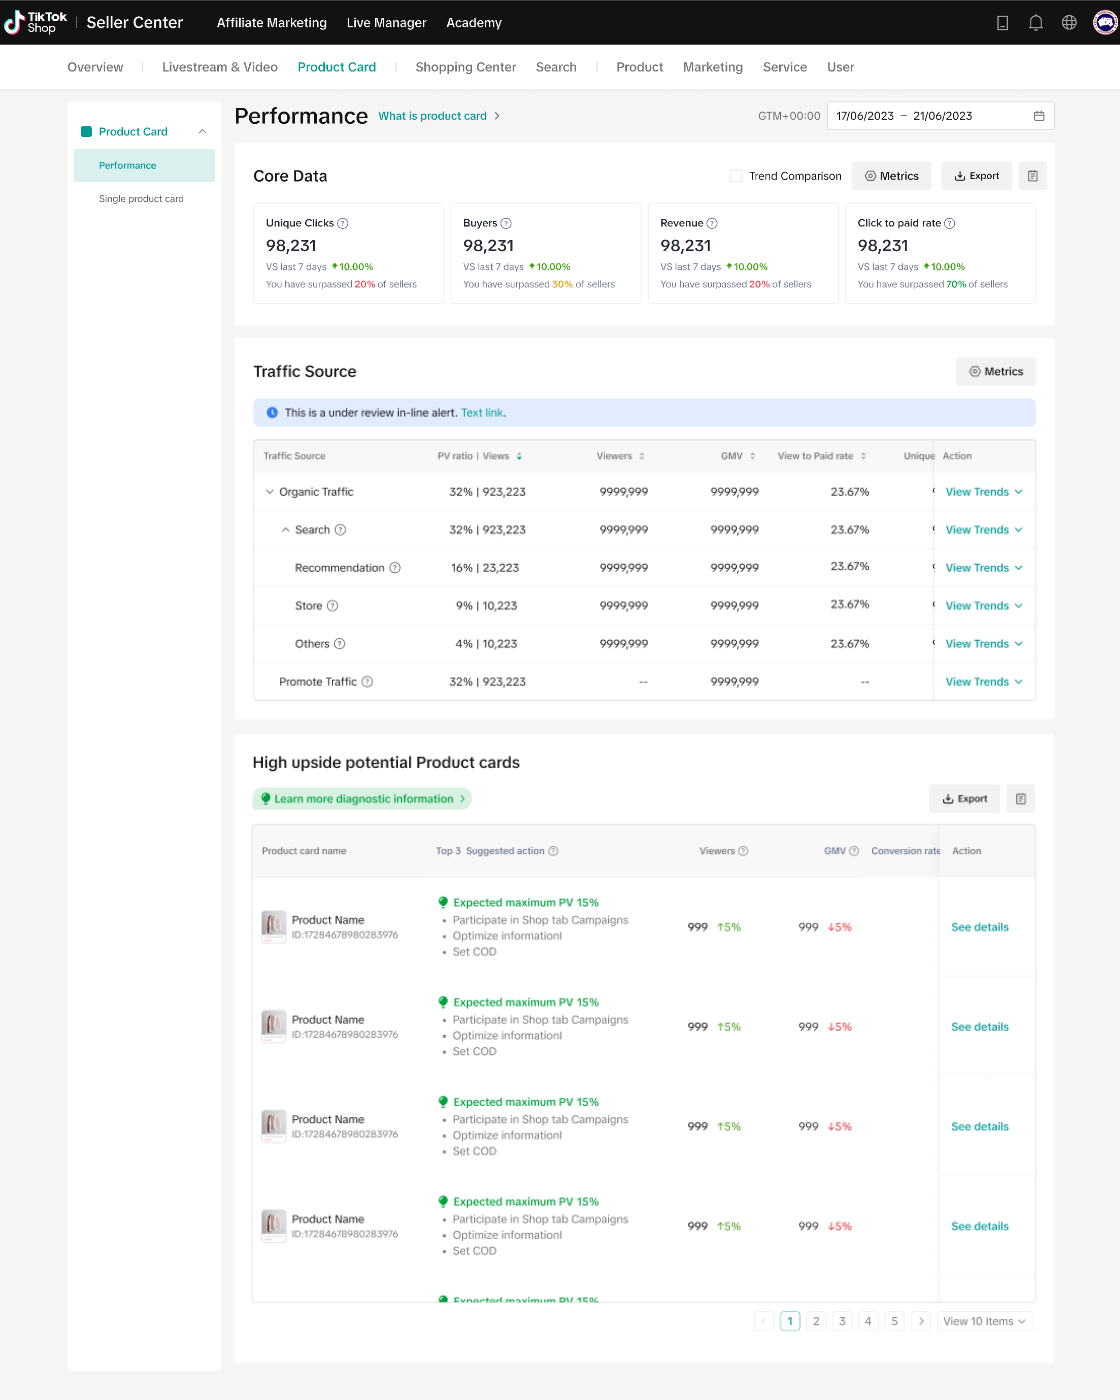
What Are High Potential Upside Product Cards?
- This is a dedicated section to search for product cards that have potential or contain opportunities for higher conversion or exposure through different suggestions.
- Here you will see a list of your product cards, suggested actions, last 7 days viewers, and more.
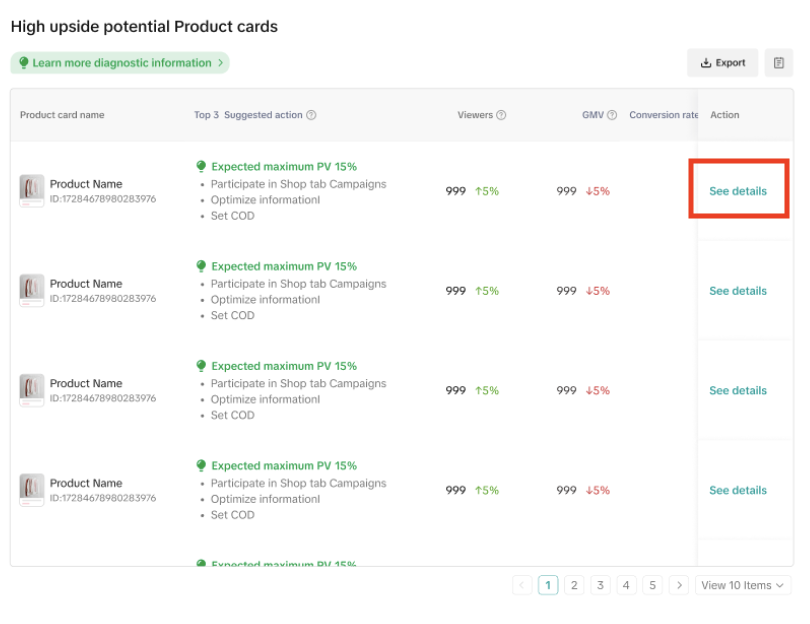 Click on Export for your own reference or you can click on See details to further analyze a product card. Then you will move to the Single product card section where the growth opportunities and performance of the selected product card are shown.
There is also another way to understand the details of specific Product Cards:
- On the Product Card Details page, you are able to view data of all product cards. You can also look for a specific Product Card by entering the product ID or name to search for it.
- There is a Diagnostic mode button so you can switch between Data mode (only data provided) and Diagnostic mode (diagnosis results provided) according to your preference.
- Here you can see the revenue and traffic funnel, which can help you understand the conversion from View to Click, Click to Cart, and Cart to Paid Rate.
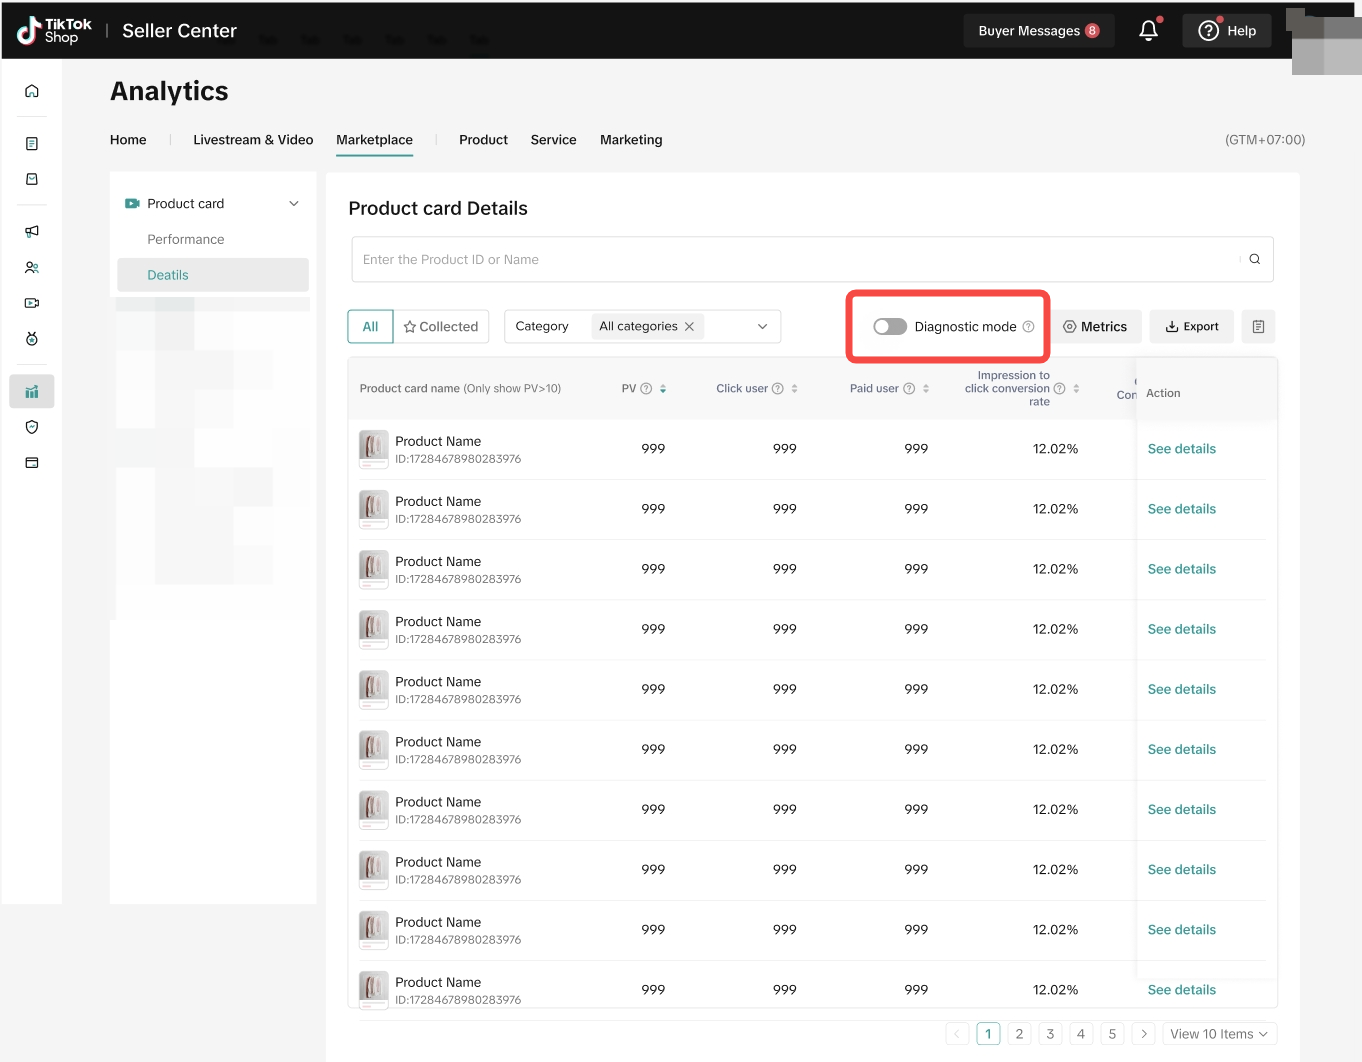
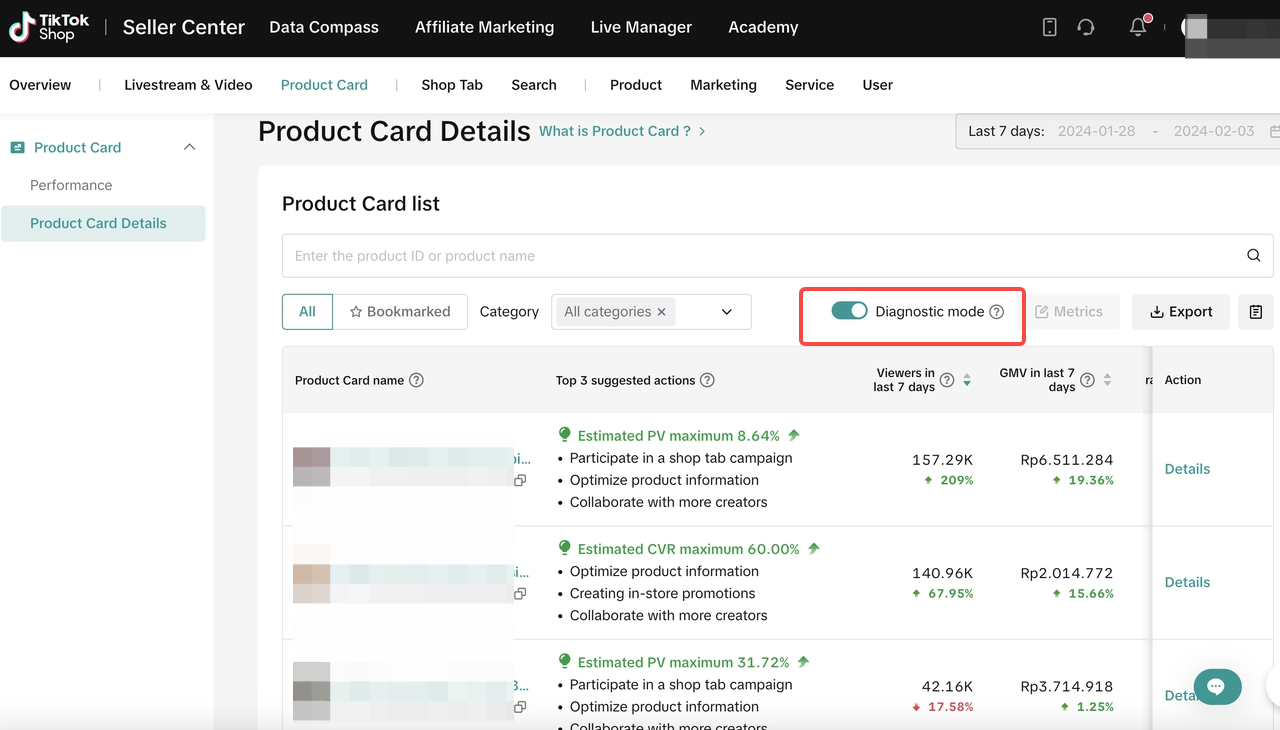 Click to check the detailed performance of a specific product card on the right side.
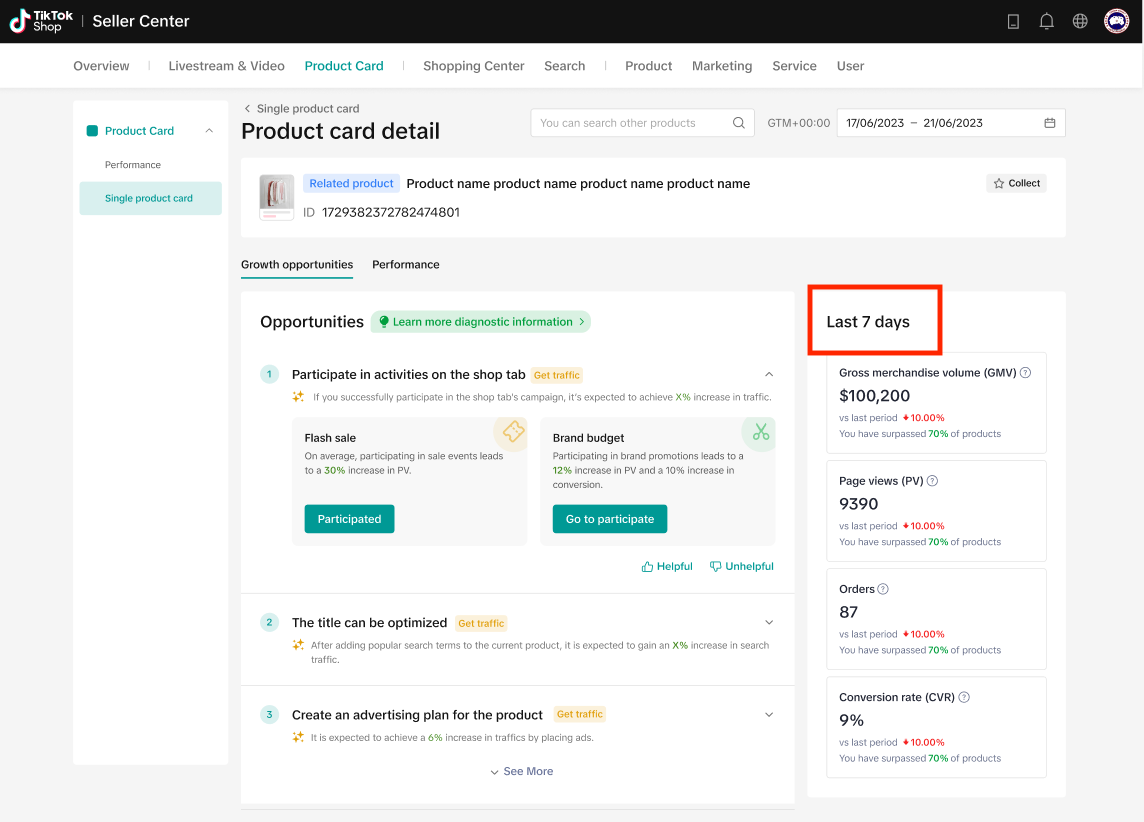
The Growth opportunities tab provides diagnoses that you can apply to improve the product card performance. There are a total of 14 suggestions as listed in the table below.
| Suggestions | Screenshots |
| The title can be optimized | 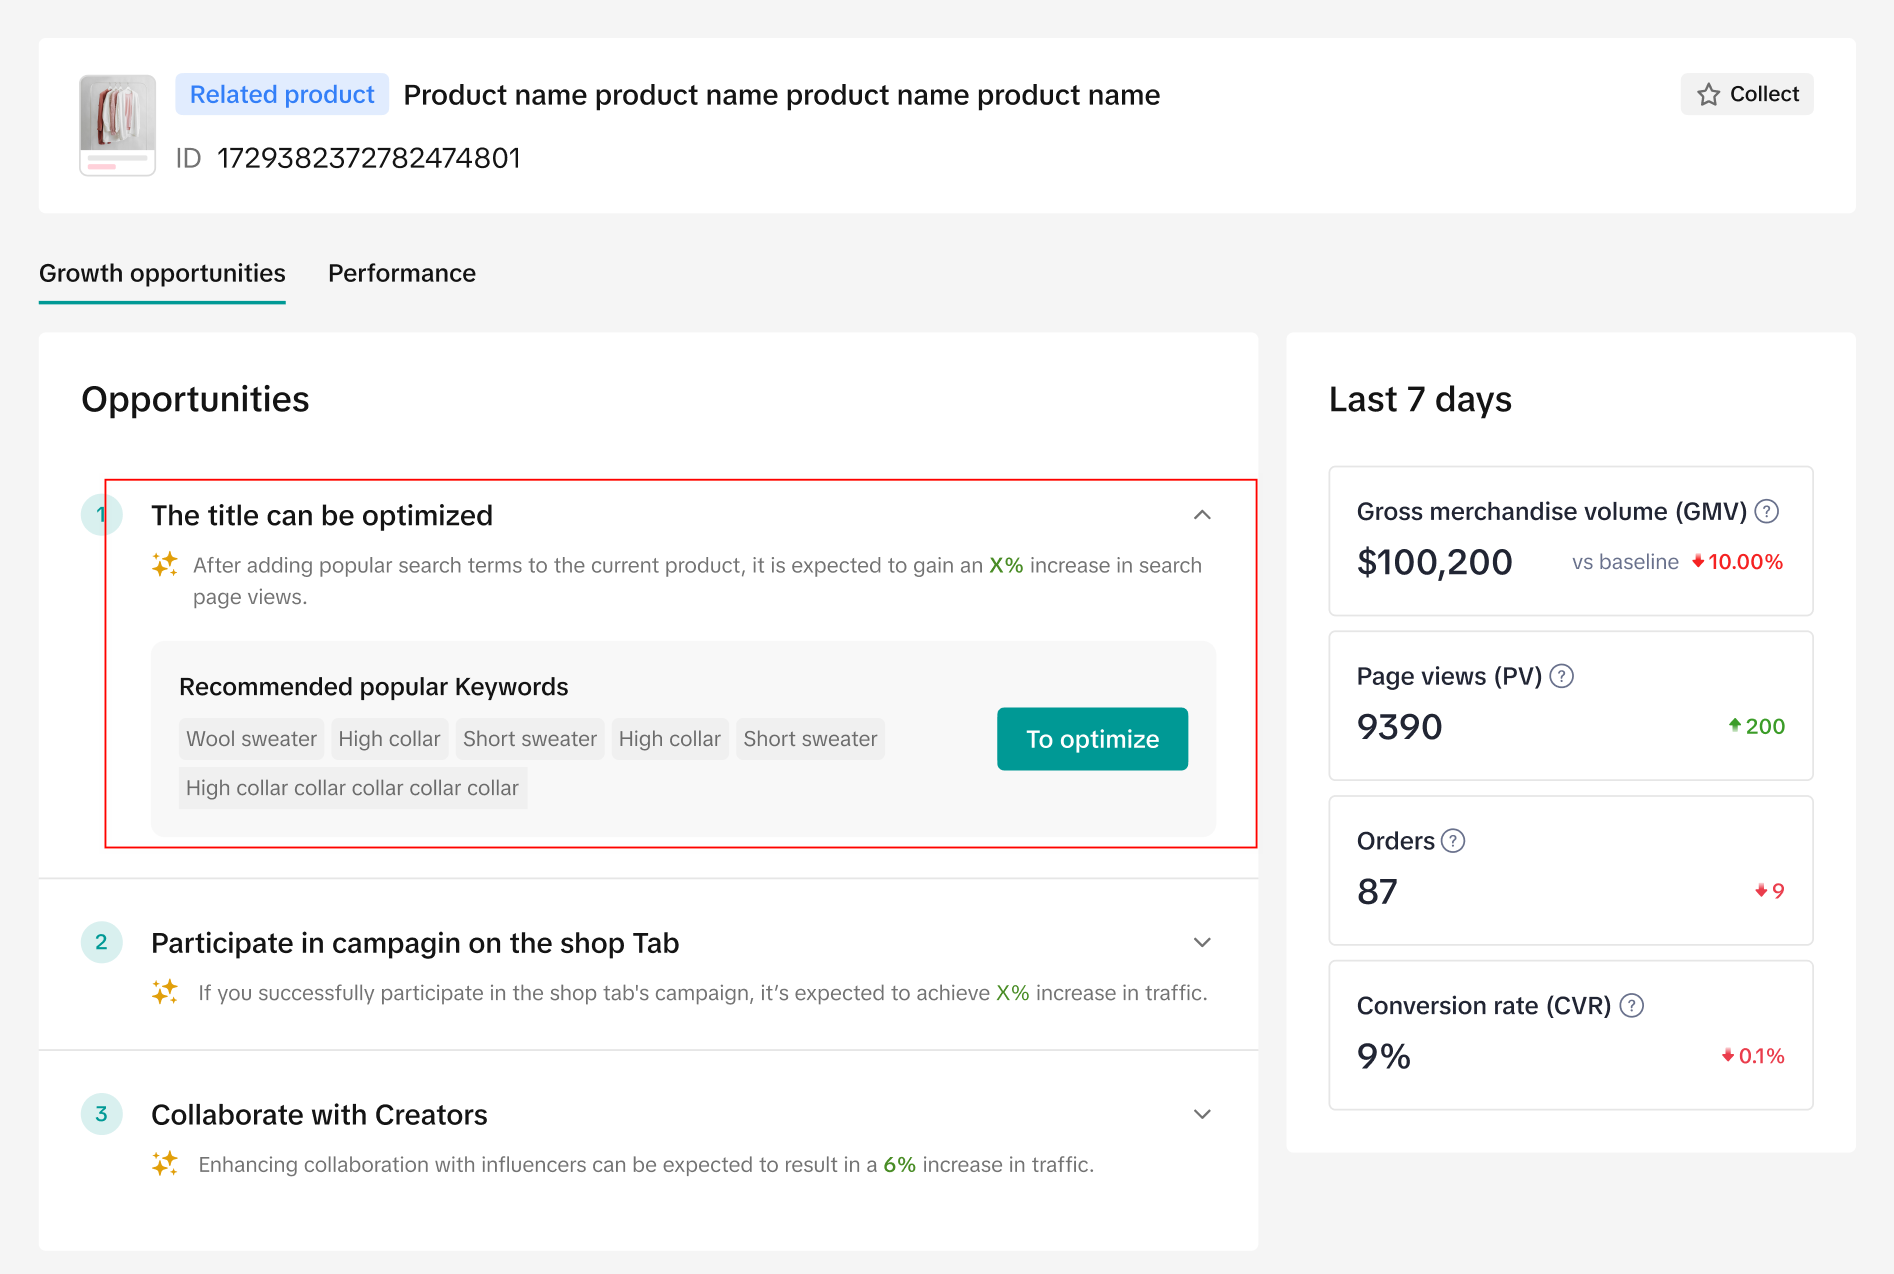 |
| Collaborate with more Creators | 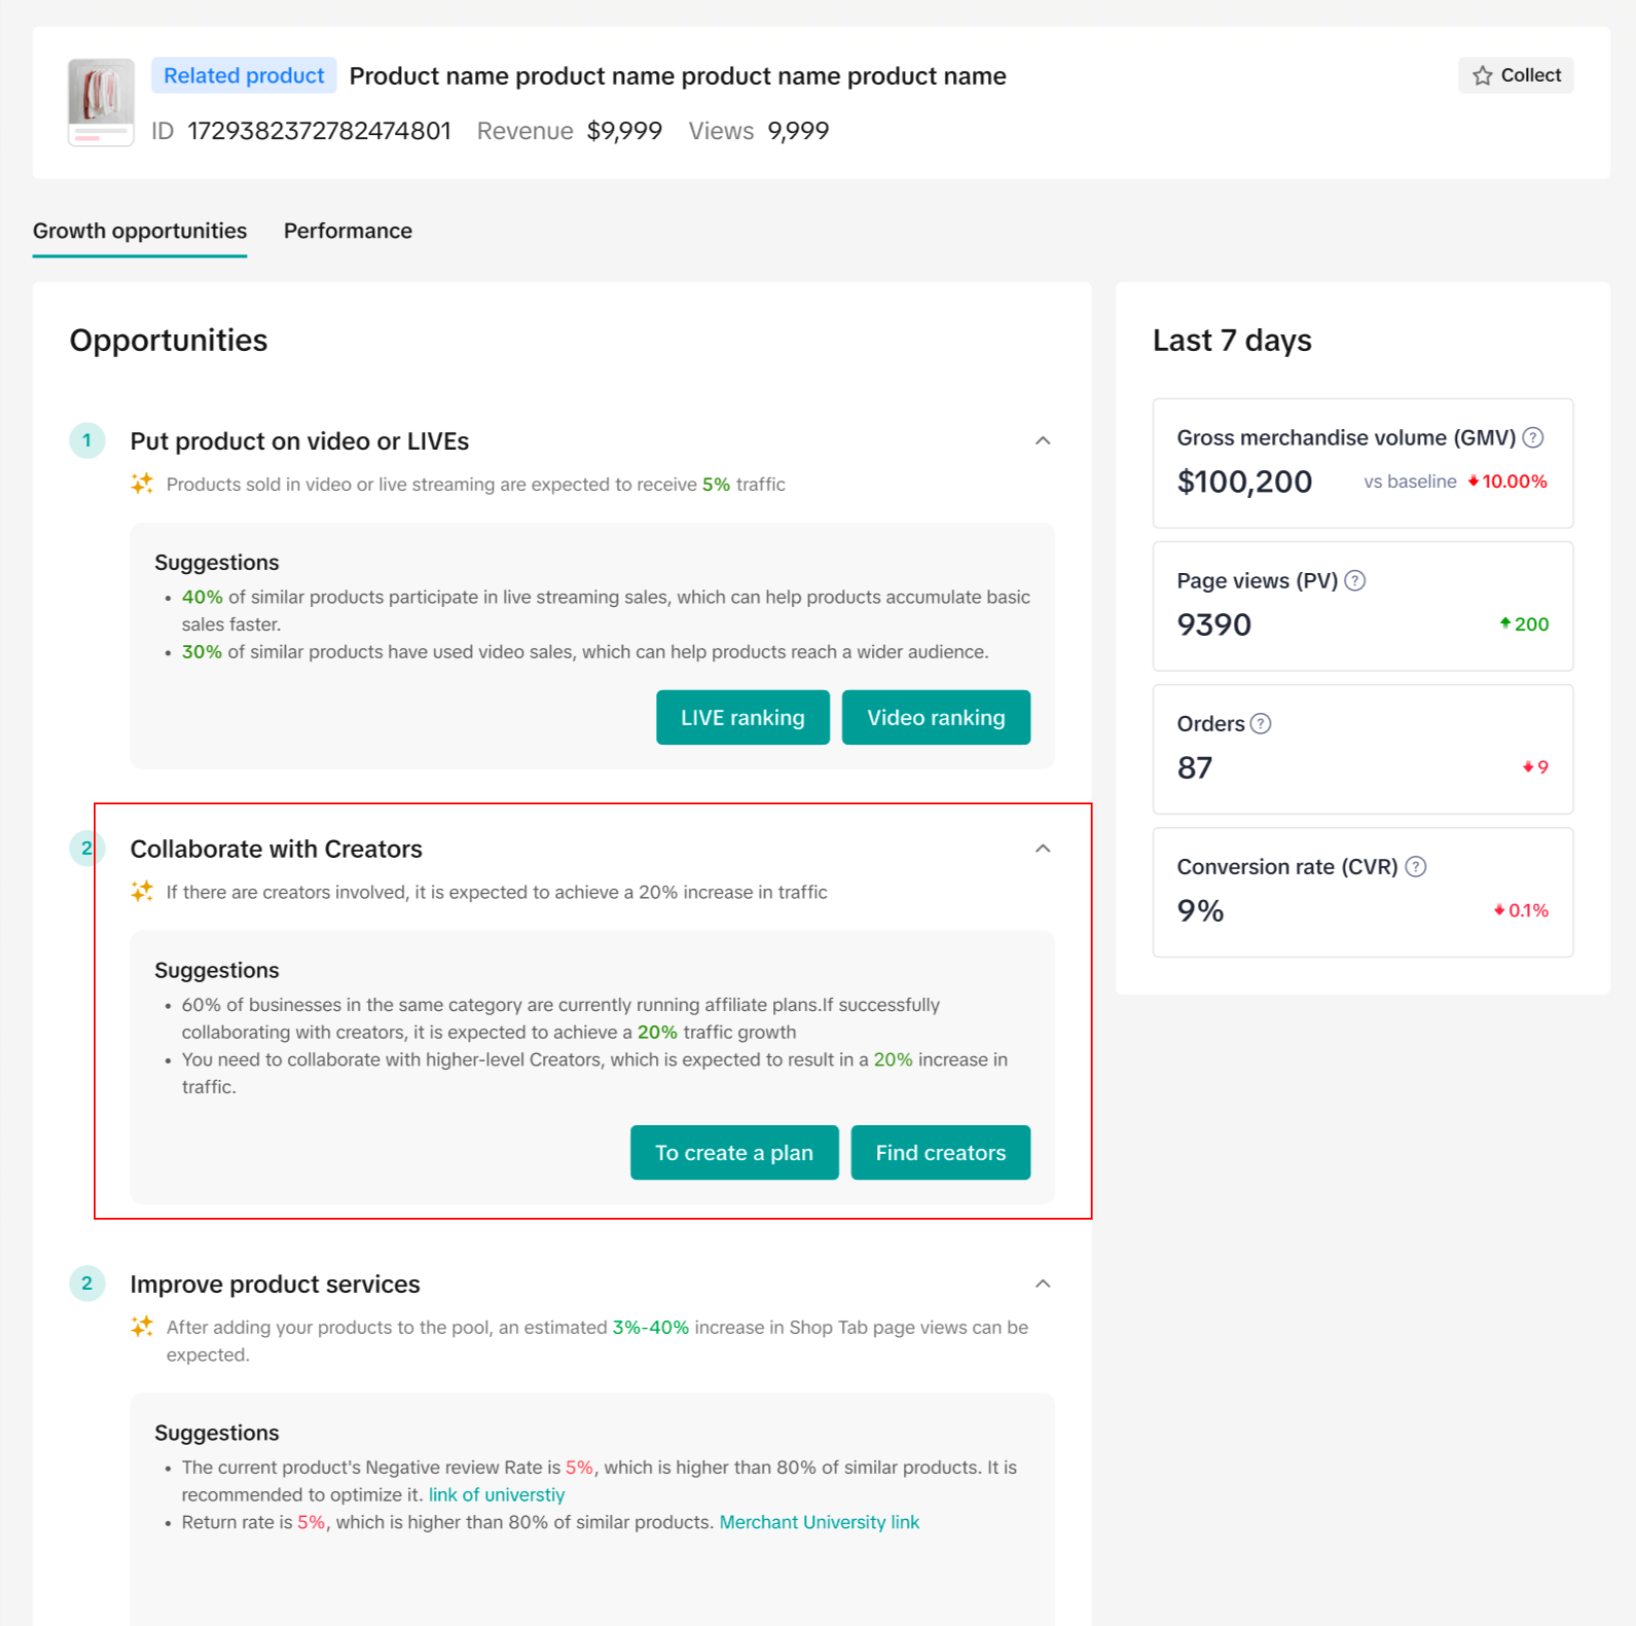 |
| Showcase products on Video or LIVE | 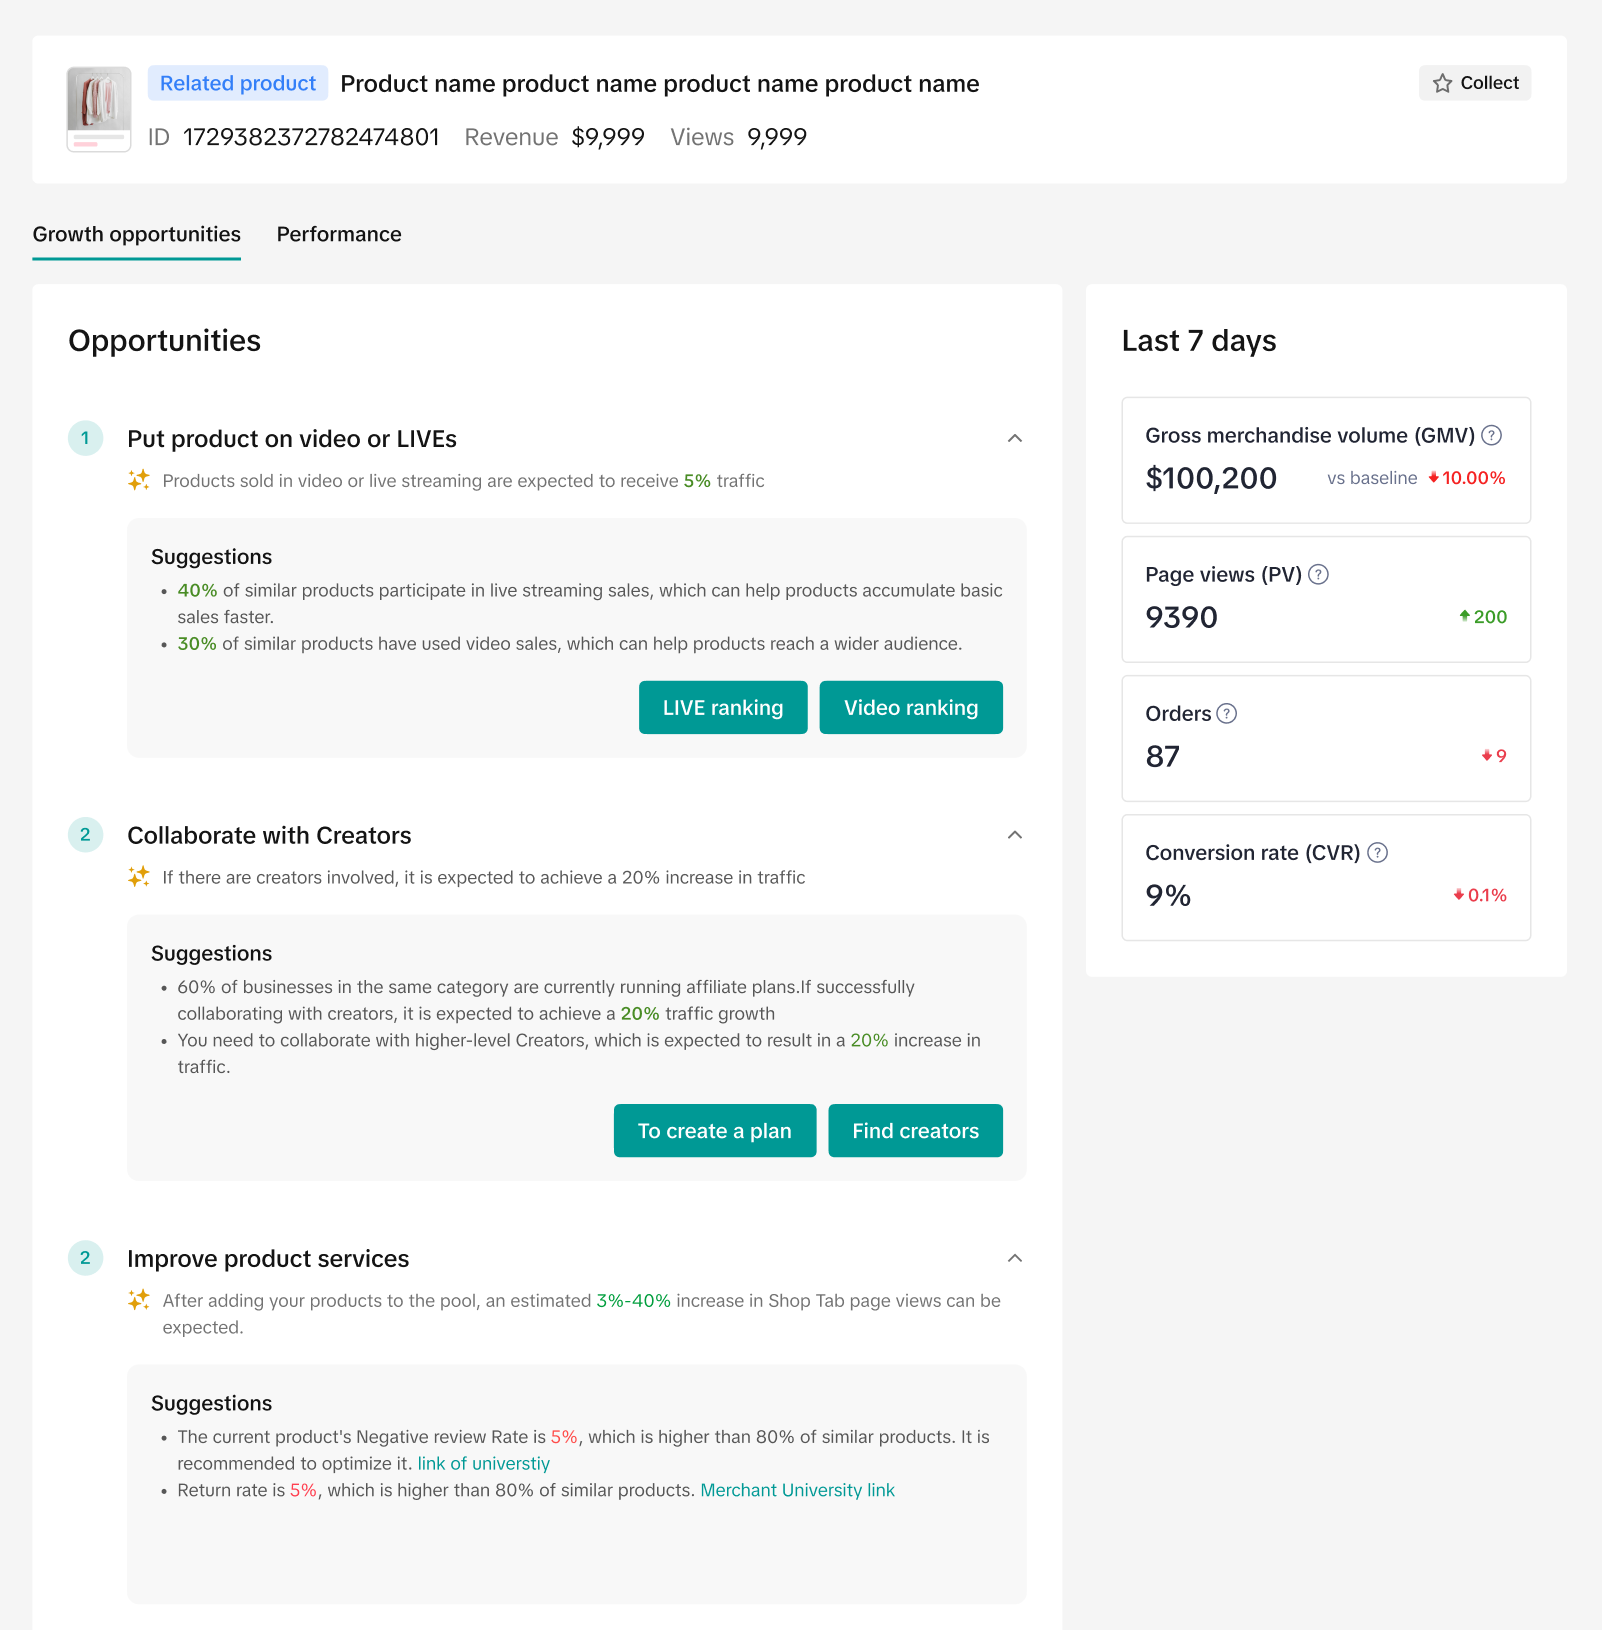
|
| Optimize product information | 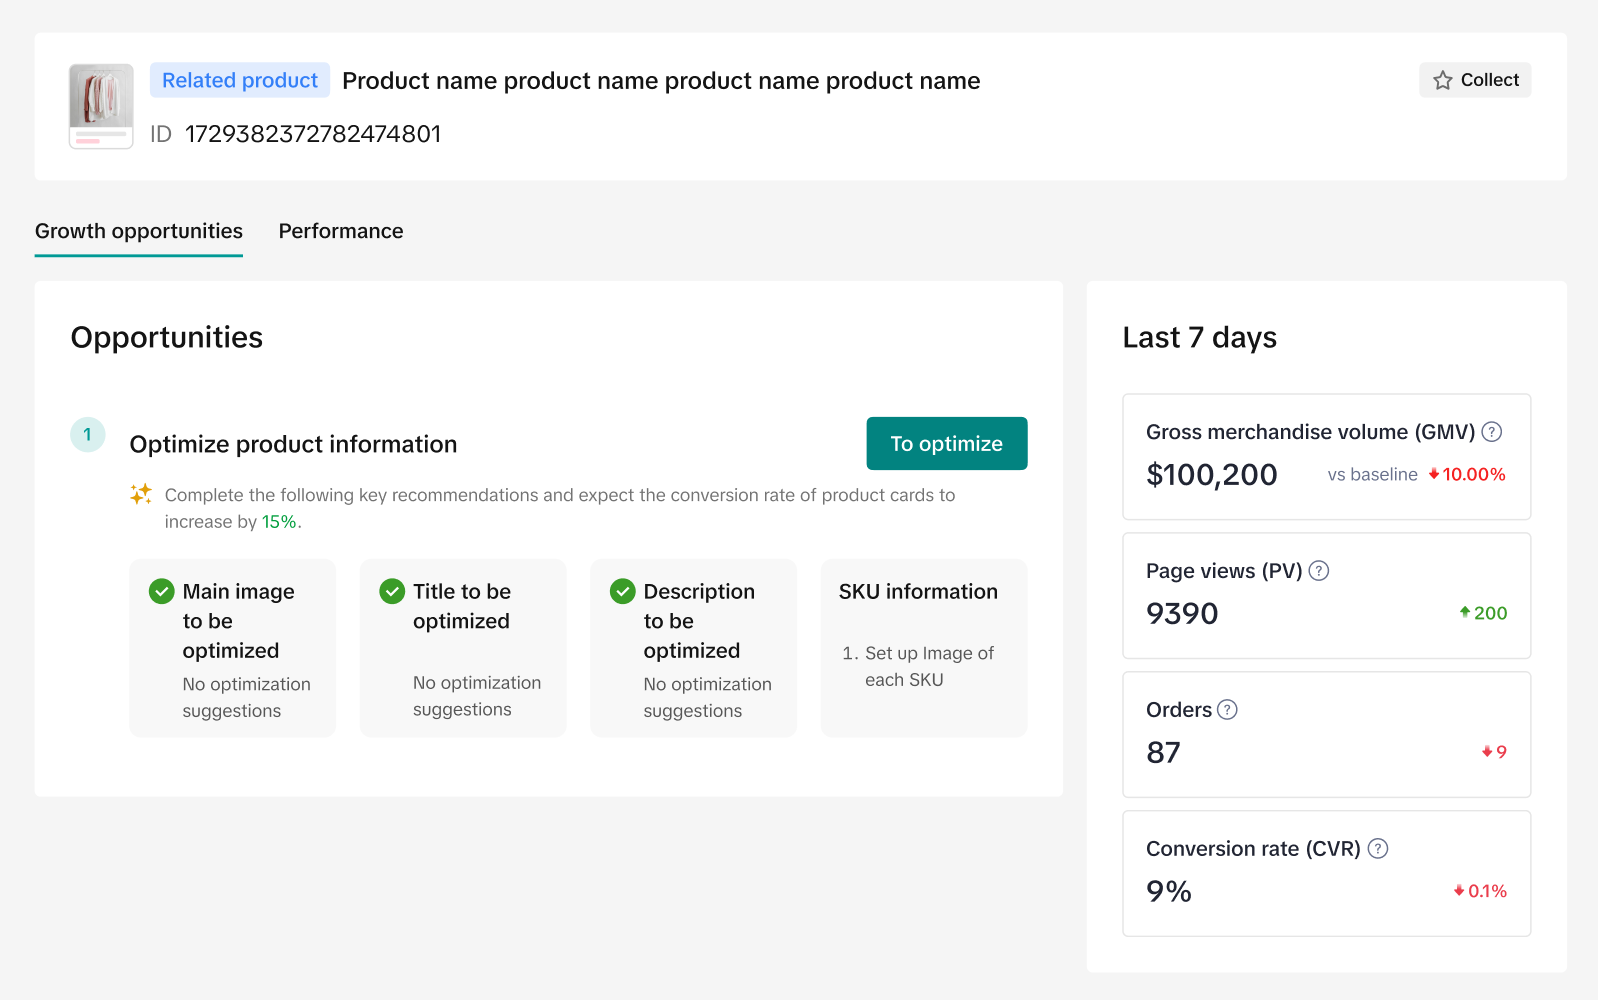
|
| Set up more promotion tools | 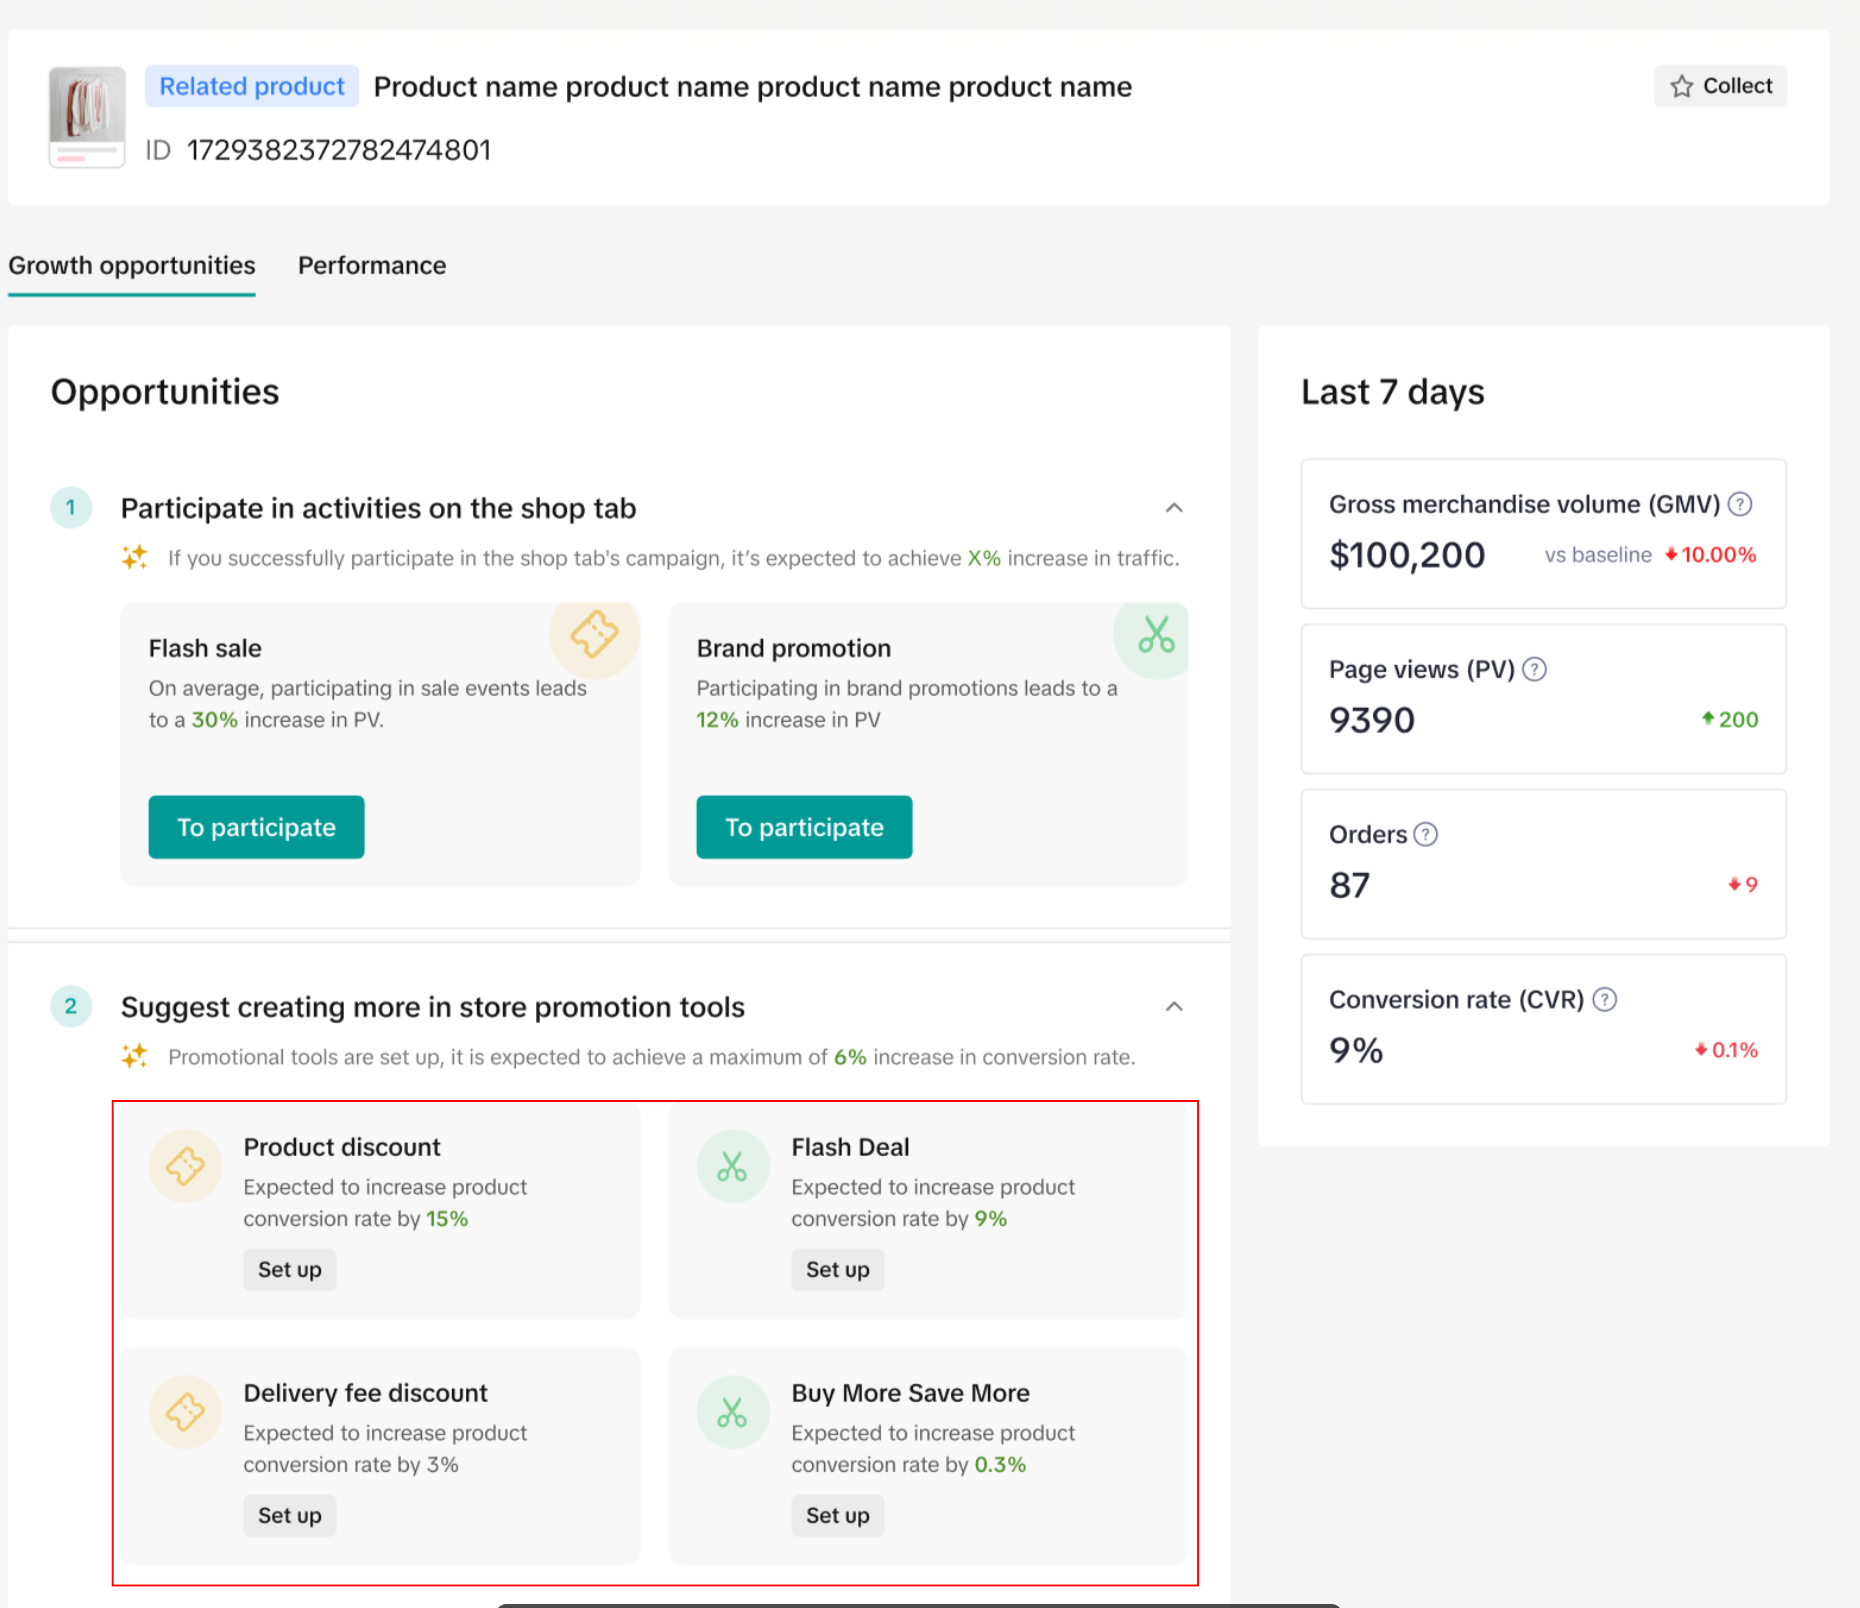 |
| Set up Cash on Delivery (COD) | 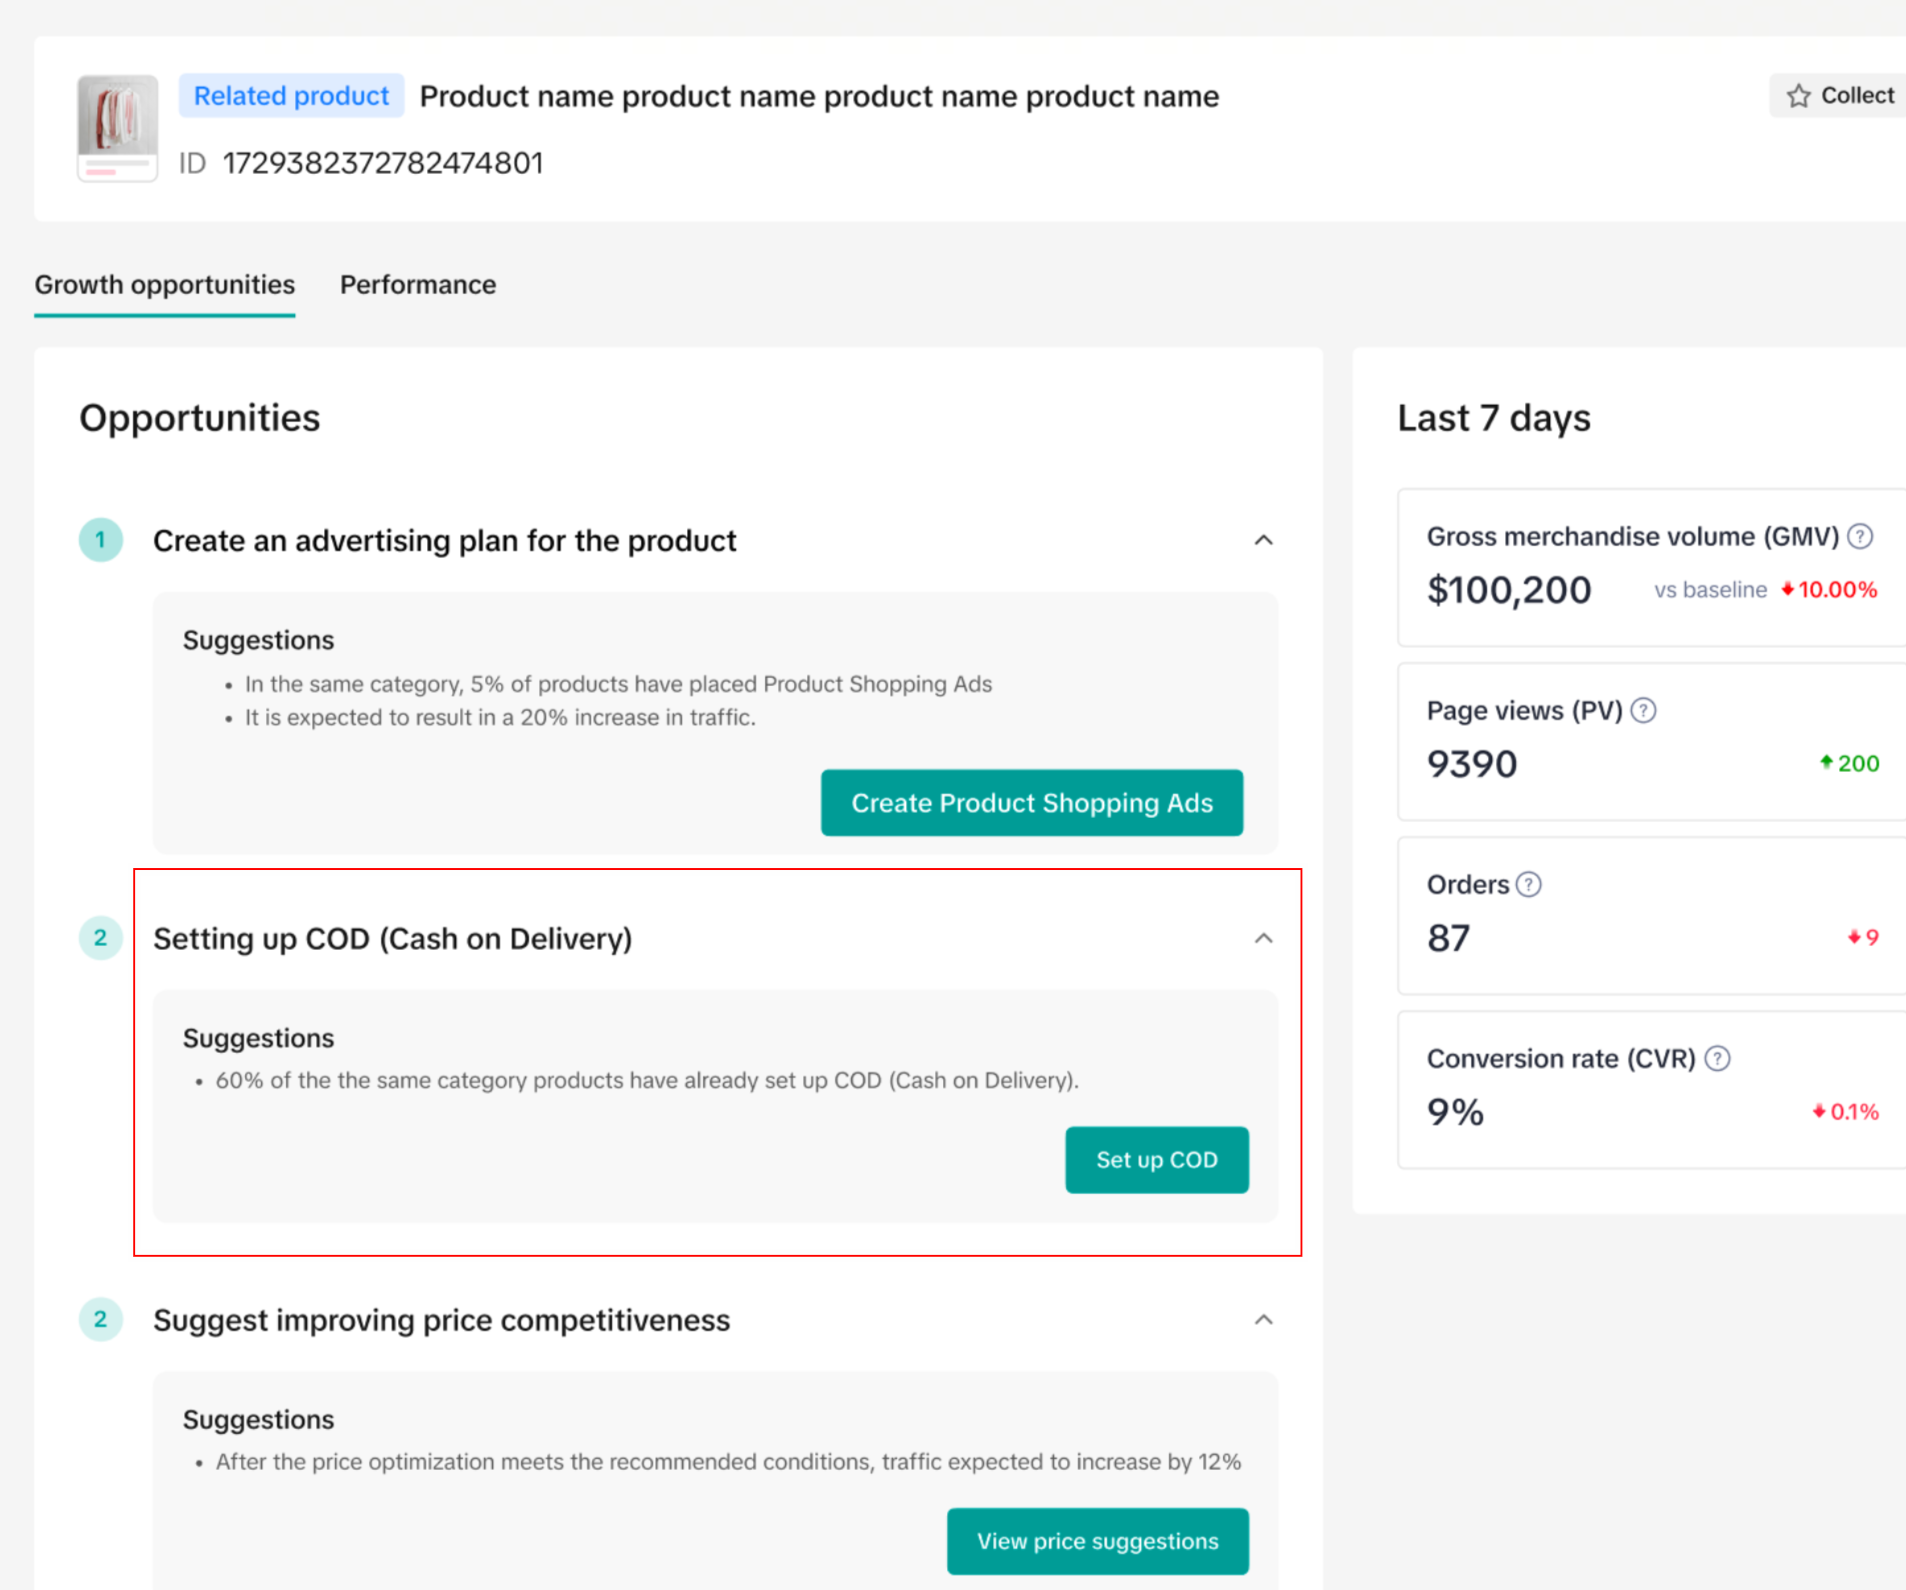 |
| Improve product services | 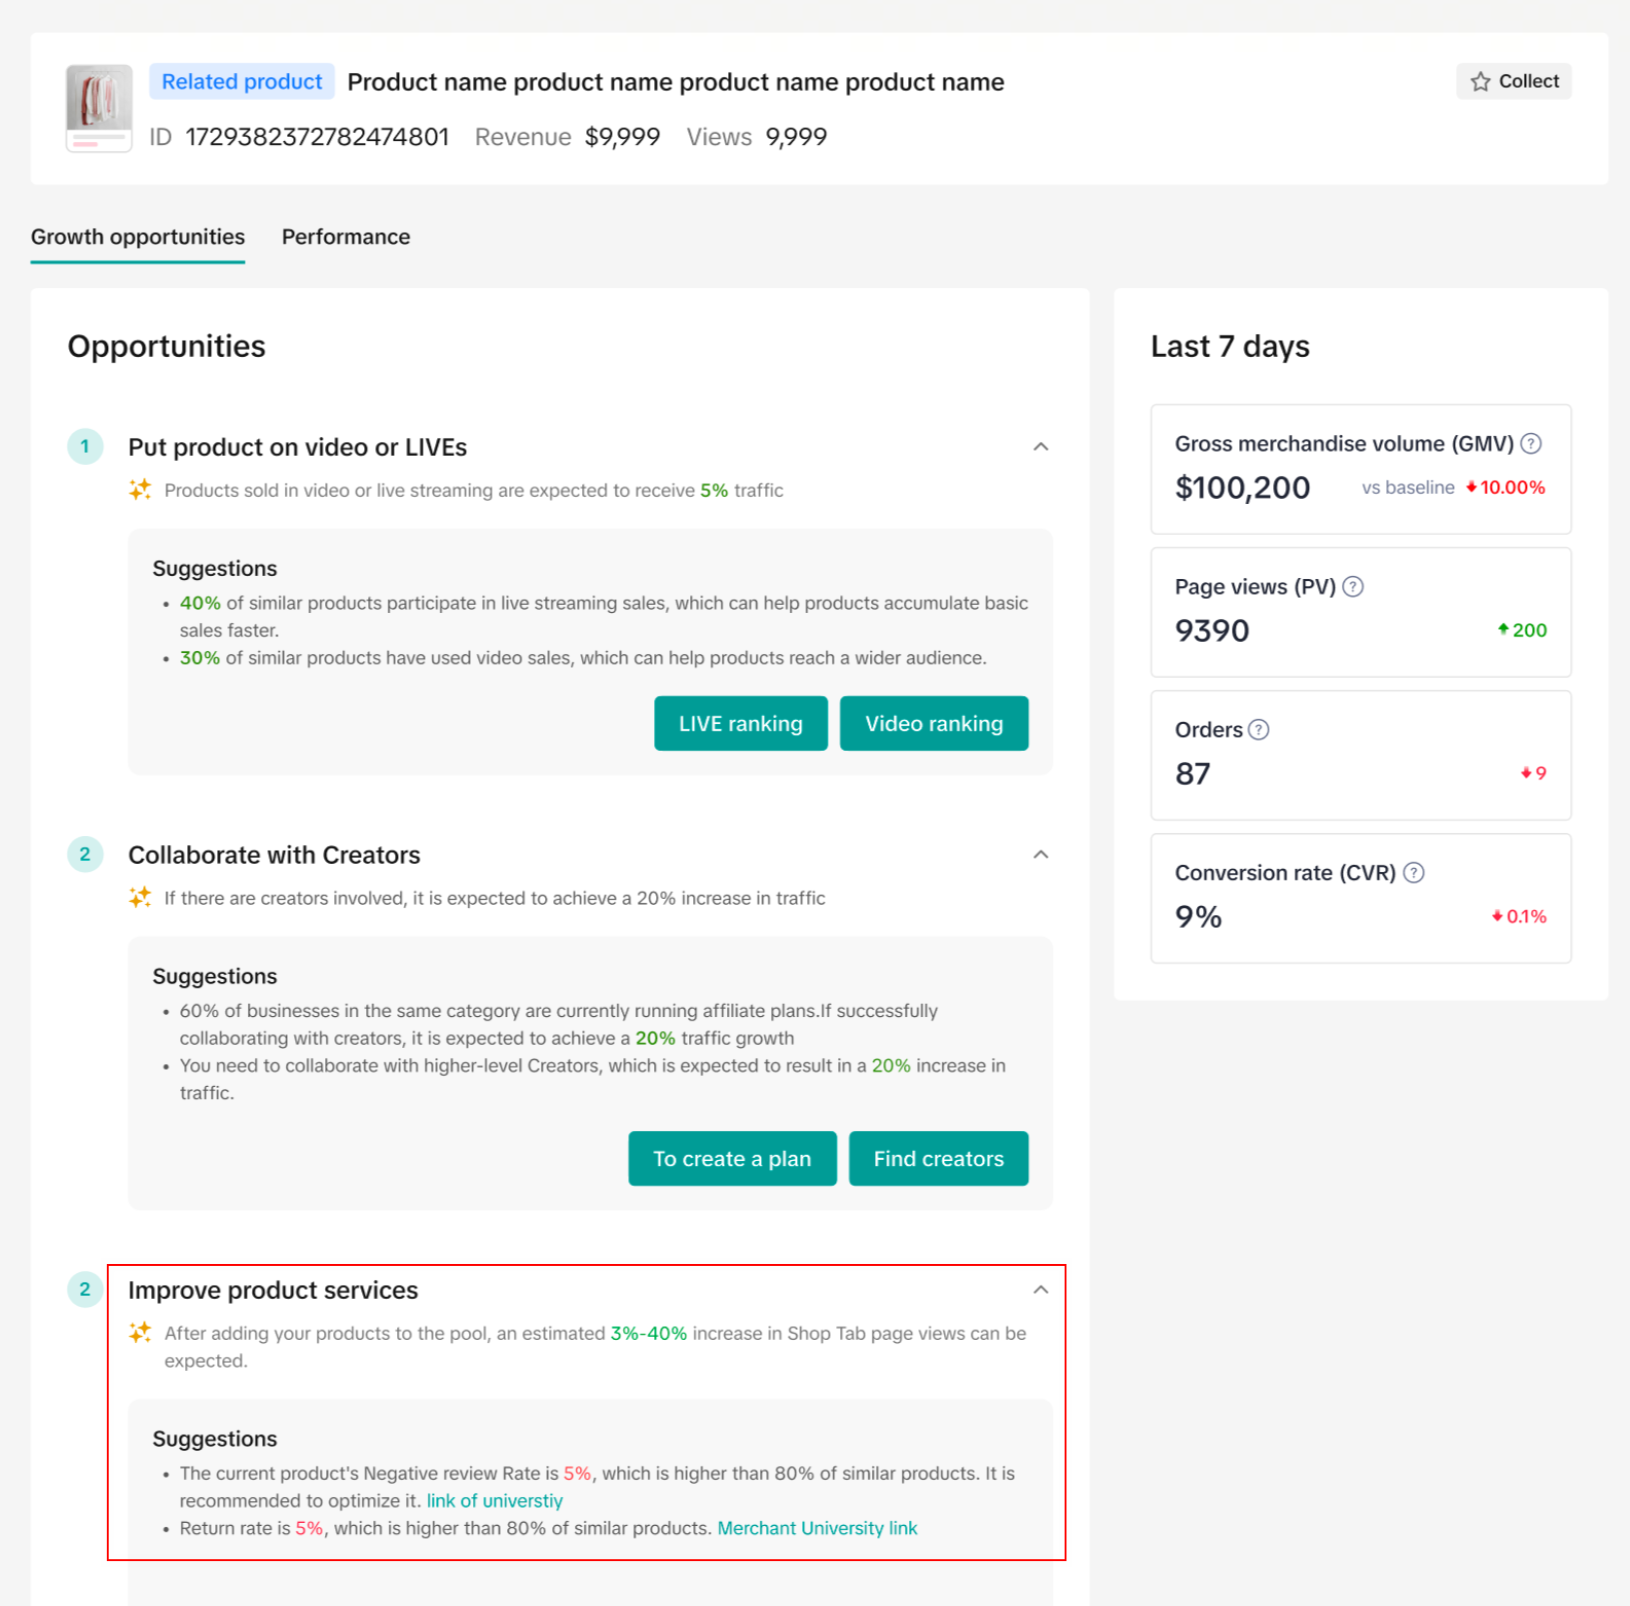 |
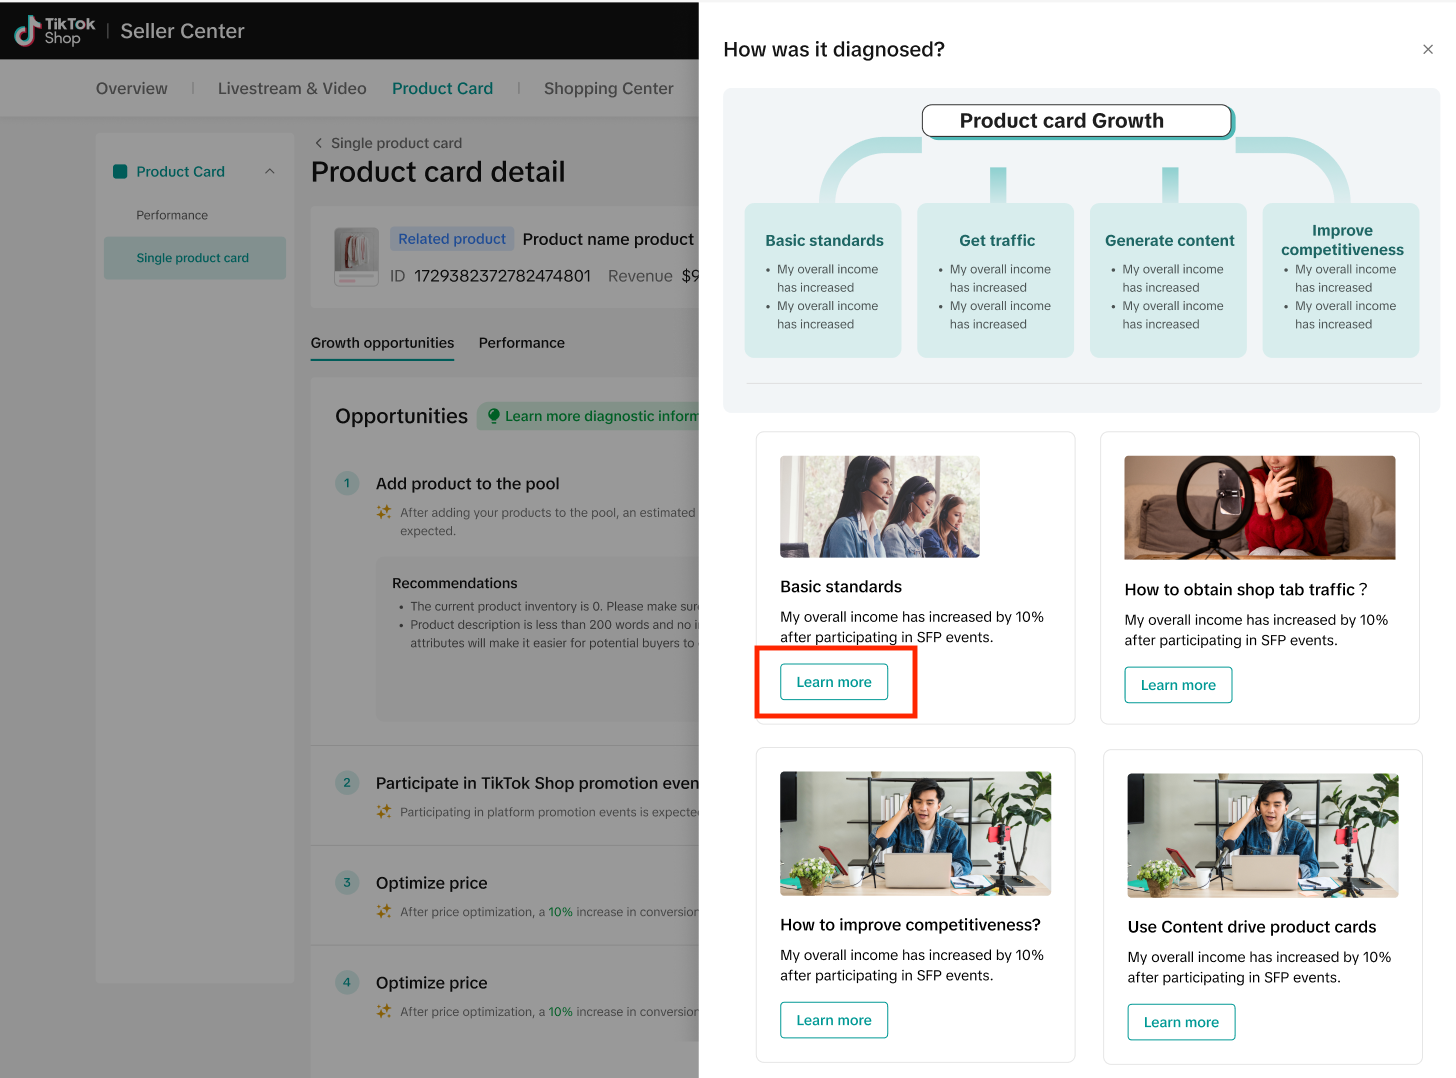
- For a thorough explanation of the diagnoses mentioned above, click on the Learn more button that will take you to a diagram listing the different benchmarks of product card growth.
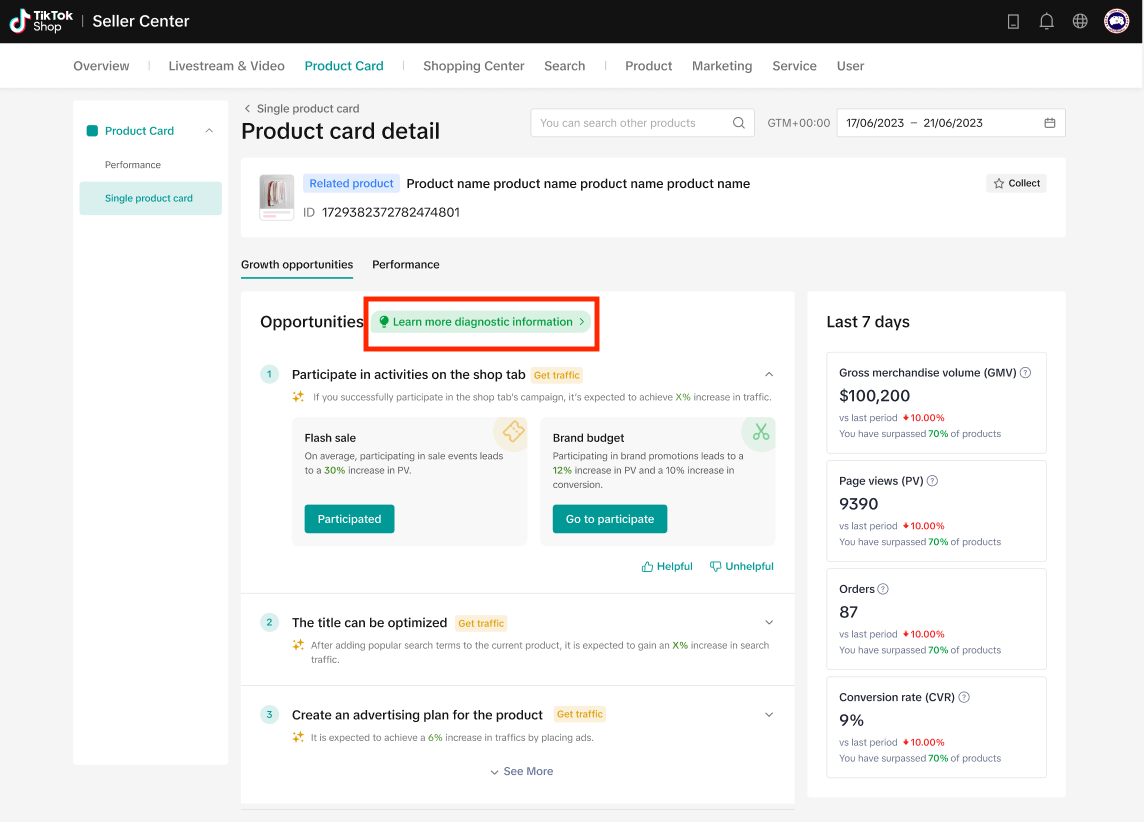
- Click on Learn more to access a thorough guidebook where we will offer explanations and examples of these benchmarks, specifically on how you can optimize your product cards for higher traffic flow.
- Lastly, the Single Product Card section also shows the performance of the selected product card over the last 7 days in metrics such as GMV, PV, and Orders.
FAQs
You may also be interested in

How Does Product Card Diagnosis Work? - Enhance Competitiven…
Overview The Product Card Diagnosis feature is an effective way to analyze if a product card is perf…

How Does Product Card Diagnosis Work? - Content Operations
Overview The Product Card Diagnosis feature is an effective way to analyze if a product card is perf…

How Does Product Card Diagnosis Work? - Shop Tab Traffic Acq…
Overview The Product Card Diagnosis feature is an effective way to analyze if a product card is perf…

Shop Tab & Search Analytics
Access Shop Tab & Search Analytics here: https://seller-us.tiktok.com/compass/shop-tab The Shop Tab…

Cancellation & Return Data Analytics User Manual
Access this feature here. The Cancellations and Returns performance tab has been launched on Data An…