

LIVE Traffic Playbook
Summary
1. What are the key metrics and tools sellers should focus on to analyze and optimize traffic during TikTok Shop Shoppable LIVE sessions?
- Sellers should track critical metrics like Impressions, Views, Enter Room Rate (ERR), Average Viewing Duration, Comment Rate, Follow Rate, Clickthrough Rate (CTR), and Click-to-Order Rate (CTOR) via the LIVE Dashboard for real-time and post-LIVE insights.
- Essential tools include the LIVE Dashboard (central analytics), LIVE Giveaways (boost engagement), LIVE Flash Sales (price incentives), LIVE Manager (manage activities), LIVE Pin (highlight products), and LIVE Events (promote sessions).
2. How can sellers identify and address traffic performance issues or metric deviations during and after their LIVE sessions?
- Monitor the worst-performing metrics during the LIVE and compare them with historical data to identify consistent issues or new problems; focus on whether these issues occur in Reach, Engagement, or Conversion metrics to pinpoint funnel weaknesses.
- Use the Performance Trends widget to track real-time fluctuations in Impressions and ERR, correlating dips with events like product pins, flash sales, giveaways, or policy violations to take corrective actions promptly.
3. What strategies can sellers implement to improve Enter Room Rate (ERR) and overall audience engagement during their LIVE streams?
- Use billboards highlighting key products, promotions, and shipping benefits to attract viewers; pin flagship products to increase visibility and incentivize entry into the LIVE room.
- Enhance engagement by adding thematically linked products, running giveaways with follow/comment tasks, encouraging follows and comments organically, and informing audiences about upcoming promotions.
4. How can sellers optimize traffic conversion rates (CTR and CTOR) to increase sales during TikTok Shop LIVEs?
- Constantly direct audiences to click pinned products and explore the Shopping Bag, ensuring at least one pinned product is always visible; reorder Shopping Bag items to prioritize high-interest or trending products.
- Create urgency by highlighting limited stock and promotions, and include thematically relevant products within the average order value range to reduce purchase barriers and boost checkout rates.
5. What routine should sellers follow to consistently analyze and improve their LIVE traffic performance over time?
- During LIVEs, focus on core traffic metrics like Impressions, ERR, and engagement rates, reacting in real-time to dips or spikes; after LIVEs, perform deep dives into account-level data weekly to identify trends and recurring issues.
- Review the impact of specific LIVE events, product pins, and promotional tactics on traffic and conversion metrics to refine strategies and enhance future LIVE session performance.
Overview
Conducting a successful Shoppable LIVE performance can be daunting and requires juggling various activities, in terms of your performance, at the same time. In addition to individual LIVEs, it can be even more challenging to consistently optimize your performance over multiple LIVE sessions.One of the critical aspects of effective Shoppable LIVE performance is understanding audience traffic during your LIVEs. This ranges from looking at how many audiences are viewing your LIVEs, entering your LIVEs, exploring and buying your products and quite a few things in between.
This Traffic Playbook is intended to be a guiding resource for you to understand
- what constitutes traffic analytics
- the data insights that you should be looking at
- the tools that allow you to do so
- Best practice guidance in terms of analyzing traffic
- And the measures you can take to positively influence traffic
Value proposition of traffic analytics and key principles
Value proposition
Similar to how an effective LIVE setup, preparation, product scripts and product selection process are key elements of a successful LIVE-stream, being able to understand, analyze and optimize your traffic to generate visibility, create interest, foster engagement and finally being able to convert your LIVE viewers into purchasers, are just as key elements in your LIVE methodology. This latter aspect of nurturing your audiences towards conversion and understanding the underlying tactics and means to do so constitutes effective traffic analytics for TikTok Shop Shoppable LIVEs.Effective traffic analytics enables you to
- Understand the channels driving organic traffic into your LIVEs: Understanding the various sources from audiences are discovering and entering your Shoppable LIVE room, provides you with the data insights required to ensure that the most relevant people are always finding out about your ongoing LIVEs and that they are engaging with/purchasing from the LIVE
- Understand the trends and variations for essential metrics to unearth insights: Once people are in your LIVE room, understanding the different engagement and purchase patterns helps you
- Understand when your LIVE is performing well or poorly
- Take the necessary steps to optimize your strategy in real-time or in post-mortem
- Discover a simple yet effective mechanism for consistent traffic analytics: Apart from understanding the essential traffic indicators, this playbook will help you explore and internalize optimal strategies for consistent traffic analytics
Key principles
Please refer to this diagram below denoting the key steps, data insights and trajectory of effective traffic analytics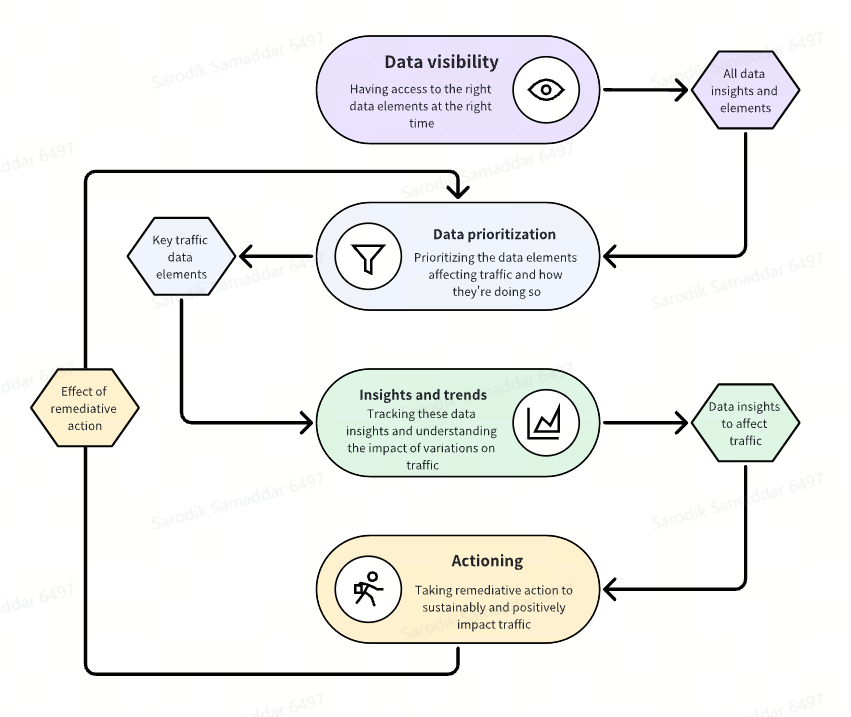
Critical traffic impacting metrics
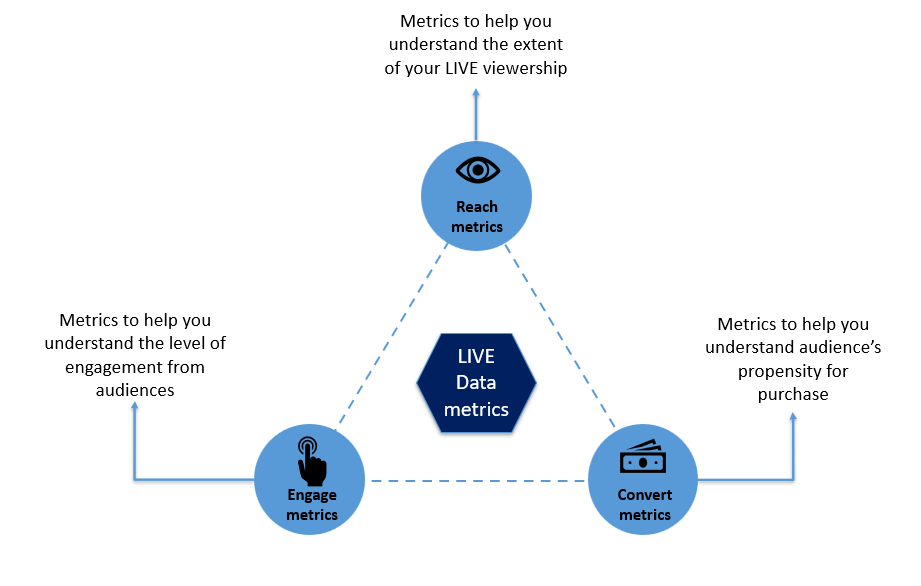
Before analyzing broadly the ways to track traffic analytics, it's important to identify and understand the key data points that constitute the overall performance of your LIVE traffic. We will use this section to dive into these critical metrics and share what those meanIt's helpful to look at "LIVE Data metrics", especially the ones that are critical indicators of LIVE traffic, along three dimensions
| Dimension | Metric | Metrics definitions (and examples) | Additional remarks |
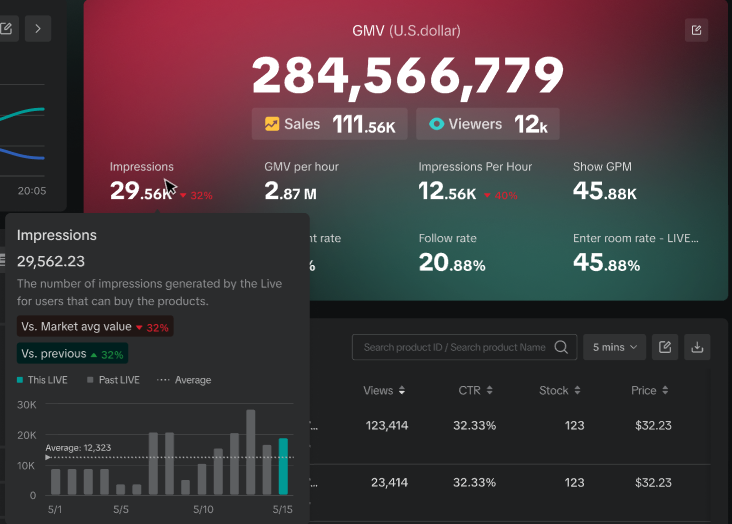
Reach | Impressions | The number of times the LIVE is displayed to audiences in their FYP | While it's important to track both views and impressions of your LIVE room, robust impressions is a better indicator of more optimized traffic performance as it signifies your ability to position and promote the LIVE in the right channels. |
| Views | The number of views of the LIVE, by audiences actually entering the Shoppable LIVE room, by clicking in from different traffic channels | ||
| Viewers | The number of distinct viewers, during the course of the LIVE | ||
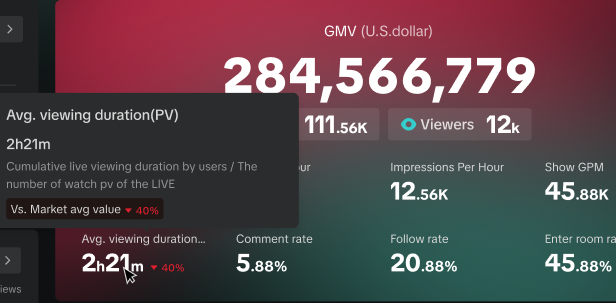
| Average viewing duration | The mean viewing duration for "viewers" in the LIVE. A higher average watch duration signifies better retention for your audiences, which increases the potential for better engagement and conversion | ||
| Enter Room rate (ERR) | The proportion of views as compared to the number of impressions of the LIVE room=(# views/# impressions) * 100%Note: The ERR is basically #views/#impressions and signifies the fraction of impressions who see your LIVE from various traffic sources, that come into and join your LIVE room, to make a potential purchase. | A 100% ERR (which is extremely rare) means you are effectively driving everyone that views your LIVE, into your LIVE room. | |
| Impressions per hour | The average number of LIVE impressions per hour duration of the LIVE room | ||
Engage | Comment rate | Number of comments (including comments from same viewers) per total views of the stream= # comments/# of views | |
| Follow rate | Number of new follows per total views of the stream= # new follows/# of views | ||
| Share rate | Number of times the LIVE is shared during the LIVE stream per views of the stream= # shares/# of views | ||
| Like rate | Number of likes for the LIVE per views of the stream= # likes/# of views | ||
Convert | Clickthrough rate (CTR) | LIVE Clickthrough rate (CTR) denotes the efficiency of converting product views into product clicks=(# of product clicks/LIVE Views) * 100% | |
| Click-to-order rate (CTOR) | LIVE Click-to-order rate (CTOR) denotes the efficiency of converting product clicks into product orders=(# of SKU Orders/Product clicks) * 100% | ||
| Show GPM | The Show GPM (GMV per millie) is the amount of GMV generated from the LIVE room per 1000 impressions of the LIVE. The metric scales the ability to generate GMV across impressions of the LIVE room=(LIVE Room GMV/ # of impressions in 1000s) | While it's important to track both Show GPM and Watch GPM of your LIVE room, A high value of Show GPM is a better indicator of more optimized traffic conversion, similar to how impressions are a better indicator of LIVE traffic performance as compared to views. | |
| Watch GPM | The Watch GPM (GMV per millie) is the amount of GMV generated from the LIVE room per 1000 views of the LIVE. The metric scales the ability to generate GMV across views of the LIVE room=(LIVE Room GMV/ # of views in 1000s) |
Recommended traffic analytics guidelines and strategies
The cadence of analyzing traffic for your LIVEs and taking measures to understand patterns and take action will vary based on your level of experience in Shoppable LIVEs, the tools and the platforms you're using and the team/agency that may be assisting you. In general, this section provides certain guidelines that will be beneficial for Creators and Sellers to understand their traffic performance and systematically improve it.GET TO KNOW THE TOOLS AT A GLIMPSEBefore we dive into specific strategies for traffic analytics, let's get a bird's eye level look at the tools available to optimize traffic.
We will look at specific use cases for each of these tools in detail, in a later section
- LIVE Dashboard: The LIVE dashboard is your central tools for all analytics and data insights. Use the dashboard to track all key aspects of analytics to make informed decisions. We will discuss the Dashboard in-depth in this document.
- LIVE Giveaways: Giveaways are a great tool to generate engagement and increase watch duration for your LIVEs. Use the giveaway tasks strategically to meet specific engagement goals
- LIVE Flash sales: Flash sales provide price incentives for your products to your audiences. Use these to boost sales volume through price incentivization.
- LIVE Manager: The LIVE Manager enables end-to-end management of all LIVE activities and tracking audience activity, all from one convenient location.
- LIVE Pin: Pinning products enables quick and easy visibility of your flagship products, driving traffic into your LIVE and aiding conversion for audiences in your LIVE
- LIVE Events: Events are a great way to organize and promote your LIVEs in advance, to ensure advance awareness for your audiences
Understand deviations in your key LIVE Metrics
| Analyze key LIVE metrics | Recommended analysis timeframe | Where to look | Recommended Analysis Guidelines |
  | For all Creators and Sellers - During and after the LIVE | [PC] LIVE Dashboard -> Overview -> Core data[APP] Shopping Bag Analytics |
|
Strategies to optimize traffic across channels
Knowing deviations across various key LIVE metrics is only half of the story in optimizing overall LIVE traffic. Understanding these deviations and the fluctuations that are driven across different traffic sources, along with measures/strategies to improve traffic across channels, is quite critical to long-term traffic optimization for LIVEs.Before we look into deep dive guidelines and strategies, you can refer to the section below
| Optimization scenario | Interface | Where and what to look for | Recommended Analysis Guidelines | Strategies |
| Assess traffic impact through violations | 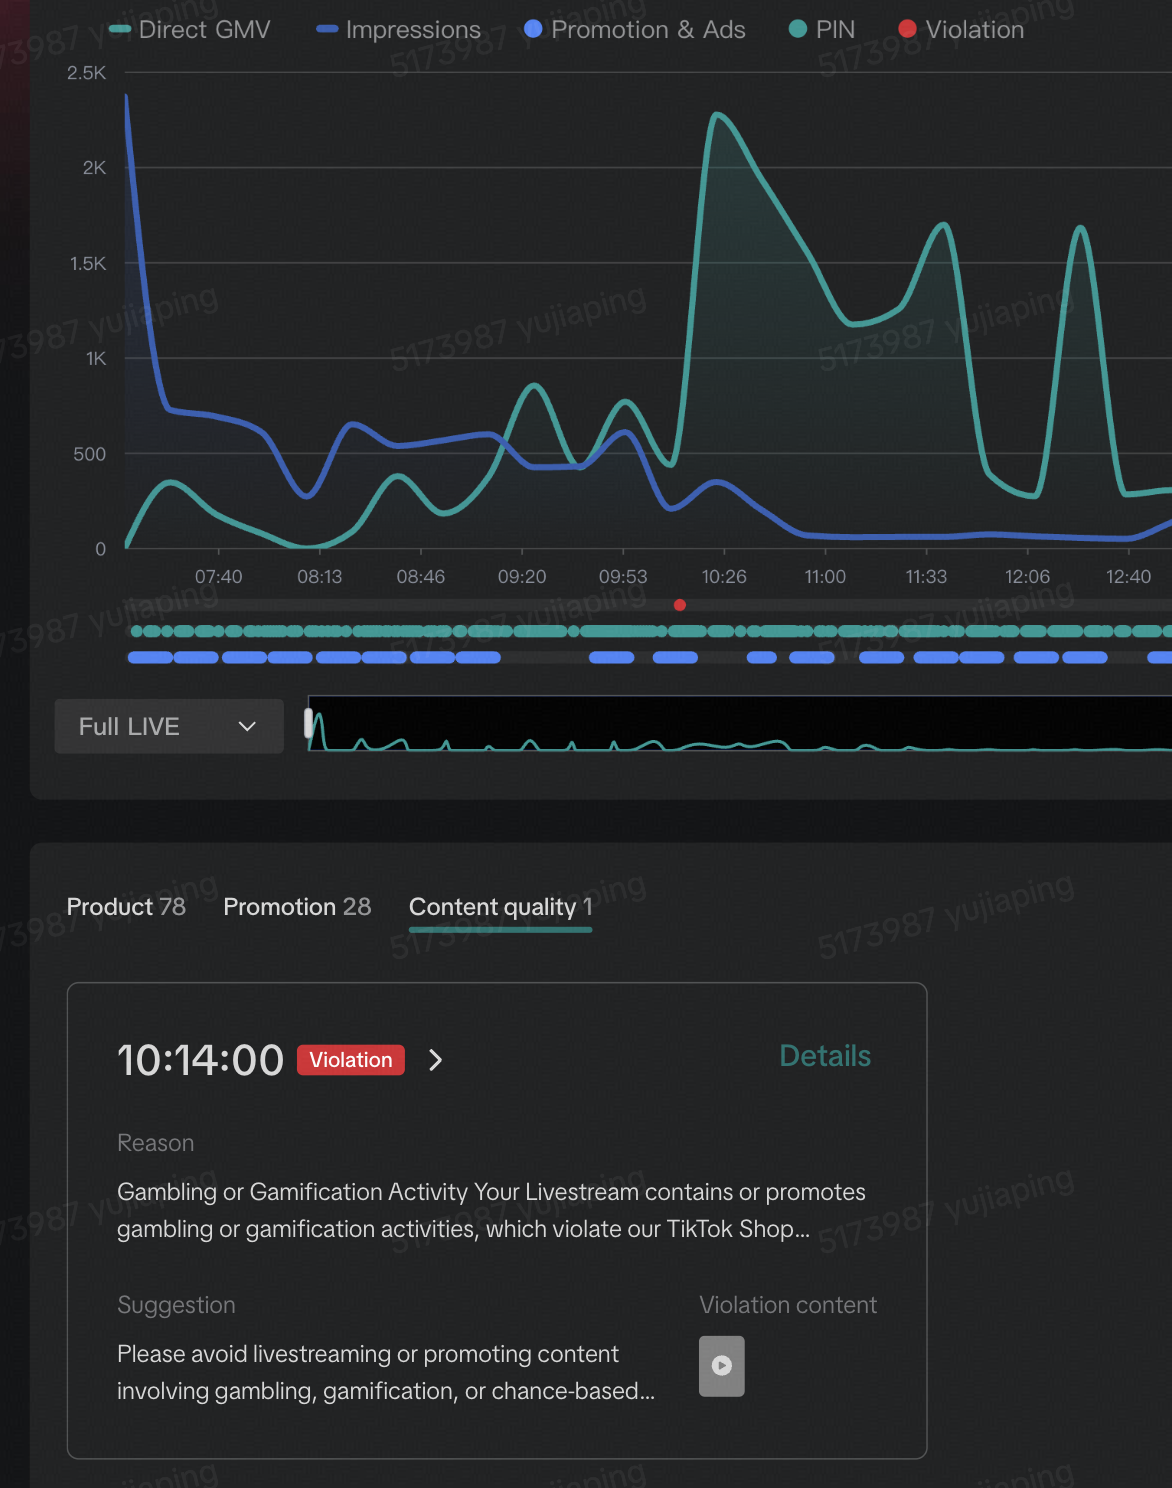 | [PC] LIVE Dashboard -> Performance Trends -> Content Quality |
|
|
| Optimize trends for key traffic metrics | 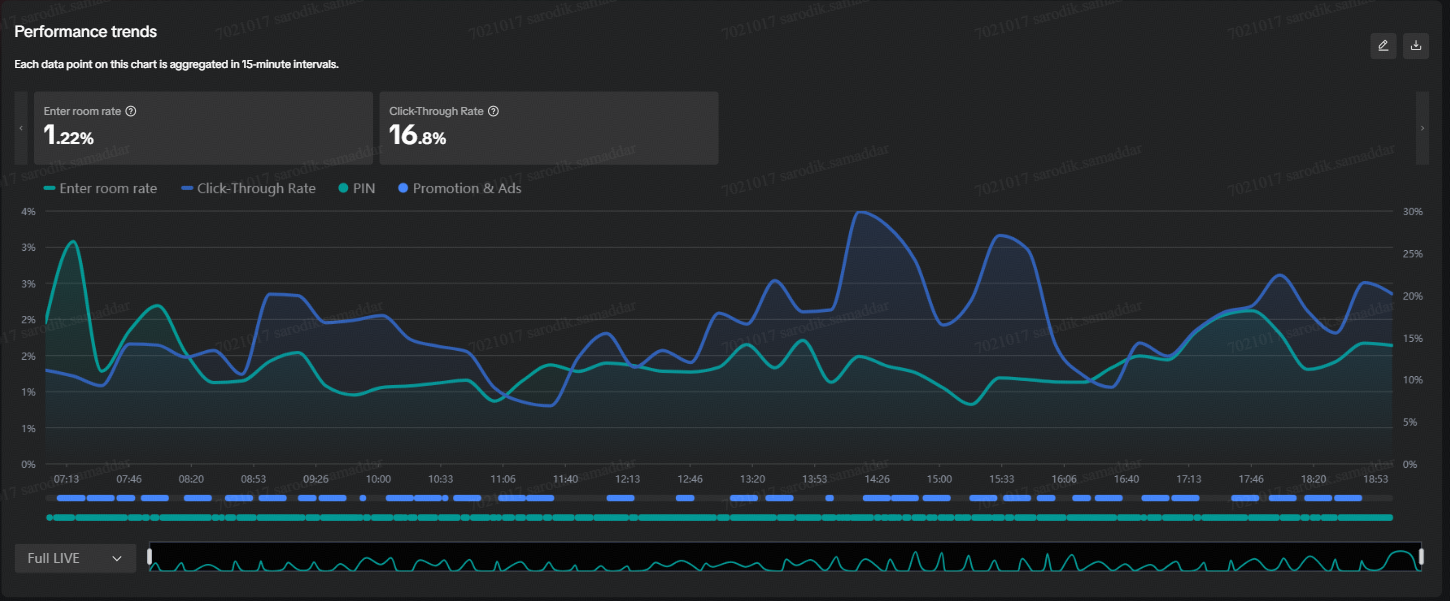 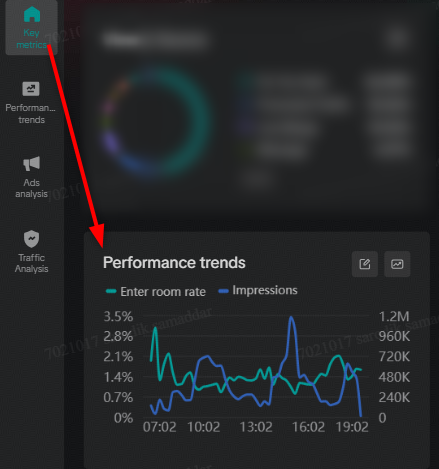 | [PC] LIVE Dashboard -> Overview Tab -> Performance trends[PC] LIVE Dashboard -> Performance trends Tab |
|
|
| Optimize For you Page traffic | 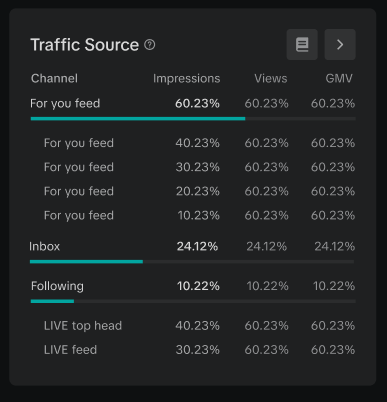 | [PC] LIVE Dashboard |
| |
| Optimize Follower and Inbox traffic | 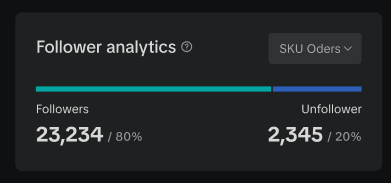 | [PC] LIVE Dashboard |
|
|
Conclusion and next steps
Analyzing and optimizing your LIVE traffic can be daunting and usually requires some practice and a formal routine to develop and fine-tune. A few closing thoughts on how to best develop this routine effectively- Look at the essential aspects of your LIVE traffic performance, during your LIVE, which includes looking at
- Core traffic driving metrics
- Impressions and ERR trends for your LIVE
- Distribution of traffic inflow into your LIVE across multiple traffic sources
- Product specific traffic and conversion data
- After your LIVE, look at your overall account level data and perform a more thorough deep-dive into traffic patterns and drivers. This includes a deeper dive into
- How your account level performance was affected after the conclusion of the latest LIVE session
- Deeper dive into more metric insights for the particular LIVE session, including looking at metric benchmarks and variations from historical performance from the worst performing metrics
- Make it a point to review your account level data at least, once every 7 days, so that you're broadly aware of the metric dips and deviations and look to analyze any LIVE session over 1-2 hrs to understand overall traffic fluctuations and seek opportunities for improvement
And as always, enjoy your LIVE sessions!!
You may also be interested in
Key Metrics to Observe & How to Access Data
Key Metrics to Observe Understanding key metrics is essential for optimizing your TikTok livestream…

LIVE Highlights - auto posting Short Videos
High level overview Are you looking for a way to easily capture the best moments of your LIVE sessio…
LIVE Promotion Tools: Coupon, Giveaway, Flash Sale
Intro Promotion is a powerful way to boost your LIVE selling sessions, drawing viewers in with excl…
Boost Your LIVE Sales: Advanced Techniques for Showcasing Pr…
Shoppable LIVE is changing the way we shop, bringing products to life and creating real-time connect…
Advanced Product Selection Tips for Your Livestream
Are you ready to take your product selection skills to the next level for your livestreams? A carefu…
Stream Like a Pro with LIVE Manager
Want to take your livestreams to the next level? With TikTok's LIVE Manager, creators can operate th…
Level Up TikTok LIVE with LIVE Manager Tools
Are you ready to level up your TikTok LIVE sessions? Streaming from your desktop can offer more cont…
Refining Your Product Selection Strategy with Recommended Pr…
Looking to level up your LIVE shopping strategy? Recommended Product Tags make it easier to discover…
Optimizing LIVE Performance: A guide to tracking and diagnos…
**All following data and figures are mock values and are NOT associated with any real-world user dat…

Track LIVE Performance in Real-Time
**All following data and figures are mock values and are NOT associated with any real-world user dat…