

Track LIVE Performance in Real-Time
Summary
What are the key analytics elements to focus on during a TikTok Shop LIVE session?
- Monitor core data metrics like GMV, CTR, and visibility metrics such as views and product impressions.
- Track traffic trends, product performance, user demographics, user comments, conversion analytics, and promotion effectiveness.
How can sellers access TikTok Shop LIVE analytics tools?
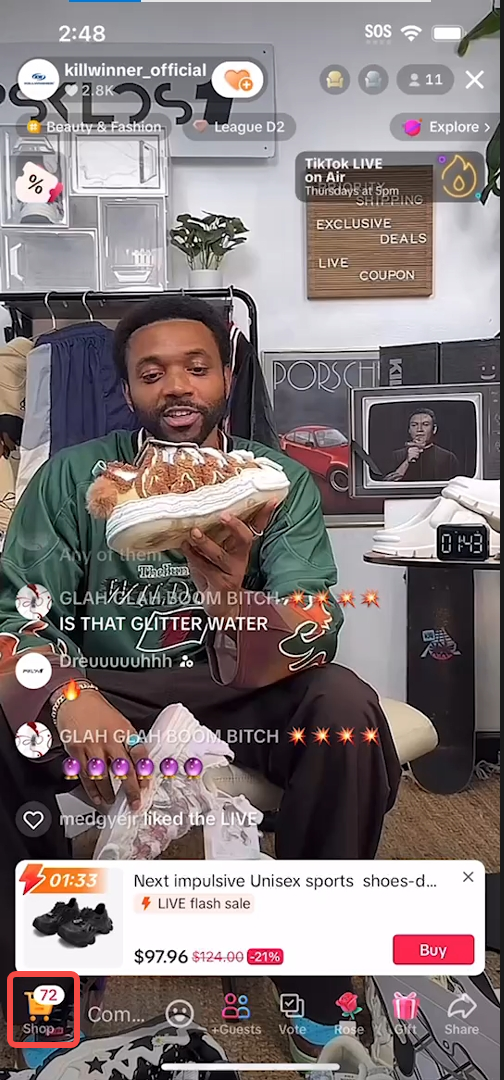
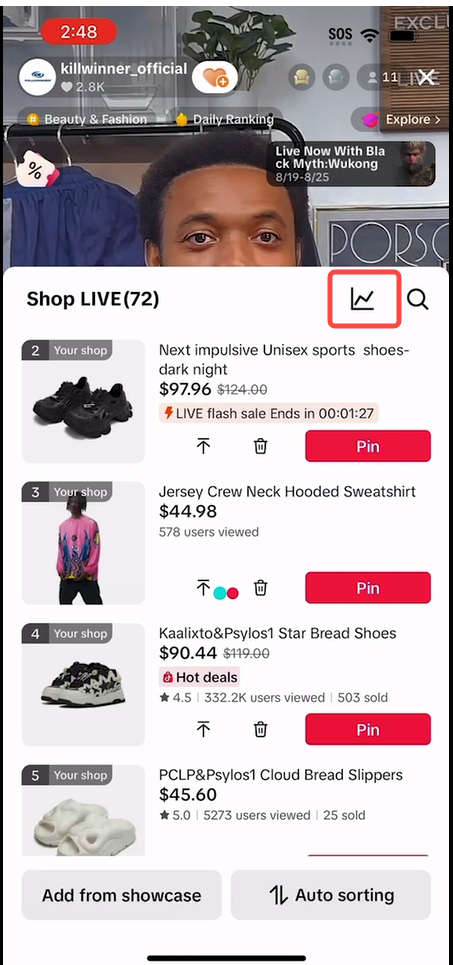
- On the app, tap the shopping bag icon during LIVE, then click the "Trend" icon for insights.
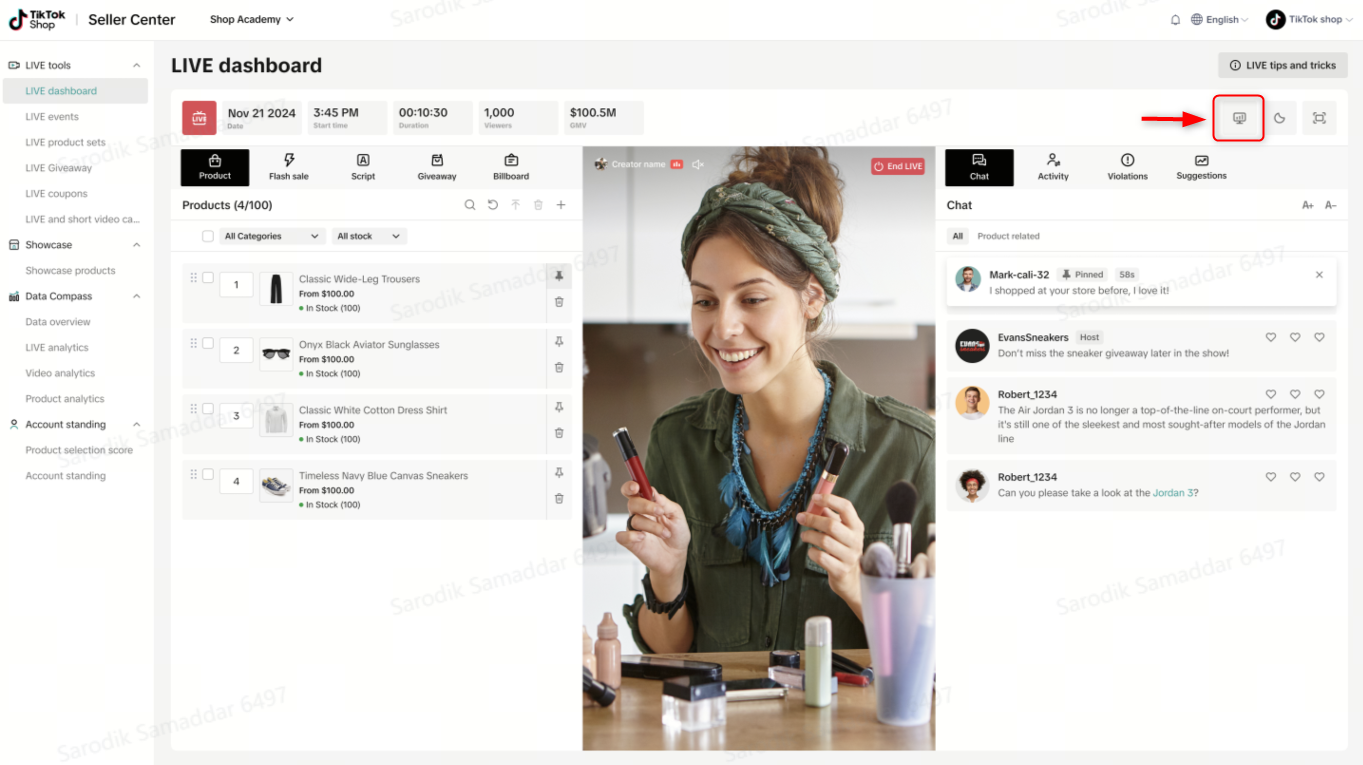
- On PC, use the Streamer Desktop's LIVE Manager to access the LIVE dashboard during a session.
Why is it important to track traffic trends and how should sellers use this data?
- Understanding traffic channels helps focus promotional efforts effectively.
- Track top traffic channels at the start and end of LIVE, adjusting strategies based on engagement patterns.
How can product analytics improve a seller's LIVE session performance?
- Identify high-performing products and those needing more attention.
- Showcase high-potential items early and shift focus to those with high click-through rates later in the session.
What role do user demographics play in enhancing LIVE session strategies?
- Insights into audience profiles help tailor content and promotions.
- Address discrepancies between viewers and buyers to improve conversion rates and target incentives effectively.
In today's rapid internet environment, knowing how your LIVE session is performing is crucial. Focusing on key analytics elements can enhance viewer engagement, drive sales, and refine your promotional strategies. This article will guide you through the essential metrics you should monitor, why they matter, and how to leverage this data to maximize your LIVE sessions. Let's dive into how you can track your LIVE performance effectively.
Where can I find this tool?
TikTok Shop LIVE data tools provide real-time performance tracking for your LIVE sessions on both the app and PC.App Interface - LIVE Screen:
 PC Interface - LIVE Dashboard:Access Point: During your LIVE, in Streamer Desktop, navigate to the LIVE Manager and click on the button highlighted below to be navigated to the LIVE dashboard
Note: This button will only be active and available, DURING A LIVE, and will be disabled at other times.
How should I be tracking analytics during my LIVE?
What factors do I need to focus on during my LIVE
Core Data
| APP interface | PC interface | |
| Core Data | 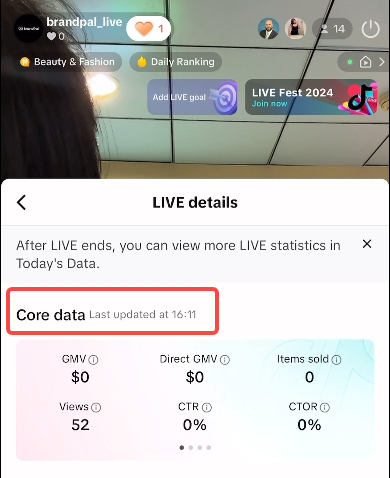 | 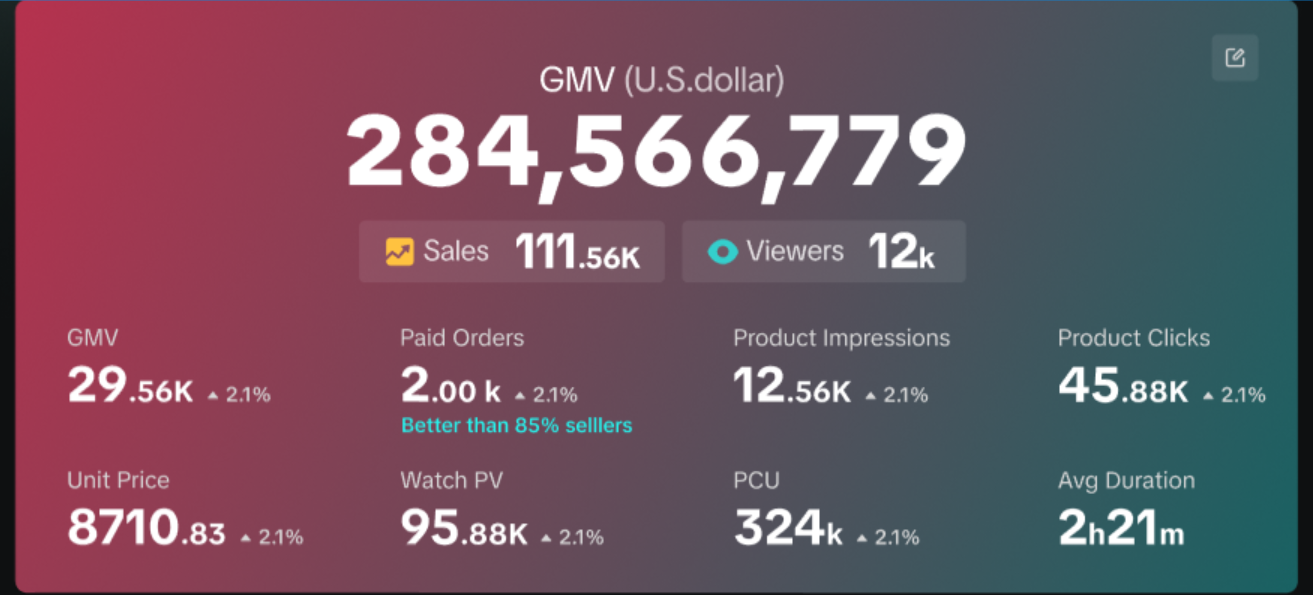 |
| What to Track | Start with core data metrics like Gross Merchandise Value (GMV), Conversion Rate (CTR), and visibility metrics such as views and product impressions. | |
| Description | These are summary metrics that provide a holistic view of your LIVE performance, including financial (GMV, GPM), conversion (CTR, CTOR), and visibility (views, product impressions). | |
| Why It Matters | These summary metrics help you gauge how well you're meeting your goals. | |
| Actionable Measures |
| |
| Proposed Tracking Cadence | Throughout the LIVE session. | |
| Tips on Usage | Regularly compare current room performance against historical averages to identify trends and areas for improvement. | |
Traffic Trends
| APP interface | PC interface | |
| Traffic Trends | 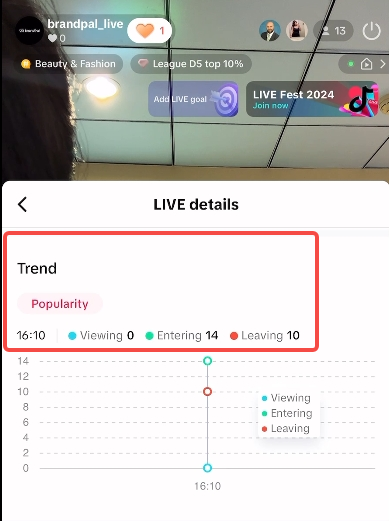 | 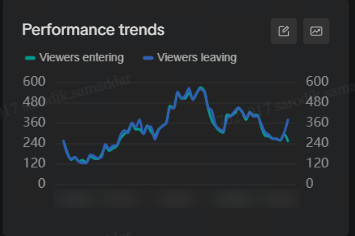 |
| What to Track | Regularly track and compare the top 3 traffic channels (paid and organic) driving LIVE views, monitor monthly changes, and analyze traffic trends throughout the session. | |
| Description | Traffic trends allow you to analyze viewership patterns and engagement levels throughout your LIVE, helping you identify low or high engagement areas. | |
| Why It Matters |
| |
| Actionable Measures |
| |
| Proposed Tracking Cadence |
| |
| Tips on Usage | Reiterate your product value proposition during peak viewer moments and adjust your strategy if you notice dips in engagement. | |
Product Analytics
| APP interface | PC interface | |
| Product Analytics | 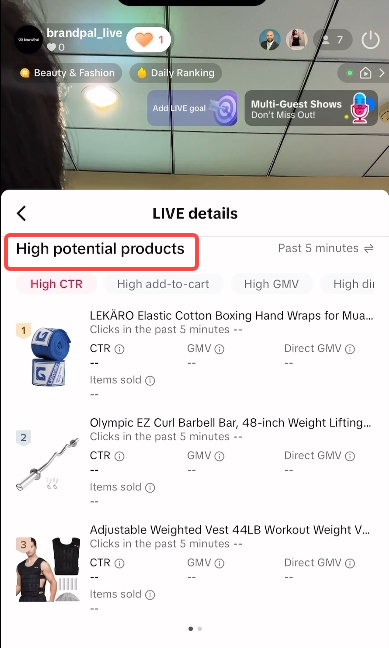 | 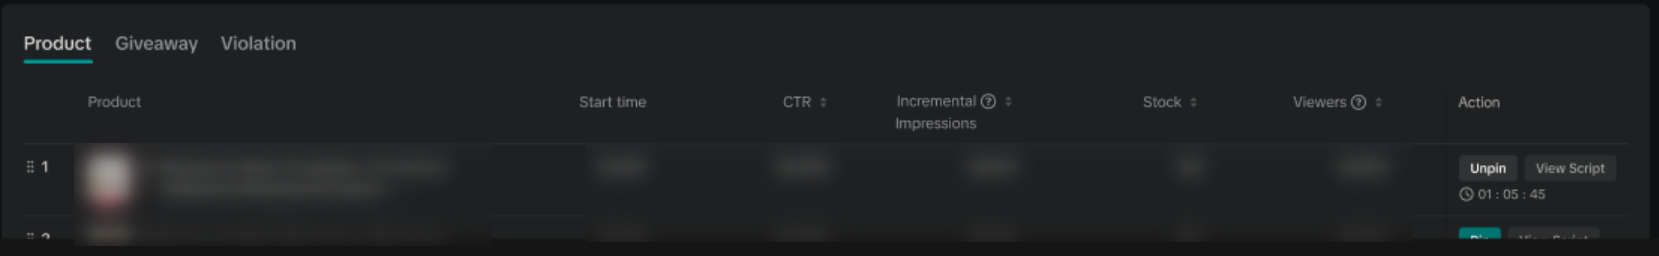 |
| What to Track | Keep an eye on which products generate the most sales and which are lagging despite being featured prominently. | |
| Description | This metric provides insights into individual product performance, helping identify high-performing items and those that may need more attention. | |
| Why It Matters | Insights into product performance can help you highlight high-potential items and understand your audience's preferences. | |
| Actionable Measures |
| |
| Proposed Tracking Cadence | Throughout the LIVE session. | |
| Tips on Usage | Focus on products that historically drive sales early in the session, and later shift to highlighting items with high click-through rates to capture late viewers' interest. | |
User Demographics
| APP interface | PC interface | |
| User Demographics | 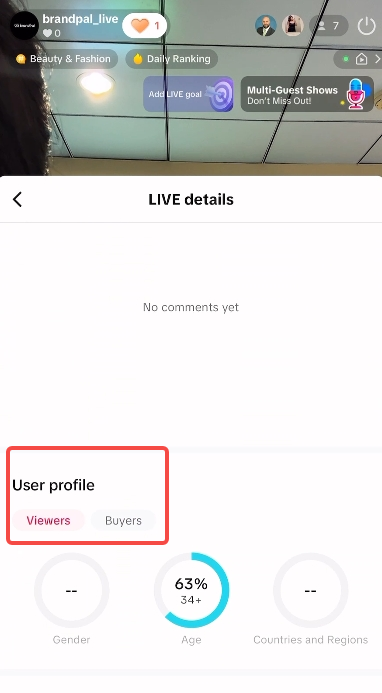 | 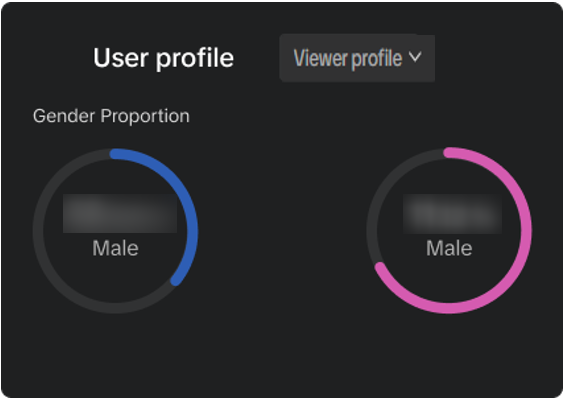 |
| What to Track | Monitor the demographics of your viewers and buyers. | |
| Description | User demographics give you insights into the profile of your audience, including age, gender, location, and device usage. | |
| Why It Matters | Understanding your audience's profile helps tailor your content and promotional strategies. | |
| Actionable Measures |
| |
| Proposed Tracking Cadence | At the beginning and end of your LIVE sessions. | |
| Tips on Usage | Identify differences between viewers and buyers to adjust your promotional strategies and consider incentives for non-buying demographics. | |
User Comments
| APP interface | PC interface | |
| Comments | 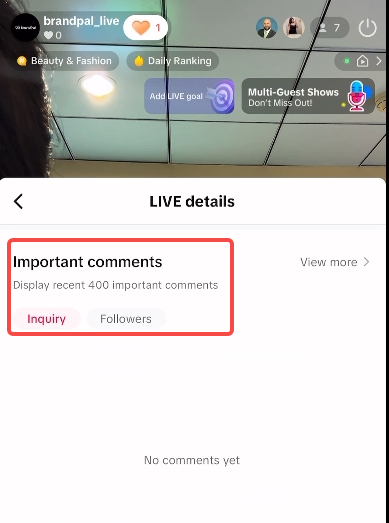 | 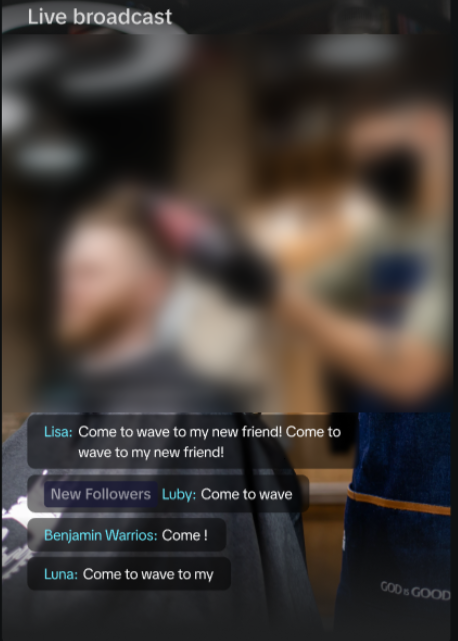 |
| Tips on Usage |
| |
Conversion Analytics
| PC interface | |
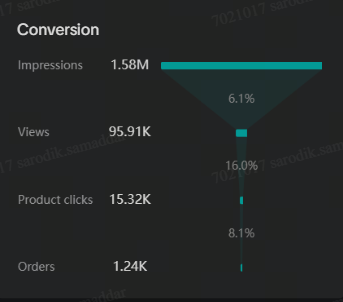 | |
| What to Track | Analyze conversion rates at key points in the buying funnel, such as from viewers to product impressions and clicks to checkout. |
| Description | Conversion analytics help you understand how effectively your audience moves through the buying funnel and pinpoint bottlenecks. |
| Why It Matters | Identifying bottlenecks helps you understand where viewers drop off and allows you to take action to improve conversion rates. |
| Actionable Measures | If you notice a drop-off between views and clicks, consider enhancing your product presentation or adjusting pricing strategies. |
| Proposed Tracking Cadence | Intermittently throughout LIVE, especially during promotional activities. |
| Tips on Usage | Pay close attention to any significant drops in conversion between stages of the funnel and adjust your messaging or product focus accordingly. |
Promotion Analytics
| PC interface | |
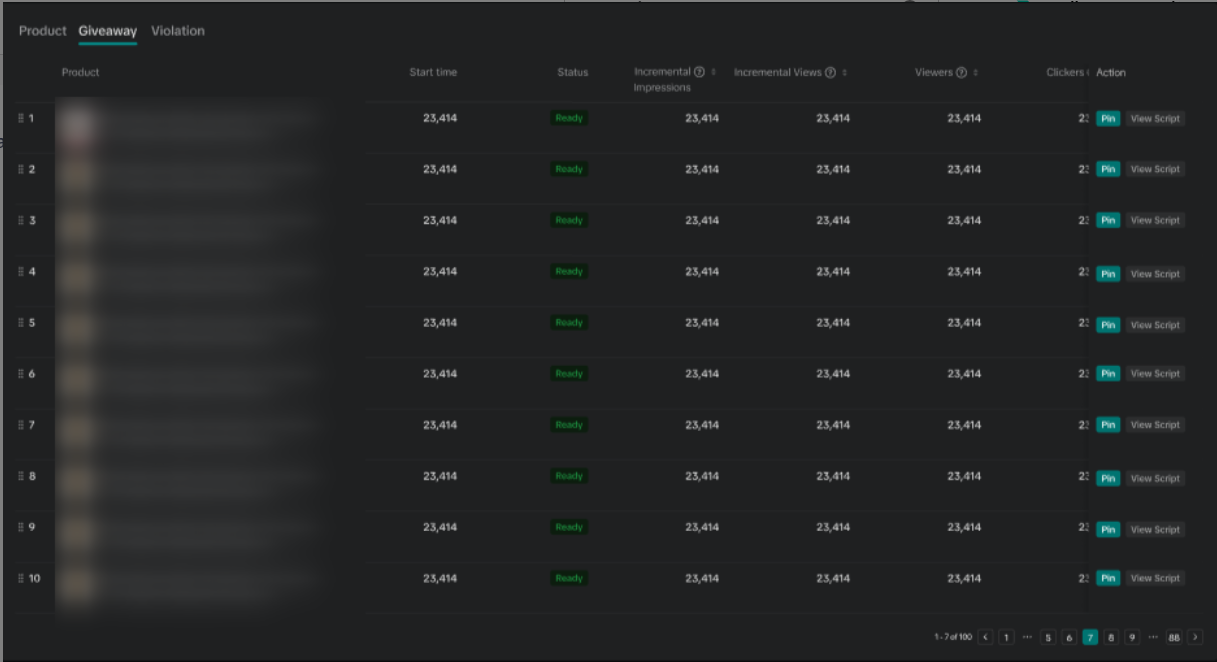 | |
| What to Track | Evaluate the effectiveness of any promotions, specifically giveaways, during your LIVE. |
| Description | Promotion analytics give you details surrounding the efficiency of promotions you run during your LIVE |
| Why It Matters | Knowing to what extent promotions generate incremental value helps refine future promotional strategies and understand its effectiveness in driving further sales. |
| Actionable Measures | Verbally reinforce any ongoing promotions to encourage urgency and drive more sales, especially when you notice rapidly rising incremental views . |
| Proposed Tracking Cadence | During periods of active promotions and periods when there are traffic dips or high leaving rate. |
Summary
Tracking your LIVE performance in real-time is not just about gathering data; it's about using that data to enhance your engagement and sales strategies. By focusing on core metrics, traffic trends, product performance, conversion efficiency, promotional effectiveness, and user demographics, you can create a more engaging and successful LIVE experience.You may also be interested in
Key Metrics to Observe & How to Access Data
Key Metrics to Observe Understanding key metrics is essential for optimizing your TikTok livestream…

LIVE Highlights - auto posting Short Videos
High level overview Are you looking for a way to easily capture the best moments of your LIVE sessio…
LIVE Promotion Tools: Coupon, Giveaway, Flash Sale
Intro Promotion is a powerful way to boost your LIVE selling sessions, drawing viewers in with excl…
Boost Your LIVE Sales: Advanced Techniques for Showcasing Pr…
Shoppable LIVE is changing the way we shop, bringing products to life and creating real-time connect…
Advanced Product Selection Tips for Your Livestream
Are you ready to take your product selection skills to the next level for your livestreams? A carefu…
Stream Like a Pro with LIVE Manager
Want to take your livestreams to the next level? With TikTok's LIVE Manager, creators can operate th…
Level Up TikTok LIVE with LIVE Manager Tools
Are you ready to level up your TikTok LIVE sessions? Streaming from your desktop can offer more cont…
Refining Your Product Selection Strategy with Recommended Pr…
Looking to level up your LIVE shopping strategy? Recommended Product Tags make it easier to discover…
Optimizing LIVE Performance: A guide to tracking and diagnos…
**All following data and figures are mock values and are NOT associated with any real-world user dat…

LIVE Flash Sale for Creators
Introduction to LIVE Flash Sales in LIVE Manager When sellers invite creators to sell exclusive Flas…