

LIVE Dashboard [PC]
07/02/2025
Summary
What is the unified LIVE dashboard on TikTok Shop and how does it help Creators/Sellers monitor their LIVE performance?
- The unified LIVE dashboard on PC consolidates all essential LIVE analytics—traffic, conversion, product performance, violations, and promotions—into one interface for real-time and post-LIVE insights.
- It enables tracking of key metrics, trend analysis, traffic sources, product-level data, and user engagement to optimize LIVE selling strategies effectively.
How can Creators/Sellers use the dashboard to identify and address performance trends and issues during their LIVE sessions?
- Users can monitor real-time engagement patterns, select specific metrics to analyze variations, and cross-reference these with key events like promotions or violations to understand drivers of performance changes.
- The dashboard highlights the worst-performing metrics during and after LIVE, providing benchmarks and historical trend comparisons to pinpoint areas needing improvement.
What features does the dashboard offer for analyzing traffic sources and audience demographics to optimize LIVE channel strategies?
- It breaks down traffic by source (paid/organic), showing impressions, views, and GMV contributions per channel, allowing sellers to prioritize and compare channel effectiveness side-by-side.
- Audience profiles, including follower vs. non-follower behavior and demographic data (gender, age), help tailor content and targeting strategies for better engagement and conversion.
How does the dashboard support product management, violation handling, and promotional activities during and after LIVE sessions?
- Sellers can track individual product metrics, pin products, access system-generated scripts, and manage giveaways directly from the dashboard to boost product visibility and sales.
- Violation details, reasons, and remediation suggestions are provided with appeal options, enabling quick resolution and compliance management within the same interface.
What additional functionalities does the LIVE broadcast and replay feature provide for enhancing user engagement and post-LIVE analysis?
- The dashboard offers real-time playback of the LIVE session with synchronized user comments to monitor sentiment and respond to inquiries promptly.
- Users can navigate the replay by clicking on trend timeline markers, linking performance data with specific moments in the broadcast for detailed review and strategy refinement.
High level overview
Are you looking for the solution to tracking your LIVE performance comprehensively, during and after your LIVE. Look no further!Introducing the unified LIVE dashboard on PC that aims to be the one-stop solution for monitoring your LIVE performance. From tracking the status and trends for important LIVE metrics, to understanding traffic and conversion and monitoring product product item level performance and violations, the LIVE dashboard will aim to consolidate all your essential LIVE analytics in one location. Read on to learn more on how the dashboard can help you level-up your LIVE performance.
Feature value proposition
At a high level, the market insights functionality gives Creators/Sellers the ability to- Gain high-level overview of all your key LIVE metrics during and after your LIVE completion along with helpful data benchmarks to compare performance
- Understand trends and breakdowns related to your LIVE traffic, trends related to user viewing and conversion funnels for your products
- Continue to utilize the LIVE dashboard to understand salient metric trends throughout the LIVE and cross-check trends with key events (such as violations, pins and promotions) to understand key drivers for metric trend deviations.
- Have a deep dive into real-time performance of your various channels driving traffic into the LIVE.
- Get detailed breakdowns of your product level performance, real-time drilldowns of violations and information for giveaways during and after your LIVE
Salient use cases
The following use cases will be the most relevant for Creators/Sellers using the unified LIVE dashboard on PC.Use Case 1: Track and monitor high level LIVE performance metrics
Objective: Understand performance and discern broad issue areas- Users will be able to view and monitor the high-level financial, traffic and conversion metrics, at one glance, during and after the LIVEs
- Users can customize the metrics they see to provide more tailored visibility of important LIVE performance factors; groups available by "Traffic Impacting (Express)" metrics and other metrics
- Understand the market benchmarks for the worst performing metric during LIVE and worst 3 metrics after the LIVE
Use Case 2: Identify and understand trends for your LIVE
Objective: Understand the rhythm of the LIVE in real-time and take action to course correct.- Track the patterns for how your audience is engaging with your LIVE by tracking the trends of engagement indicators throughout your LIVE
- Select specific LIVE metrics to look at variation patterns and understand which metrics need attention or improvement at specific points in the LIVE
- For all of the trend information, users can select specific pre-available time durations/segments to target their trend analysis for periods of interest in the LIVE.
- Cross-check trends with important events during the LIVE to understand how these events are affecting LIVE metric performance.
Use Case 3: Deep-dive into traffic, conversion and demographic patterns
Objective: Understand user profile and associated traffic patterns for your LIVE- Users can explore which traffic channels (paid or organic) are driving audiences to their LIVEs, allowing for better prioritization of traffic targeting strategy
- Keep tracking your conversion funnel from impressions to checkout and understand where there are conversion bottlenecks that need to be addressed.
- Explore your audience profile to identify your audience's composition and tailor your strategy either to appeal to these audiences or target users with lesser engagement.
Use Case 4: Look at and analyze the performance of your traffic channels to optimize your LIVE channel strategy
Objective: Track impressions, views, GMV and more across your channels to visualize and optimize your channel strategy- Understand viewership trends across the various channels from which audiences are entering your LIVE, in real-time.
- Pick and choose channels to compare against enabling a side-by-side comparison of channel efficacy
Use Case 5: Investigate product, violations and promotions information for LIVEs
Objective: Look at product performance to prioritize products effectively and initiate giveaways or address violations to boost LIVE performance.- Users can track key metrics for individual products and take actions to pin products as well as view system-generated scripts for product talking points
- Users can achieve an overview of their violations throughout the LIVE, coupled with reasons for violations, system-generated remediations and action buttons for raising an appeal to contest individual violations, all from the same location
- Track the status of product performance during giveaways to investigate their effectiveness and which products are generating interest. Users can even start a new giveaway directly from this interface as well.
Use Case 6: Replay your LIVE with LIVE broadcast and track comments in real-time
Objective: Track user sentiments and address inquiries in real-time- Watch your LIVE replayed in real-time or watch the entire broadcast after your LIVE and track user comments in real time to understand user sentiments and craft engagement strategy with your audience.
- Trend information is dynamically linked with the broadcast interface, allowing users to click areas on the trend timeline to be navigated to that exact point in the replay.
Access and authorization
All Creators/Sellers on TikTok Shop and creating Shoppable LIVE content will have access to the unified LIVE dashboard. Currently, the functionality will only be available in the PC version but real-time insights during the LIVE will be available through the APP real-time LIVE insights feature.Entrance
During an ongoing LIVE
The unified LIVE dashboard can be accessed during your ongoing LIVE from the LIVE Manager on Streamer Desktop by clicking on the highlighted action button for the dashboard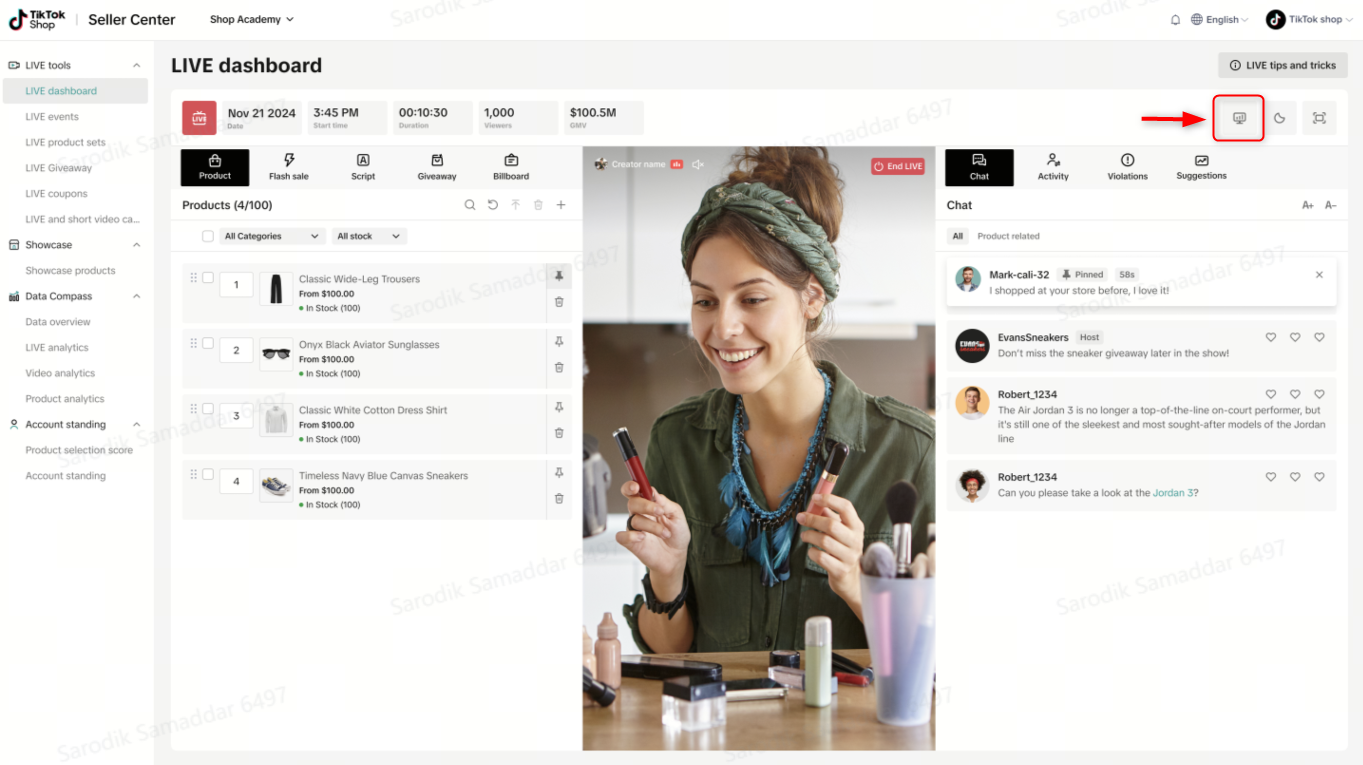
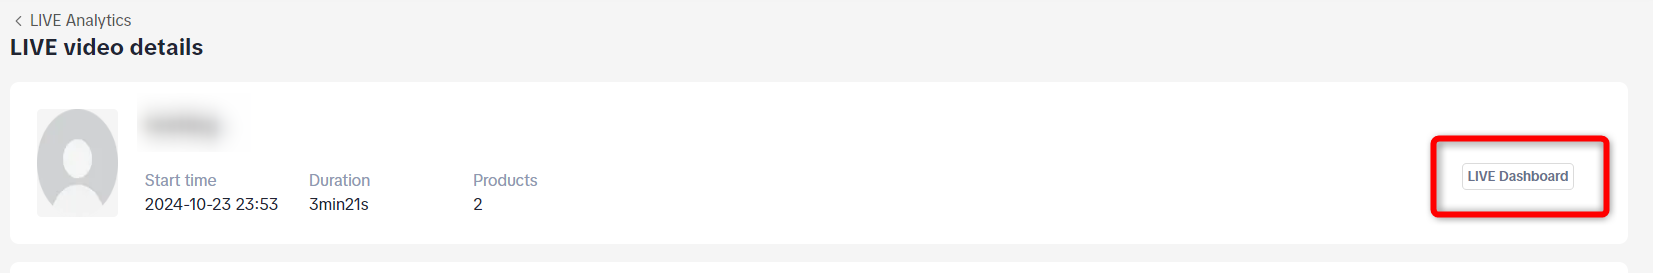
After LIVE completion
After your LIVE is completed, navigate to Livestream Analytics on Streamer desktop and select the individual LIVE room you wish to diagnose. Follow the trail below to be navigated to the unified LIVE dashboard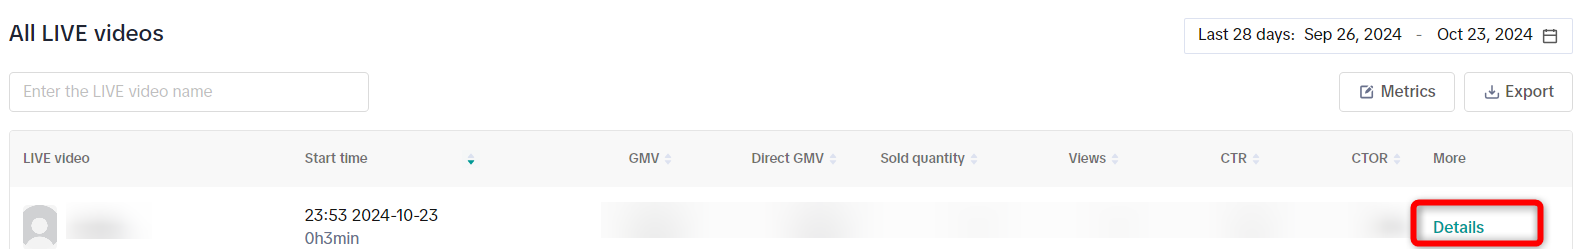
Feature walkthrough
Room level actions
At the top right of the console are a few action buttons. The details of these functionality are detailed below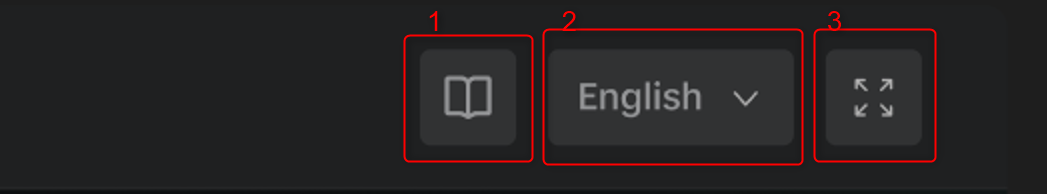
- User Manual: Click on this to navigate to the user manual for the dashboard
- Language: Select the language for the dashboard interface
- Full screen: Enlarge the dashboard to full-screen on your device
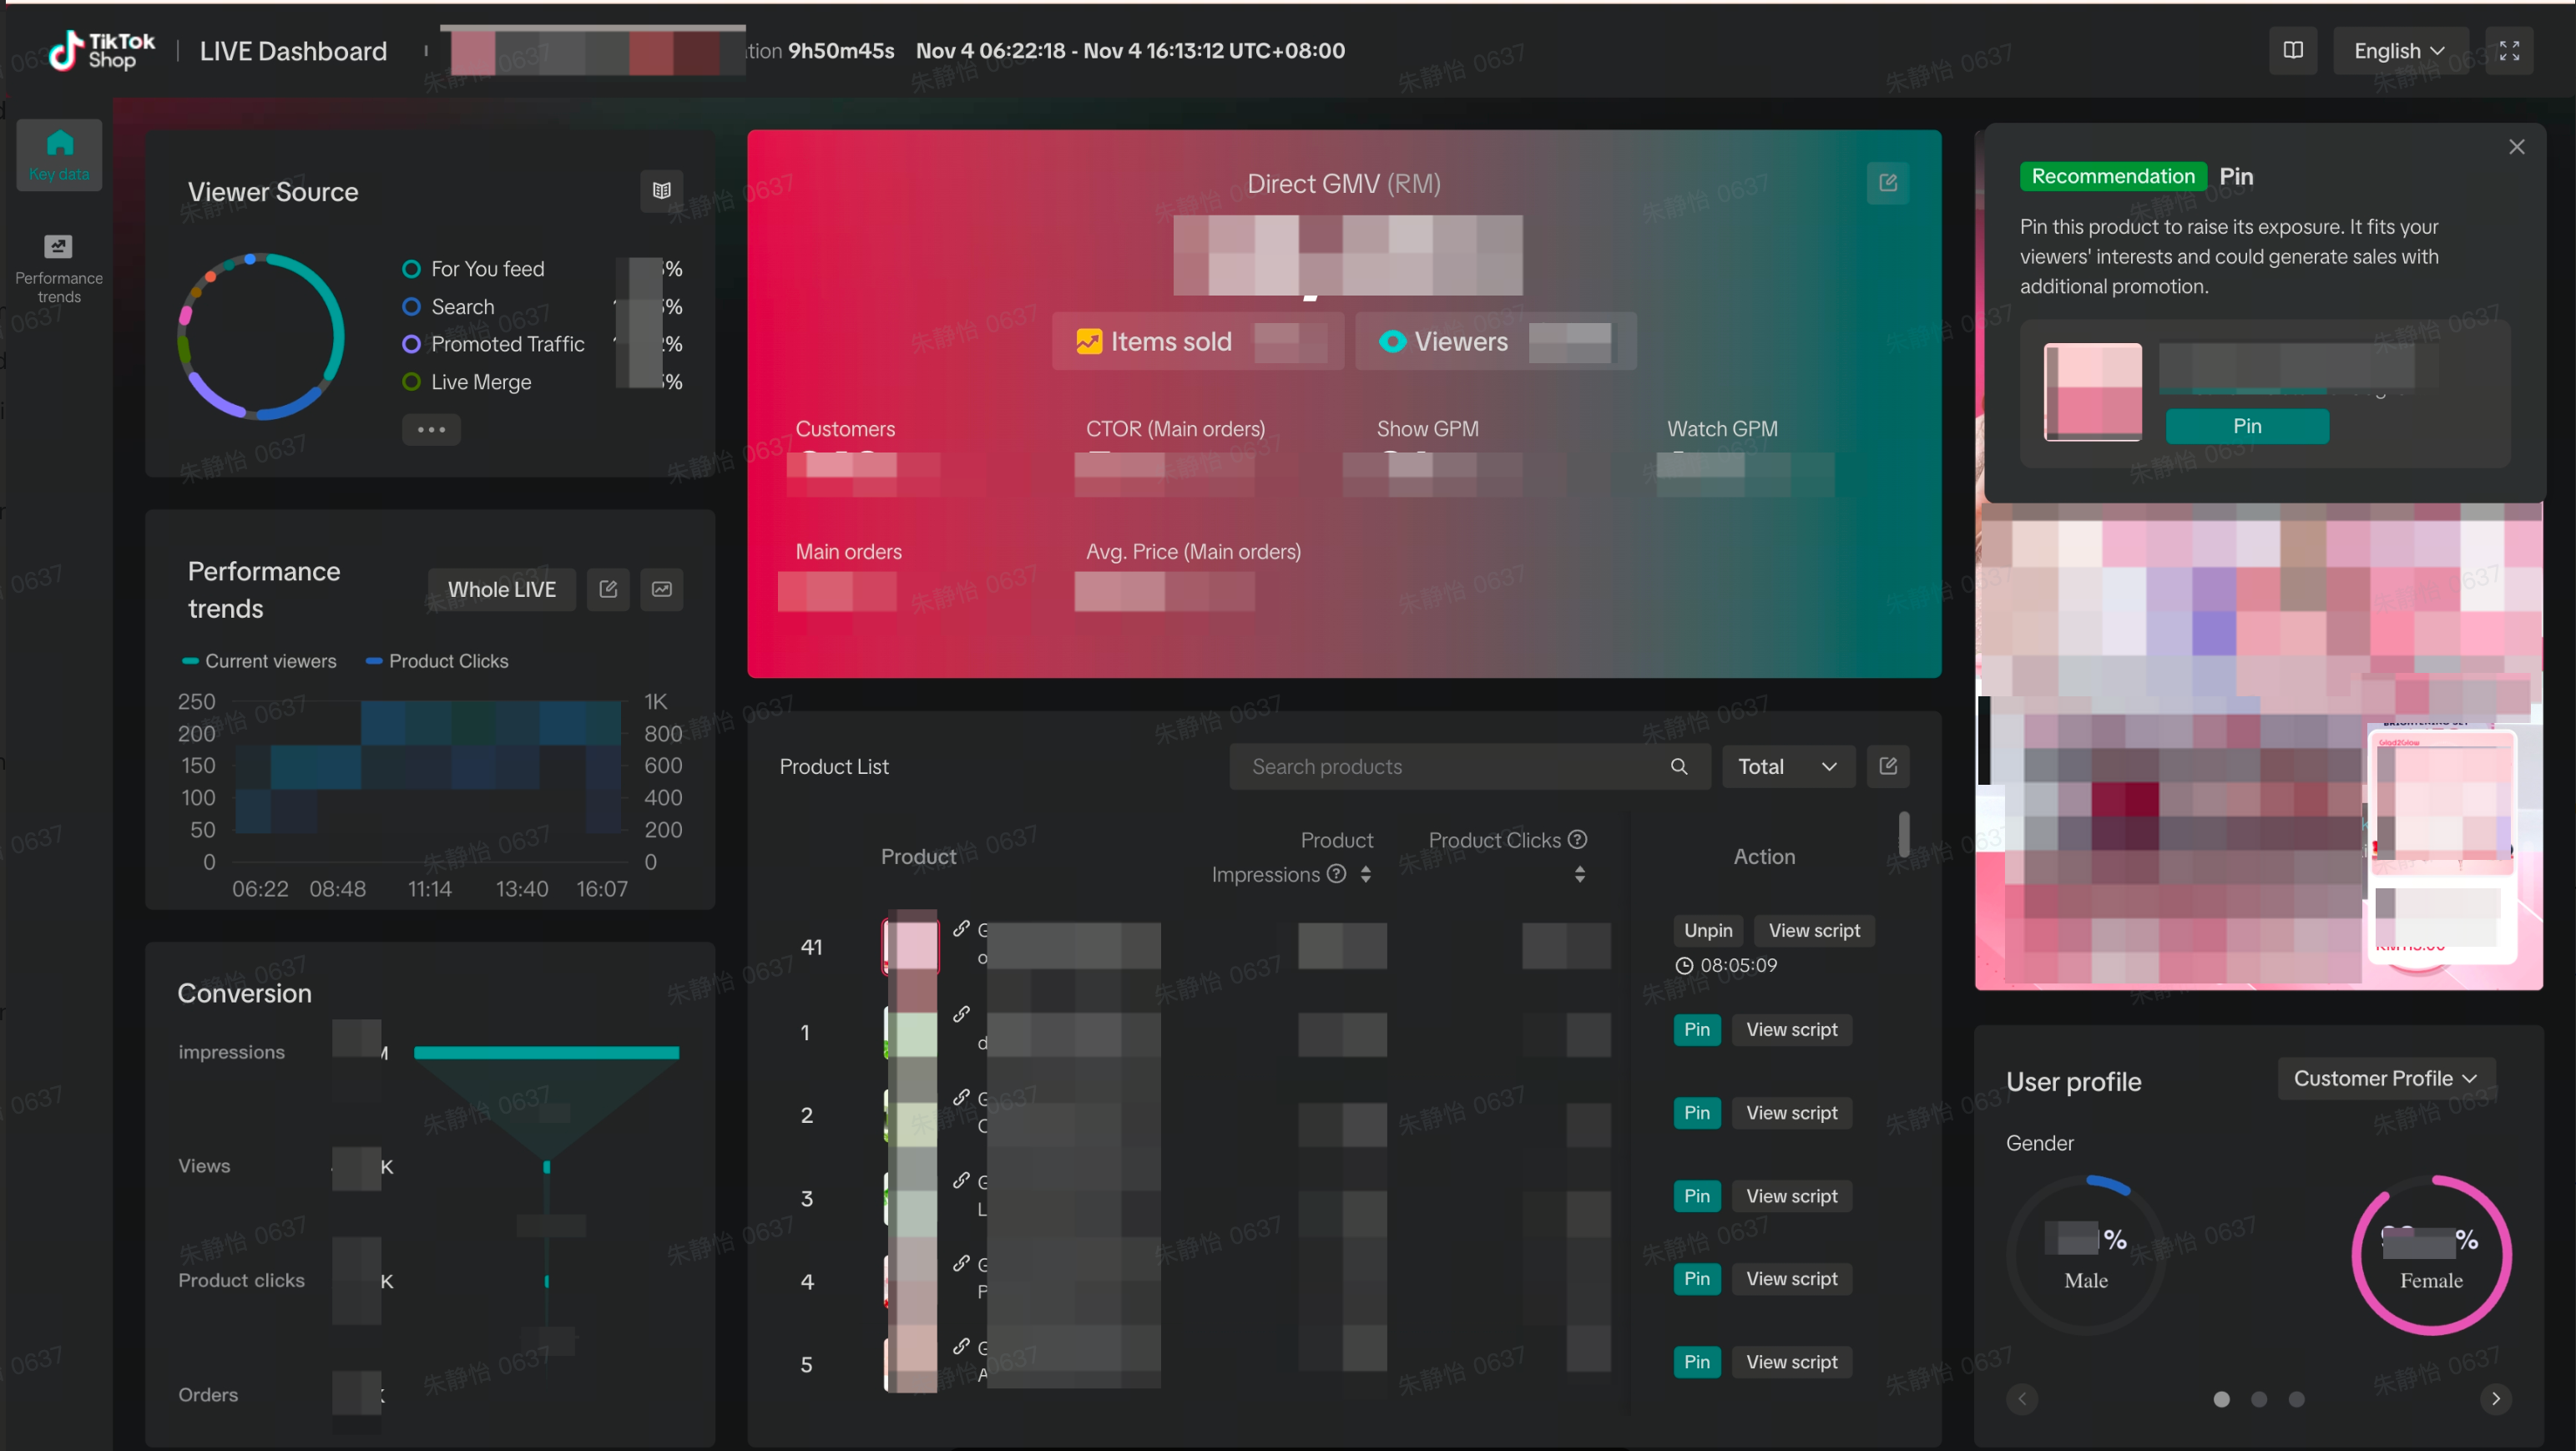
Key data tab
| Functionality/Component | UI interface | Key functionalities/capabilities |
| All figures depicted are dummy values and do not represent any real-world data | ||
| Overview module | 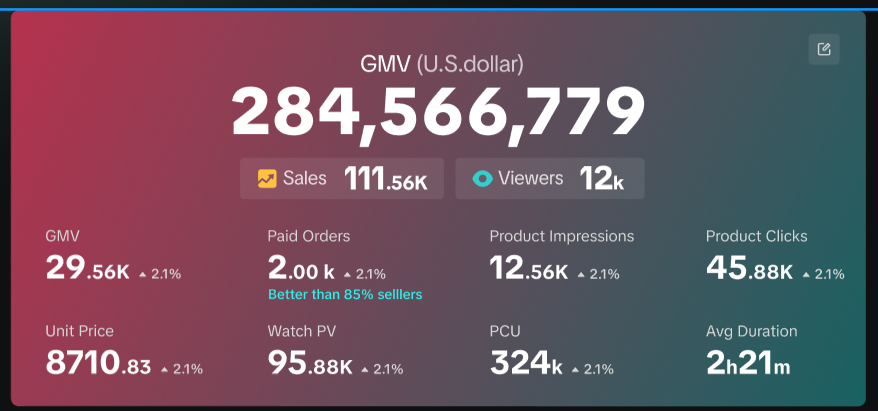 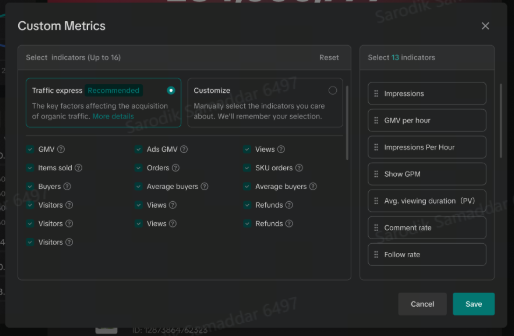 |
|
| Overview module benchmark data | During LIVE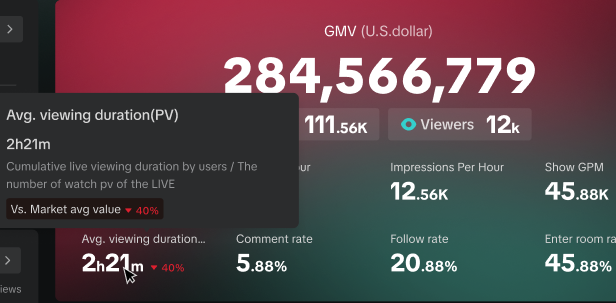 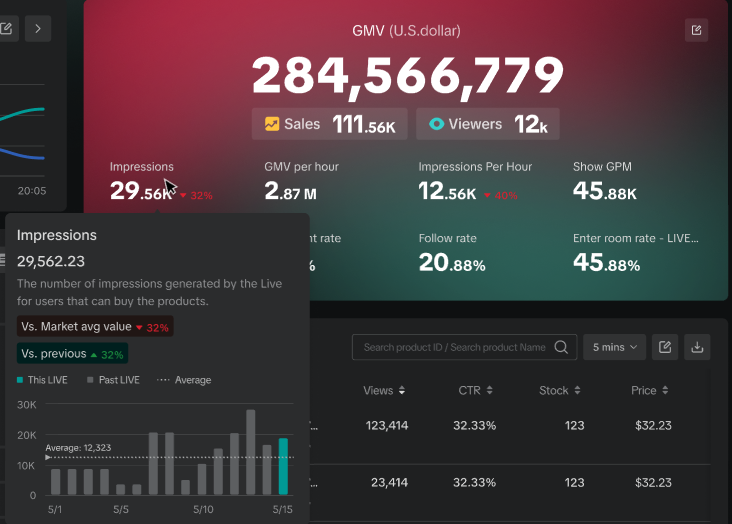 | The benchmark data functionality will vary on whether data is being viewed during the LIVE or after LIVE completionDuring LIVEDuring the LIVE, the worst performing out of all metrics, will be clearly and visually highlighted (with red text) signifying the deviation of the metric from the average market value**After LIVEAfter the LIVE, the 3 worst performing out of all metrics, will again be clearly and visually highlighted (with red text) signifying the deviation of the metric from the average market valueFurther, users can hover on any of these 3 metrics to get a trend chart for the same metric across all past LIVEs in the last 14 days and a trend line for the historical market average for the metric. This allows users to track how the metric performed with respect to their own historical performance.**Average market value considers all LIVE Creators in the same geographical market. |
| View performance trend analysis | 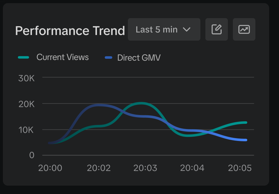 |
|
| Traffic source synopsis | 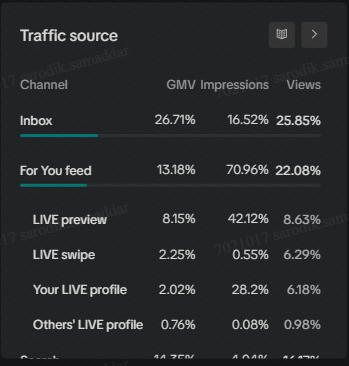 |
|
| Follower analytics | 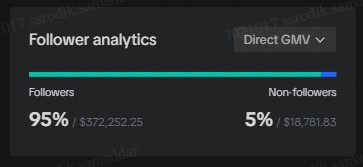 |
|
| Product detail module | 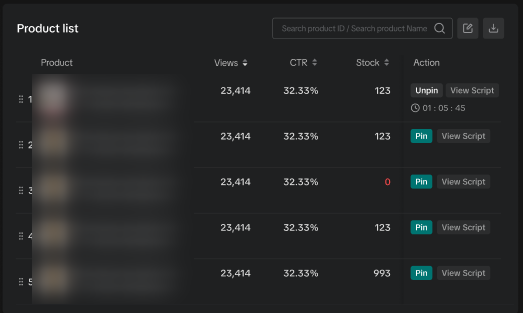 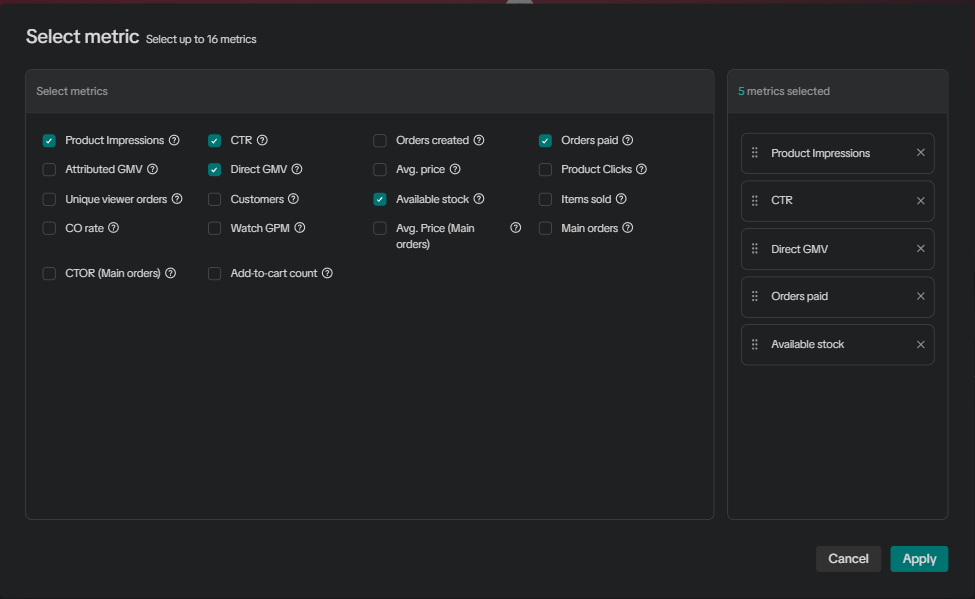 |
|
| LIVE broadcast |  |
|
| User profile breakdown | 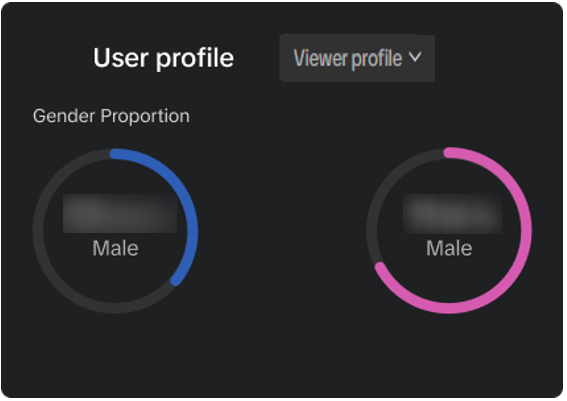 |
|
Performance trends tab
| Functionality/Component | UI interface | Key functionalities/capabilities |
| All figures depicted are dummy values and do not represent any real-world data | ||
| Trend master view | 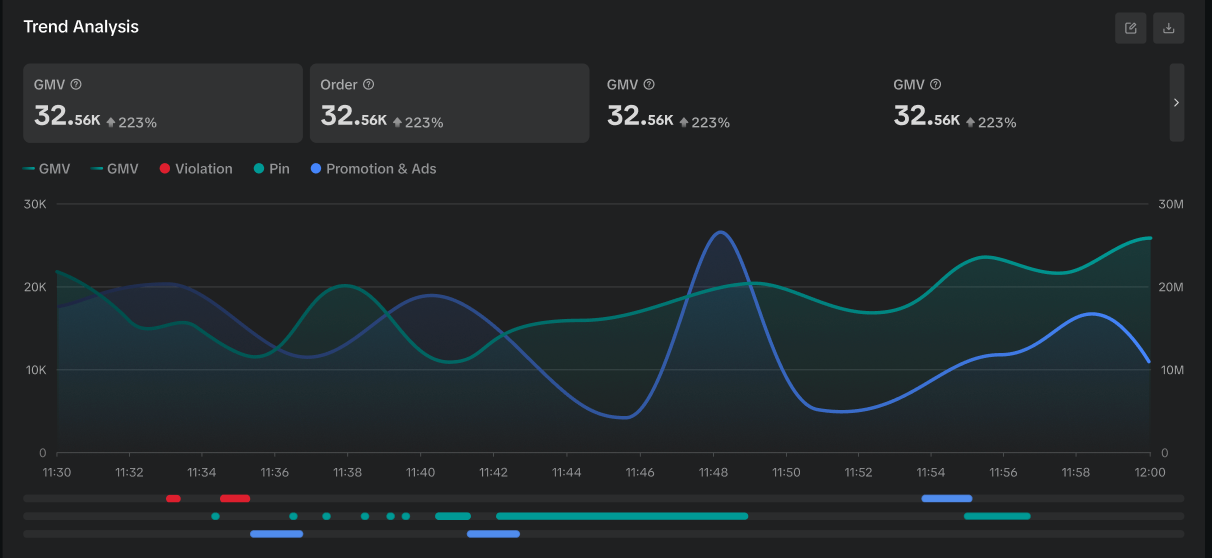 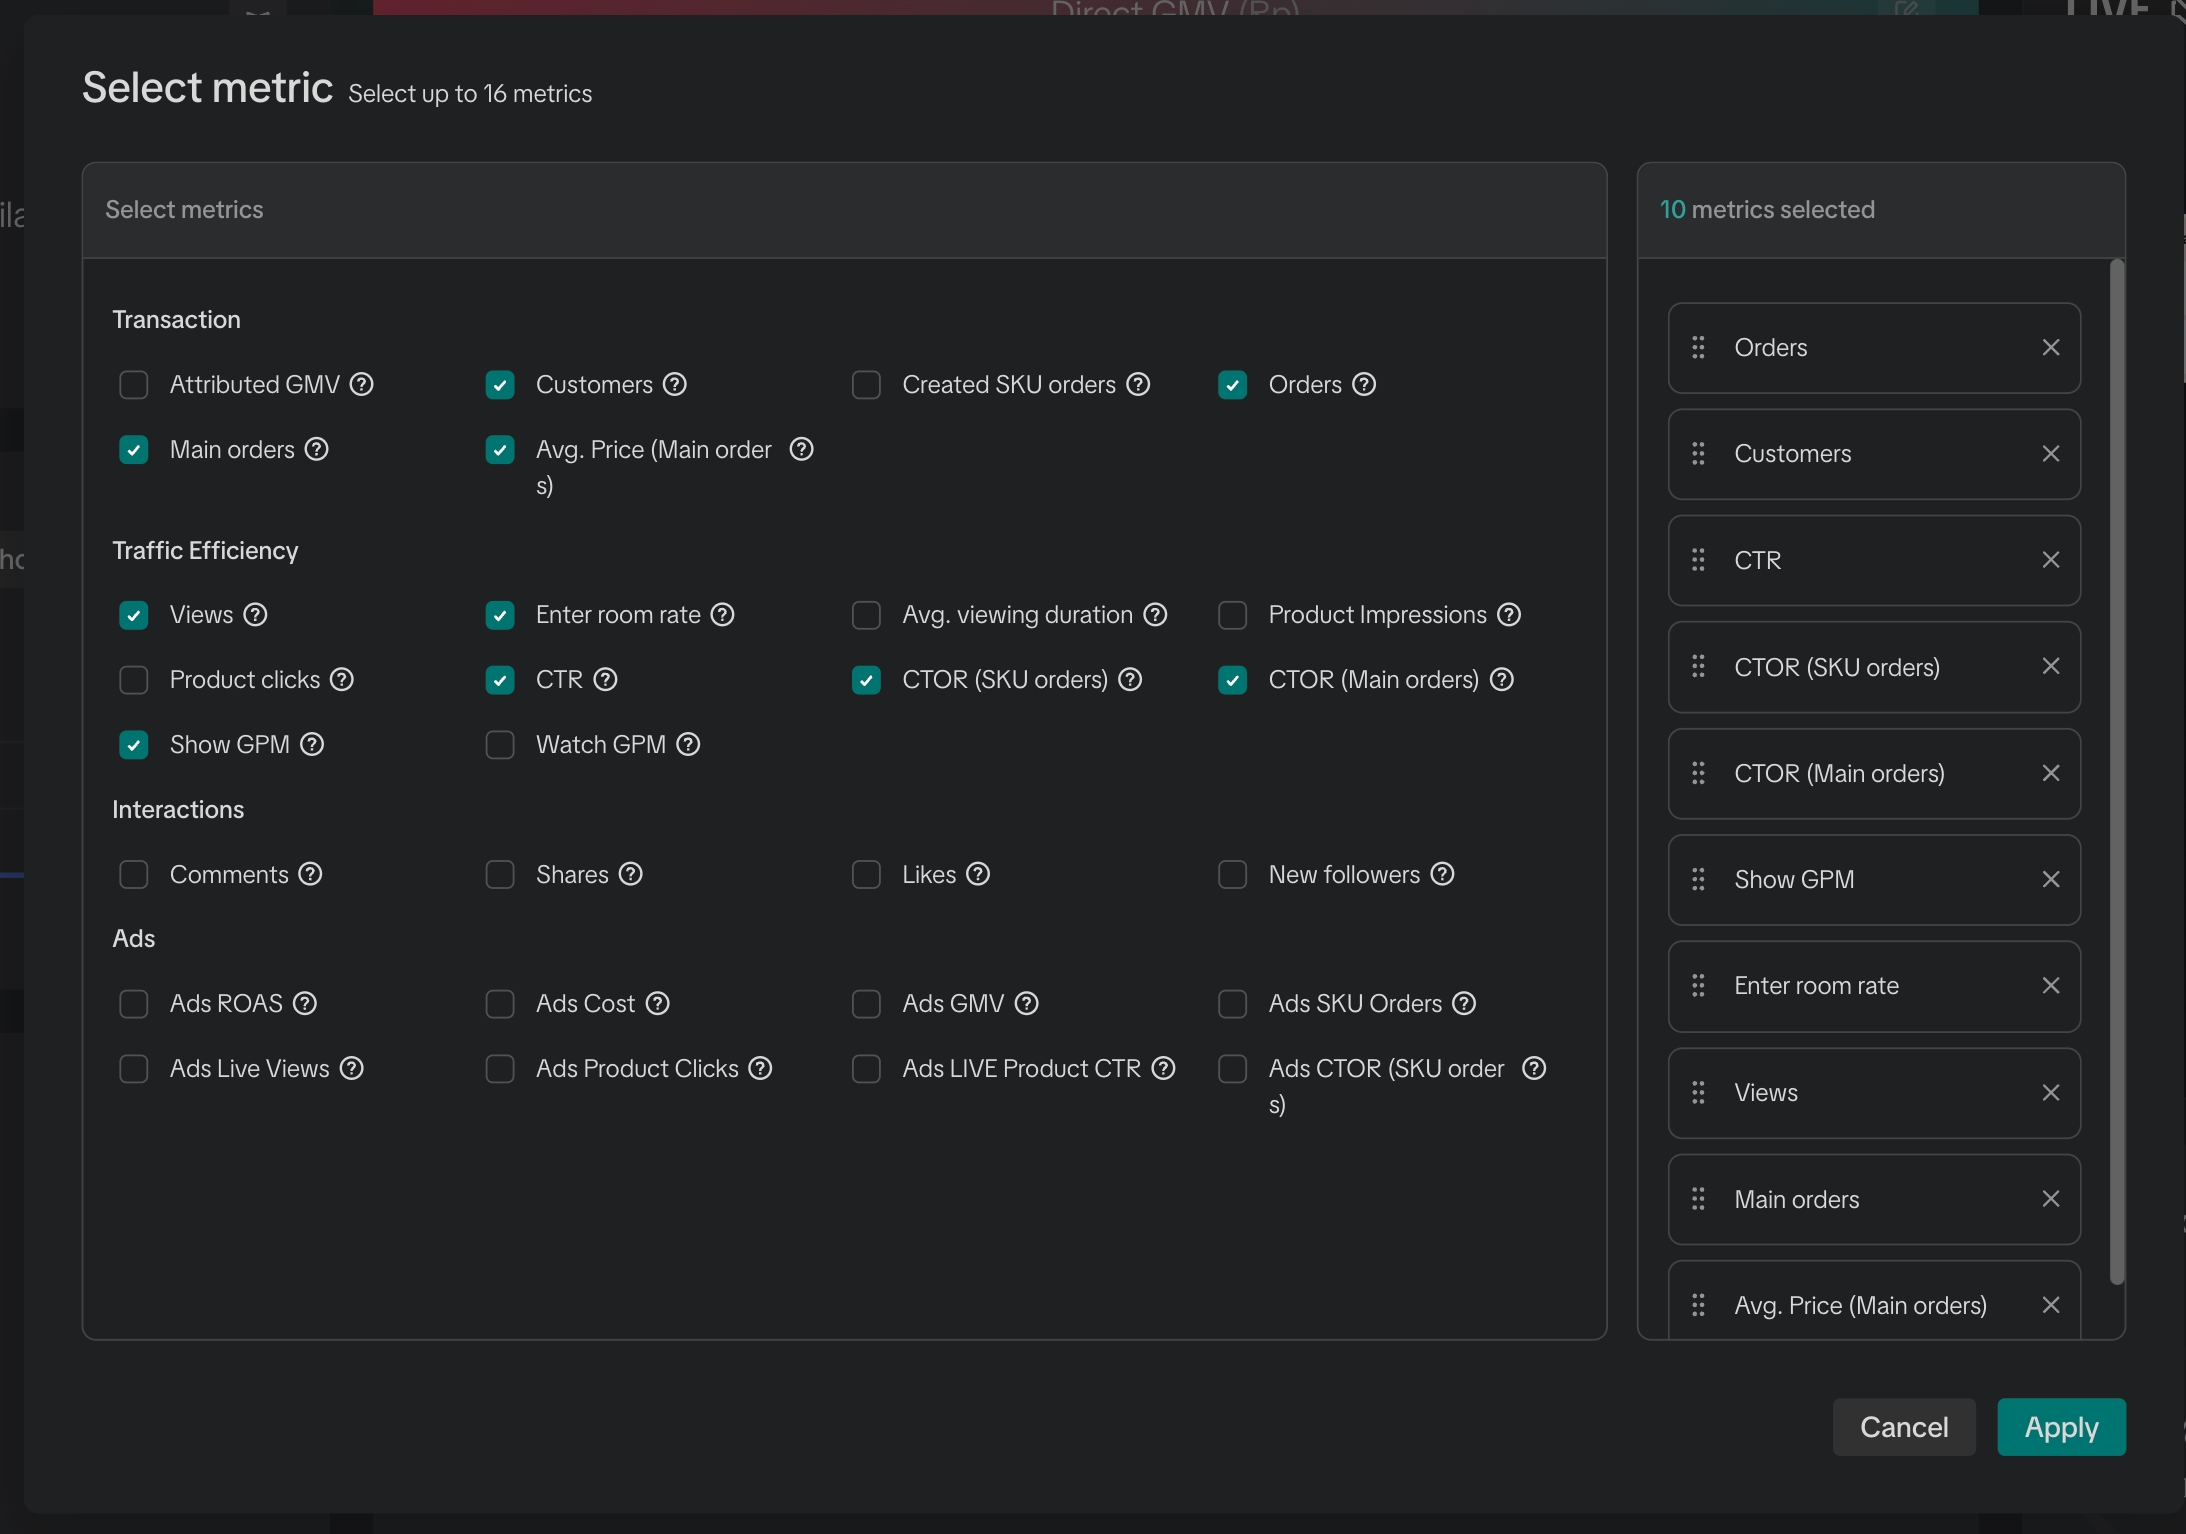 |
|
| Product information | 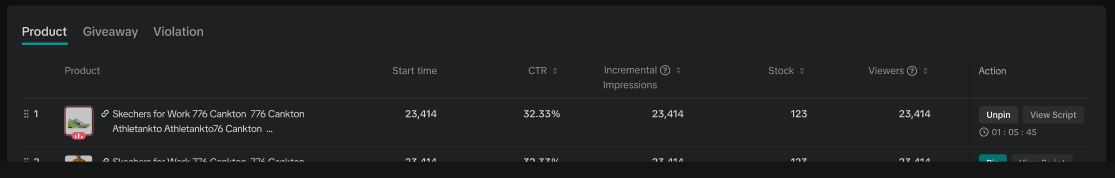 |
|
| Content quality information | 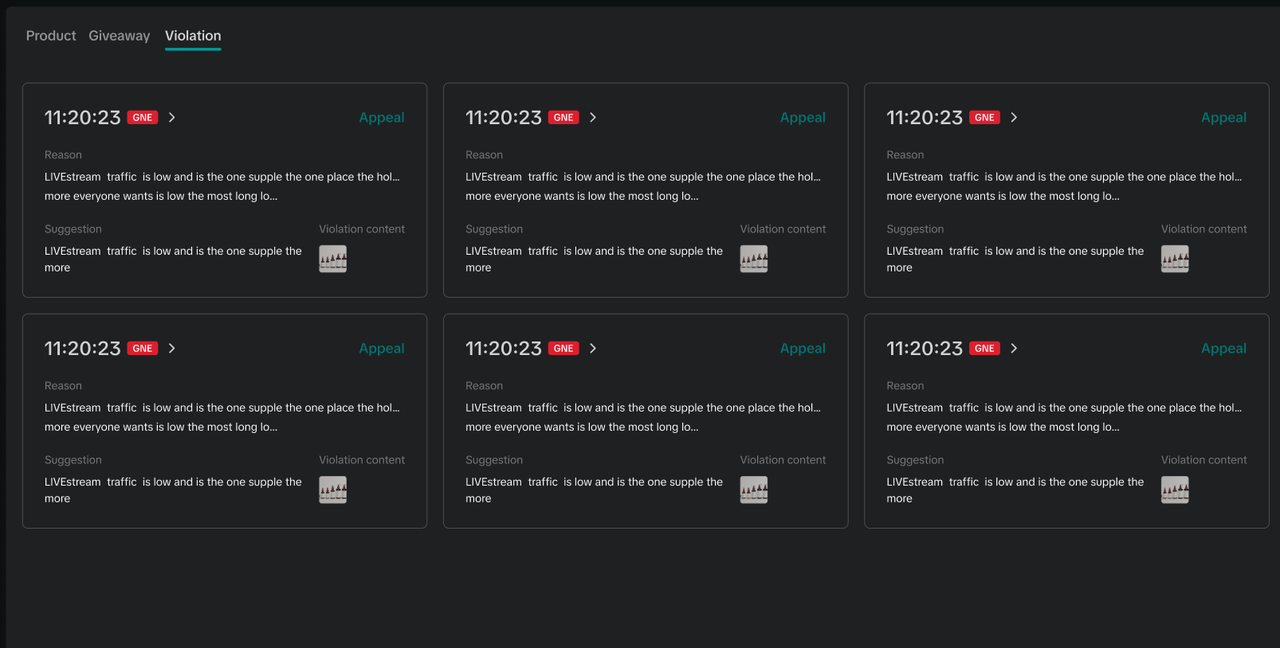 |
|
| Promotions | 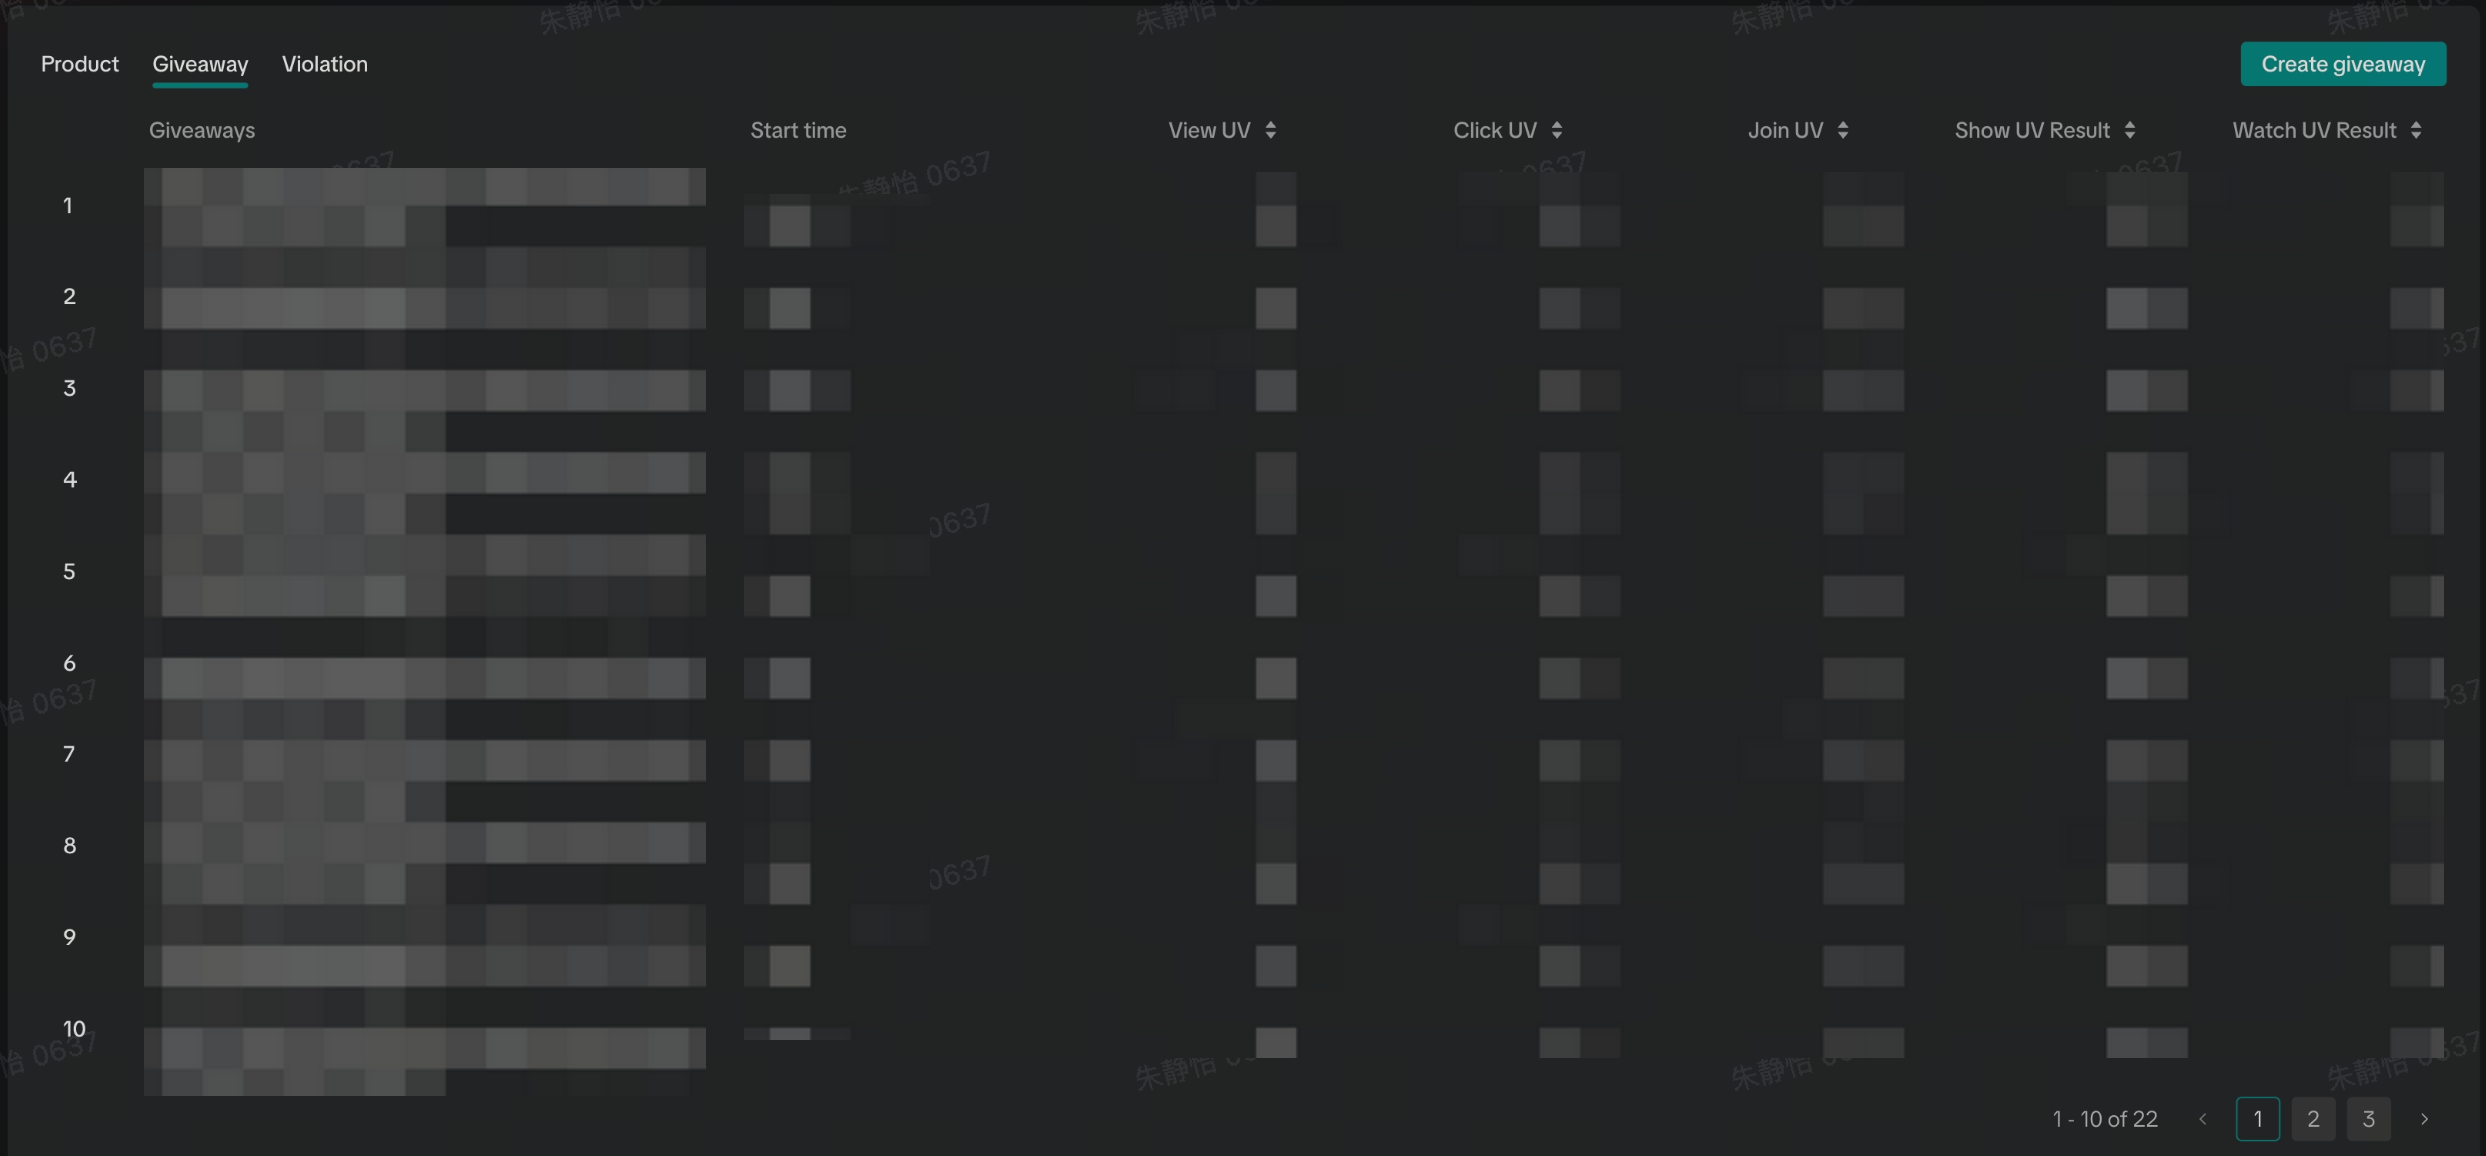 |
|
| LIVE broadcast |  |
|
Traffic source tab
| Functionality/Component | UI interface | Key functionalities/capabilities |
| All figures depicted are dummy values and do not represent any real-world data | ||
| Channel performance grid | 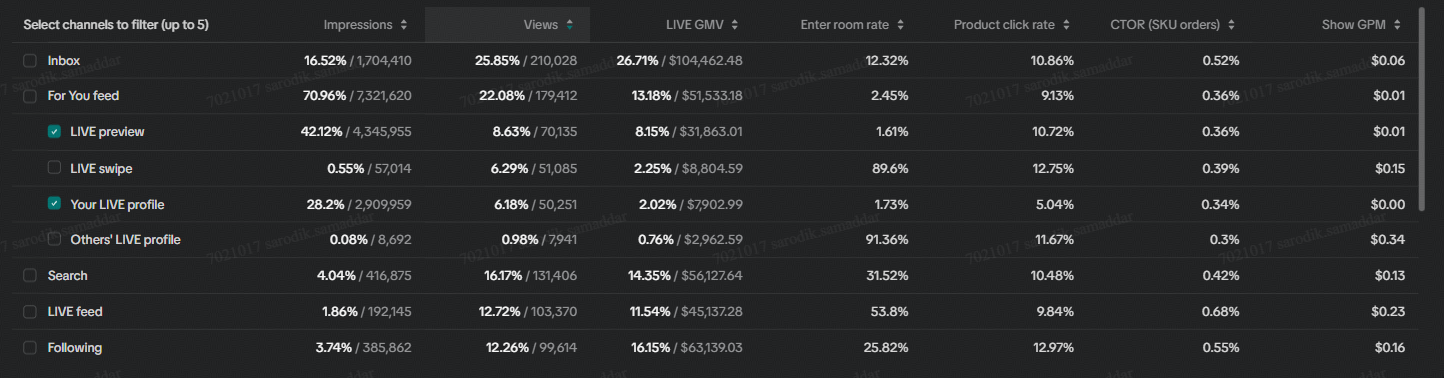 |
|
| Channel performance trend comparison | 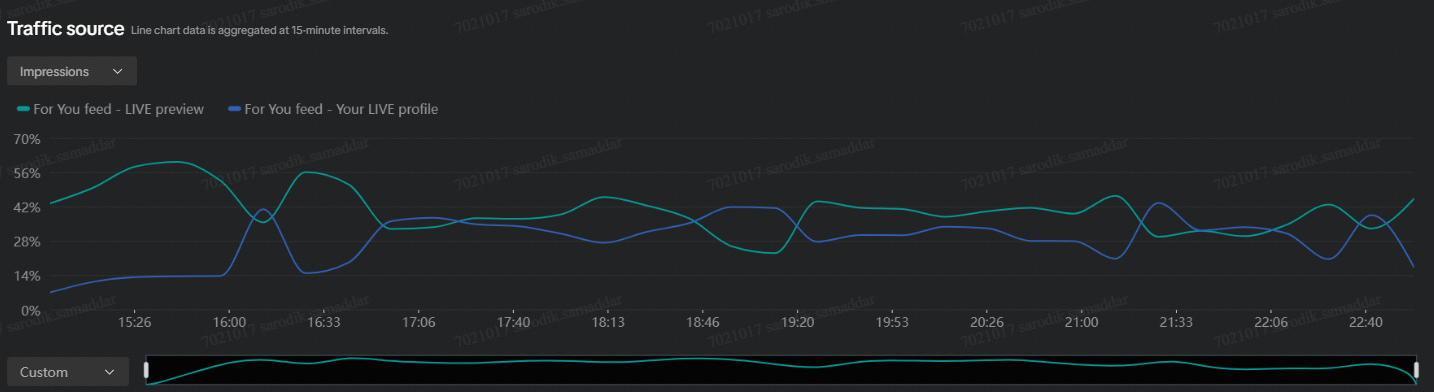 |
|
| Video to LIVE traffic synopsis | 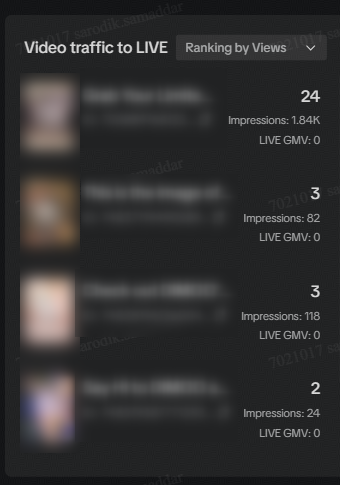 |
|
| LIVE Broadcast | 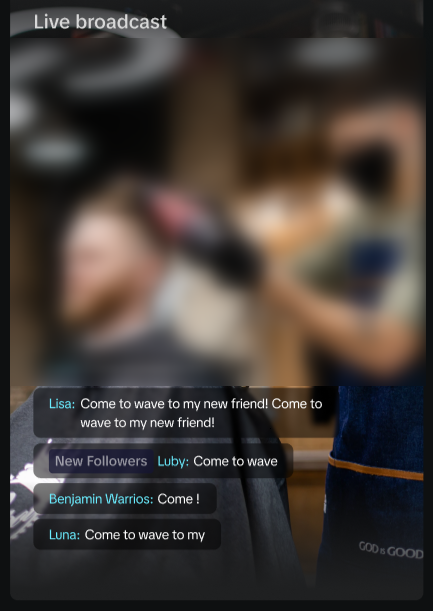 |
|
Frequently Asked Questions (FAQs)
Do I need any special access or permissions to access this unified LIVE dashboard? Any TikTok Shop Creator/Seller performing Shoppable LIVEs will be able to access this functionality without the need for any special access permissions.What interface (PC/APP) will this functionality be available on? In this phase of the launch, the unified LIVE dashboard will only be available on the PC version but users will be able to leverage real-time analytics, during the LIVE, from the in-APP data insights.
What will happen to the old LIVE dashboard interface on PC? After the launch of the unified LIVE dashboard, the existing interface will be replaced for all users with the new functionality.
You may also be interested in
Key Metrics to Observe & How to Access Data
Key Metrics to Observe Understanding key metrics is essential for optimizing your TikTok livestream…

LIVE Highlights - auto posting Short Videos
High level overview Are you looking for a way to easily capture the best moments of your LIVE sessio…
LIVE Promotion Tools: Coupon, Giveaway, Flash Sale
Intro Promotion is a powerful way to boost your LIVE selling sessions, drawing viewers in with excl…
Boost Your LIVE Sales: Advanced Techniques for Showcasing Pr…
Shoppable LIVE is changing the way we shop, bringing products to life and creating real-time connect…
Advanced Product Selection Tips for Your Livestream
Are you ready to take your product selection skills to the next level for your livestreams? A carefu…
Stream Like a Pro with LIVE Manager
Want to take your livestreams to the next level? With TikTok's LIVE Manager, creators can operate th…
Level Up TikTok LIVE with LIVE Manager Tools
Are you ready to level up your TikTok LIVE sessions? Streaming from your desktop can offer more cont…
Refining Your Product Selection Strategy with Recommended Pr…
Looking to level up your LIVE shopping strategy? Recommended Product Tags make it easier to discover…
Optimizing LIVE Performance: A guide to tracking and diagnos…
**All following data and figures are mock values and are NOT associated with any real-world user dat…
Track LIVE Performance in Real-Time
**All following data and figures are mock values and are NOT associated with any real-world user dat…